

JD.com
A Structural Floor at a Structural Discount



1 · FUNDAMENTALS
COMPANY BACKGROUND

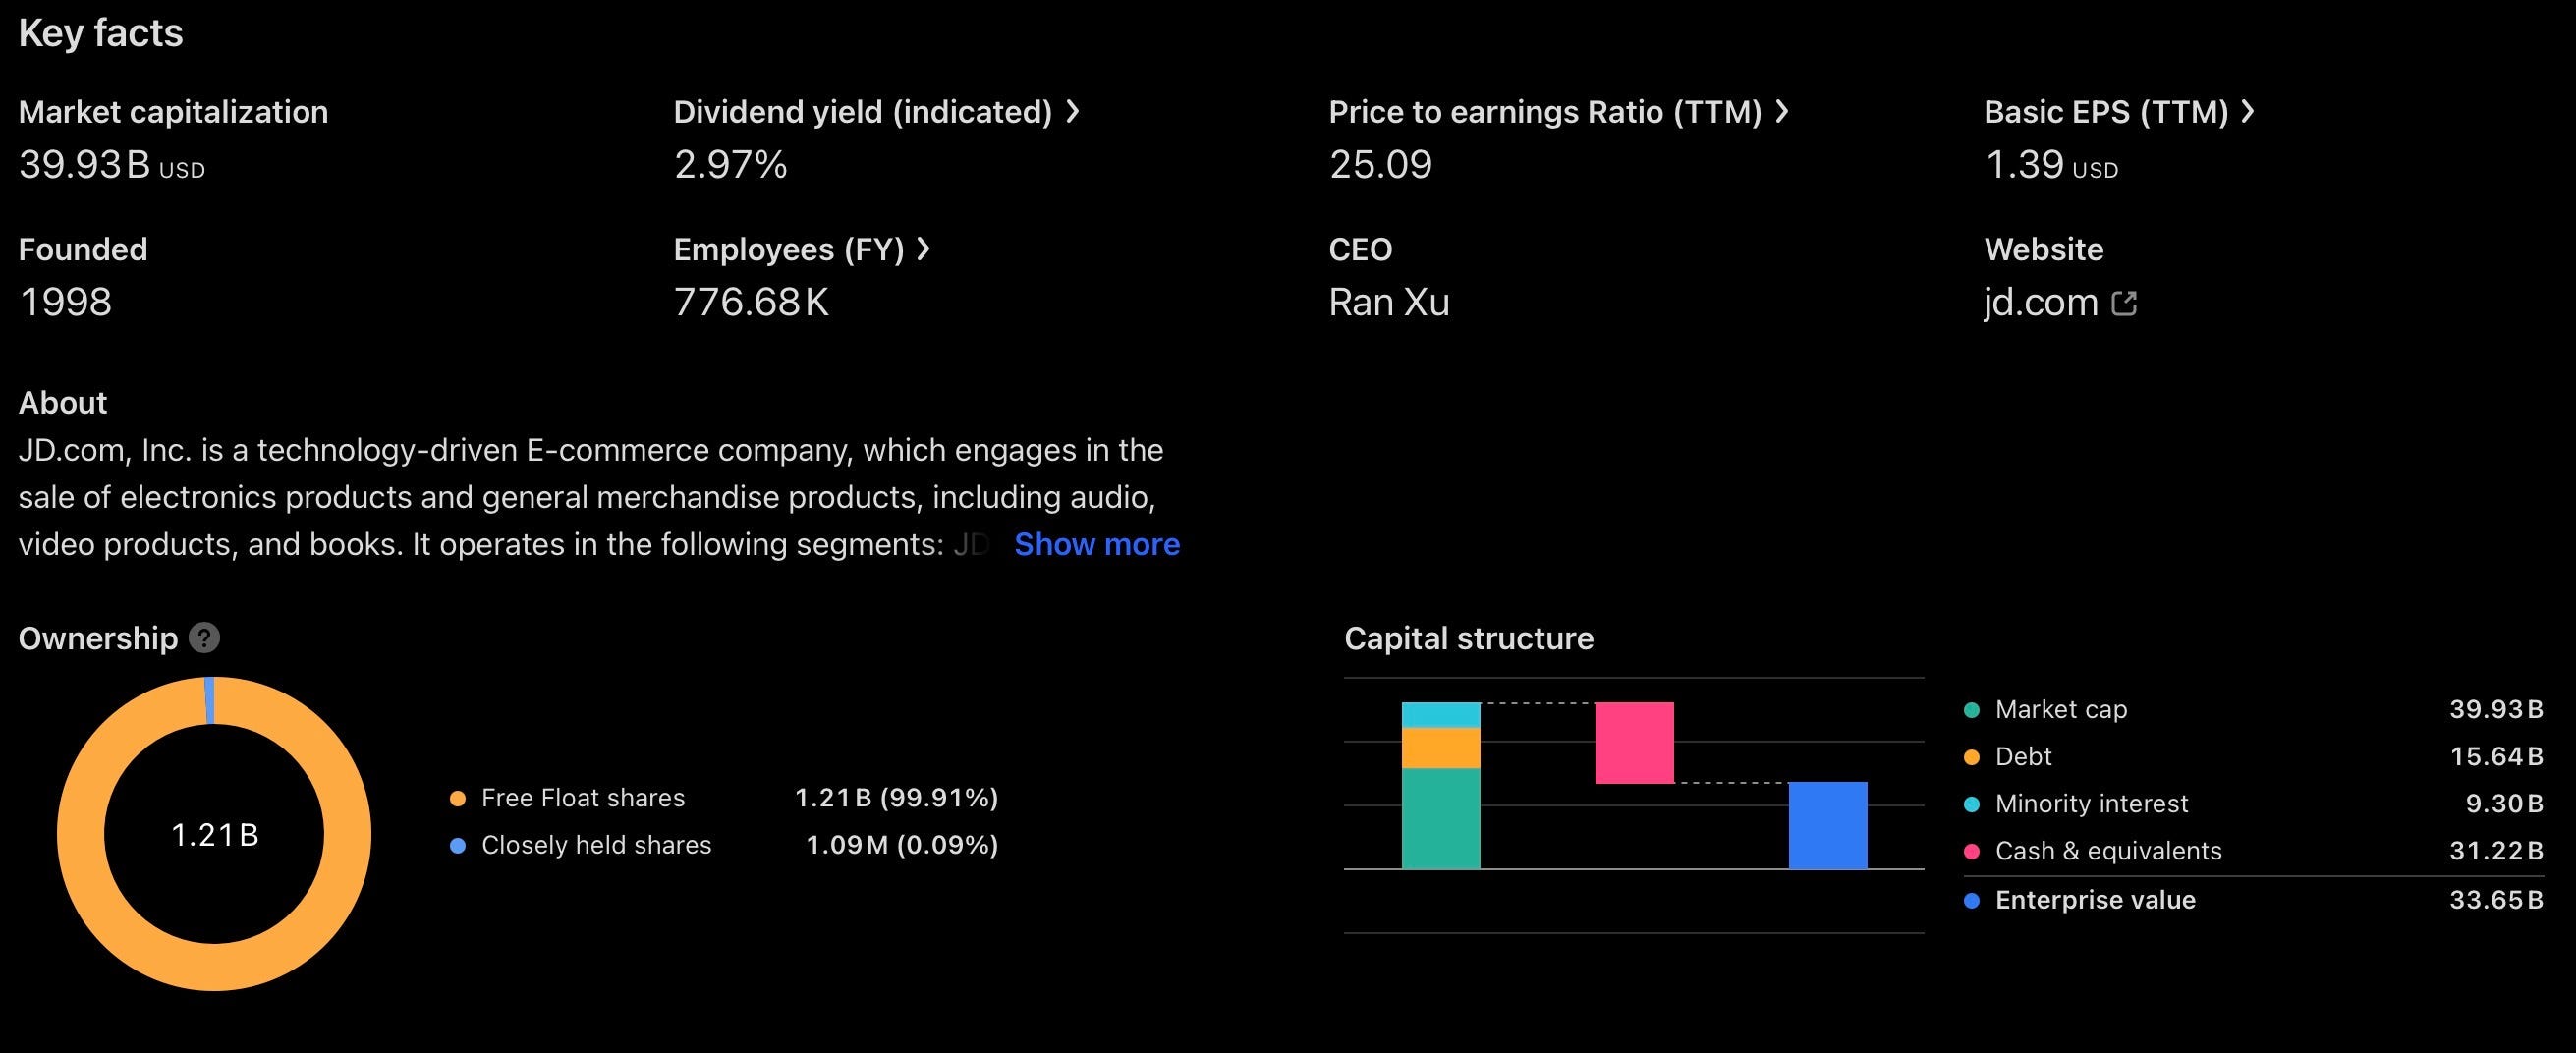
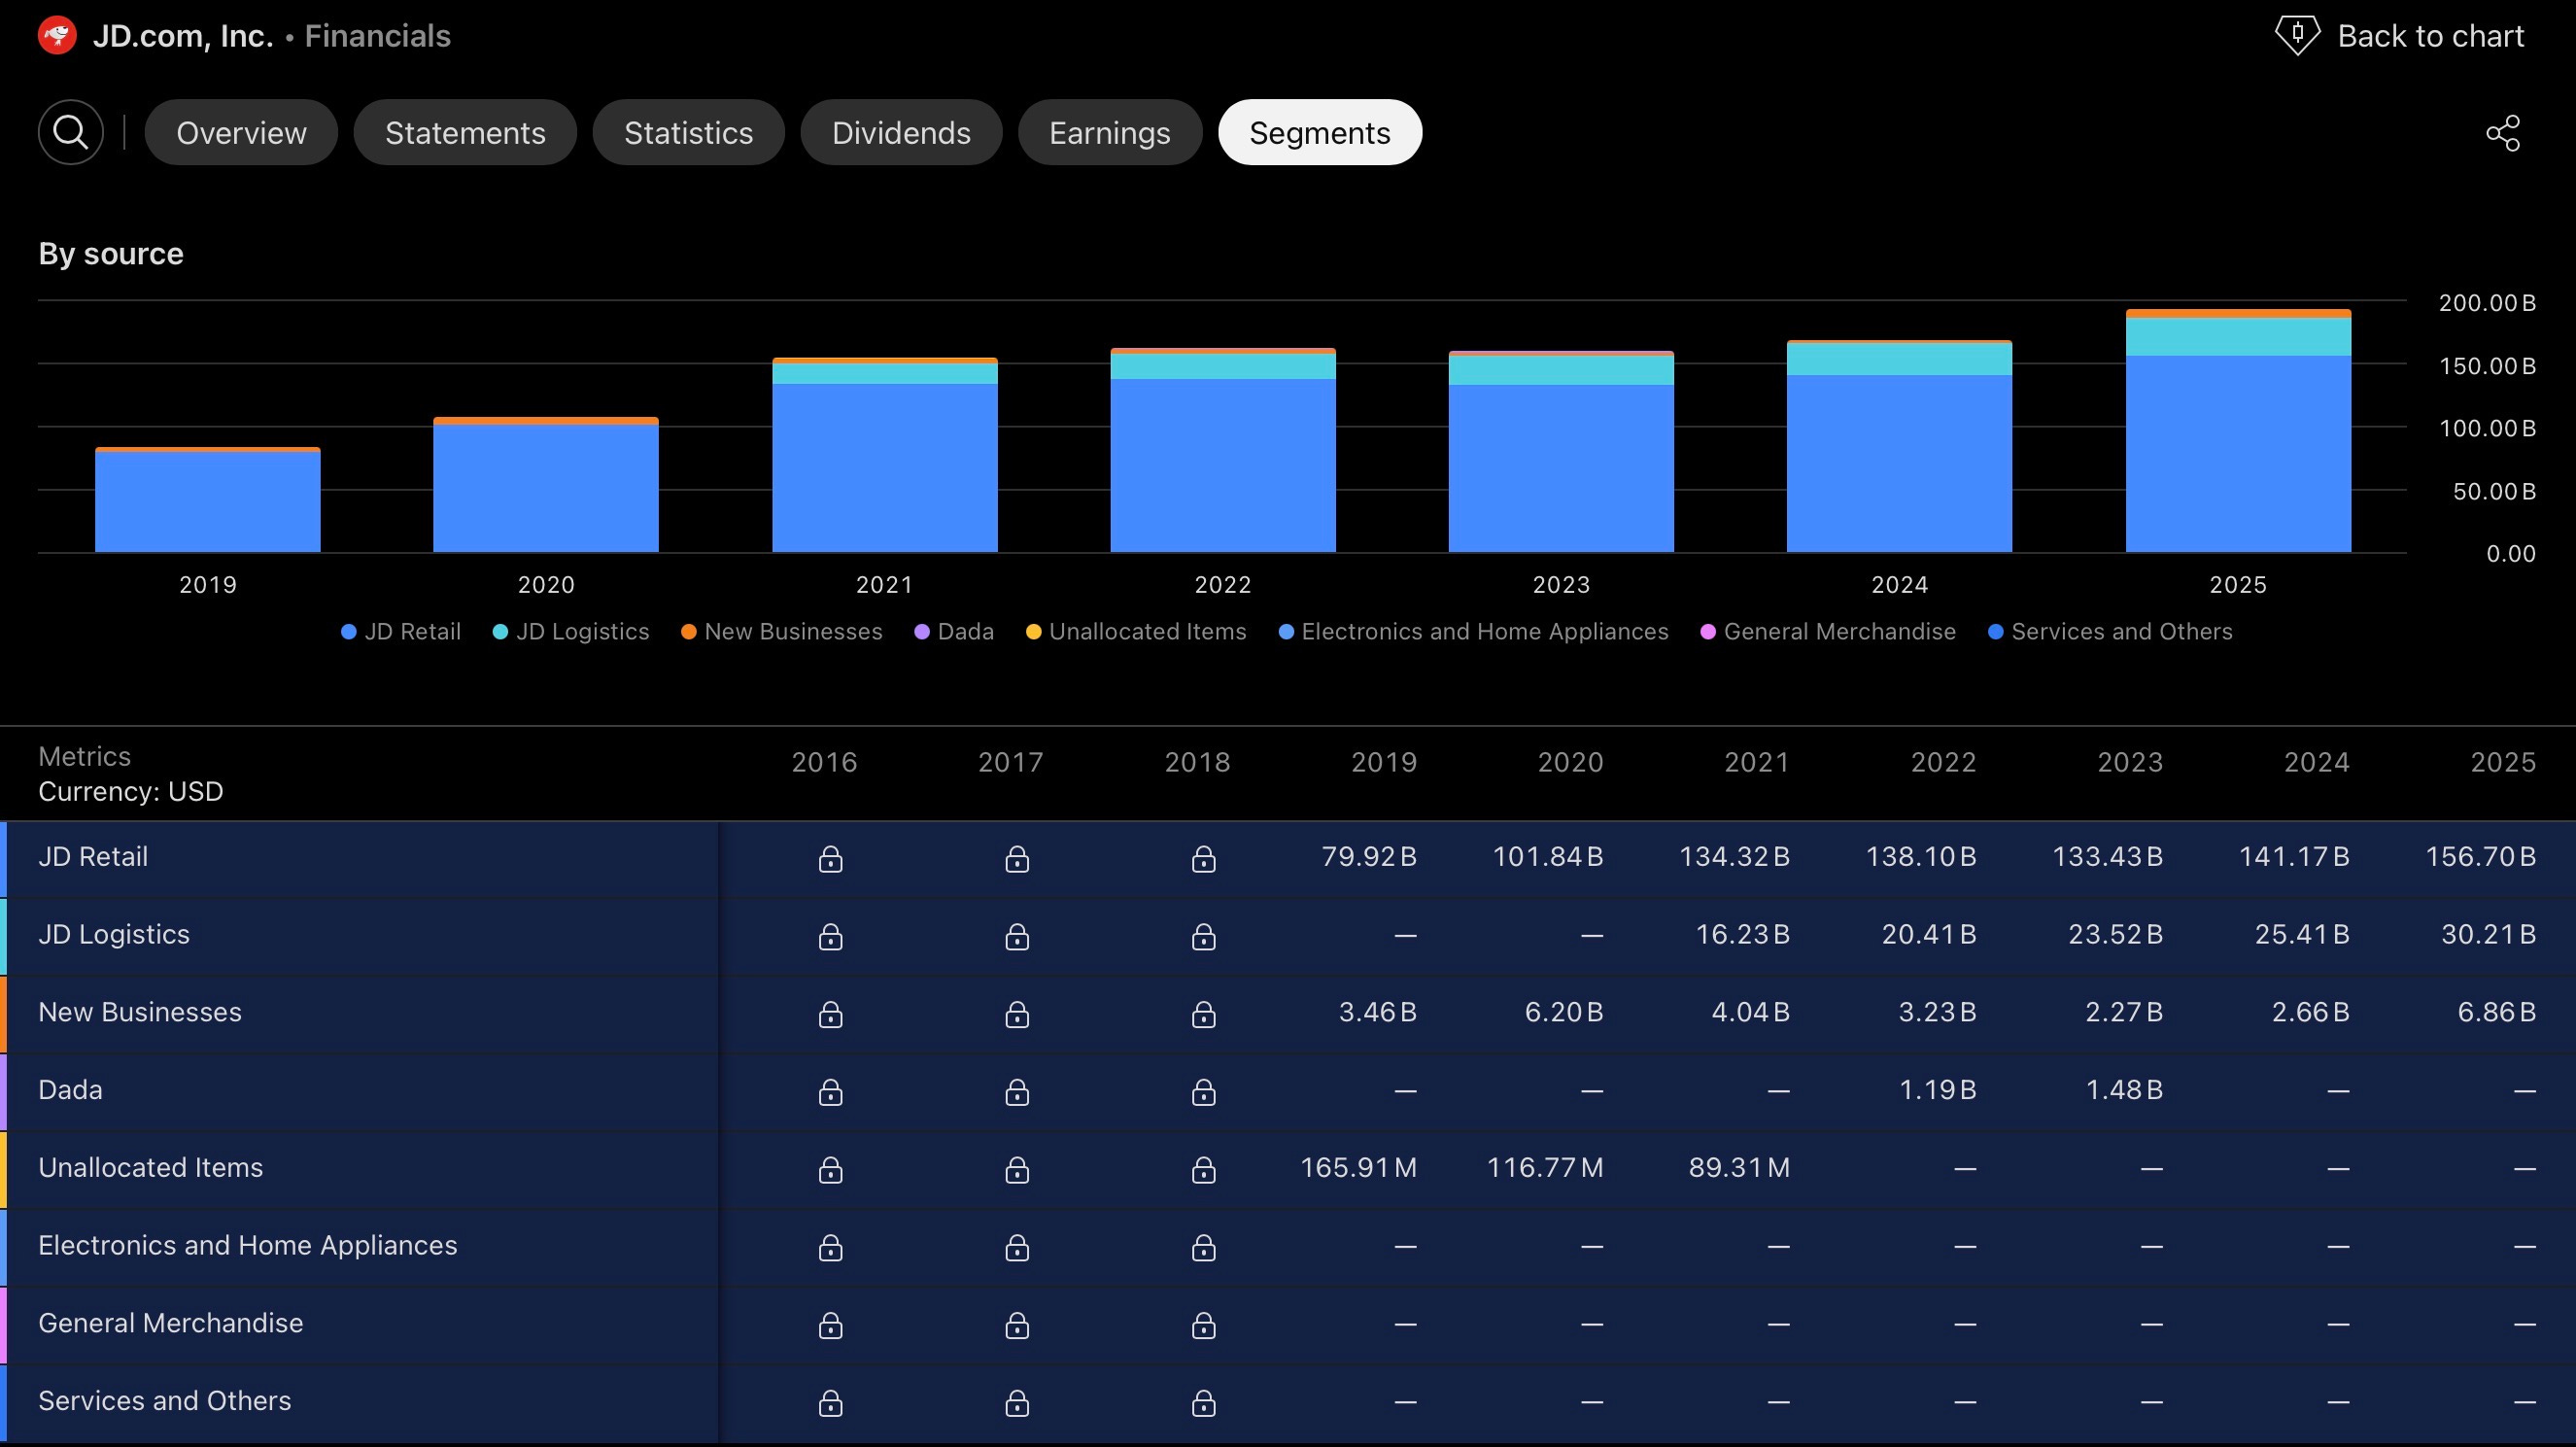
JD.com is a Beijing-headquartered e-commerce and supply chain technology company, dual-listed on NASDAQ (ADR: JD) and the Hong Kong Stock Exchange (9618.HK), and ranked as China’s third-largest e-commerce platform by gross merchandise volume. Where rivals such as Alibaba and PDD Holdings built their businesses primarily around third-party marketplaces, JD’s differentiator has always been its self-operated, first-party retail model paired with JD Logistics, its own nationwide fulfillment and last-mile delivery network staffed by JD’s own employees rather than a fragmented courier network. That combination has made JD the default destination in China for electronics, computers, and home appliances, categories where authenticity and delivery speed carry a premium, and it operates through three reporting segments: JD Retail (which also houses JD Health and JD Industrials), JD Logistics, and New Businesses.
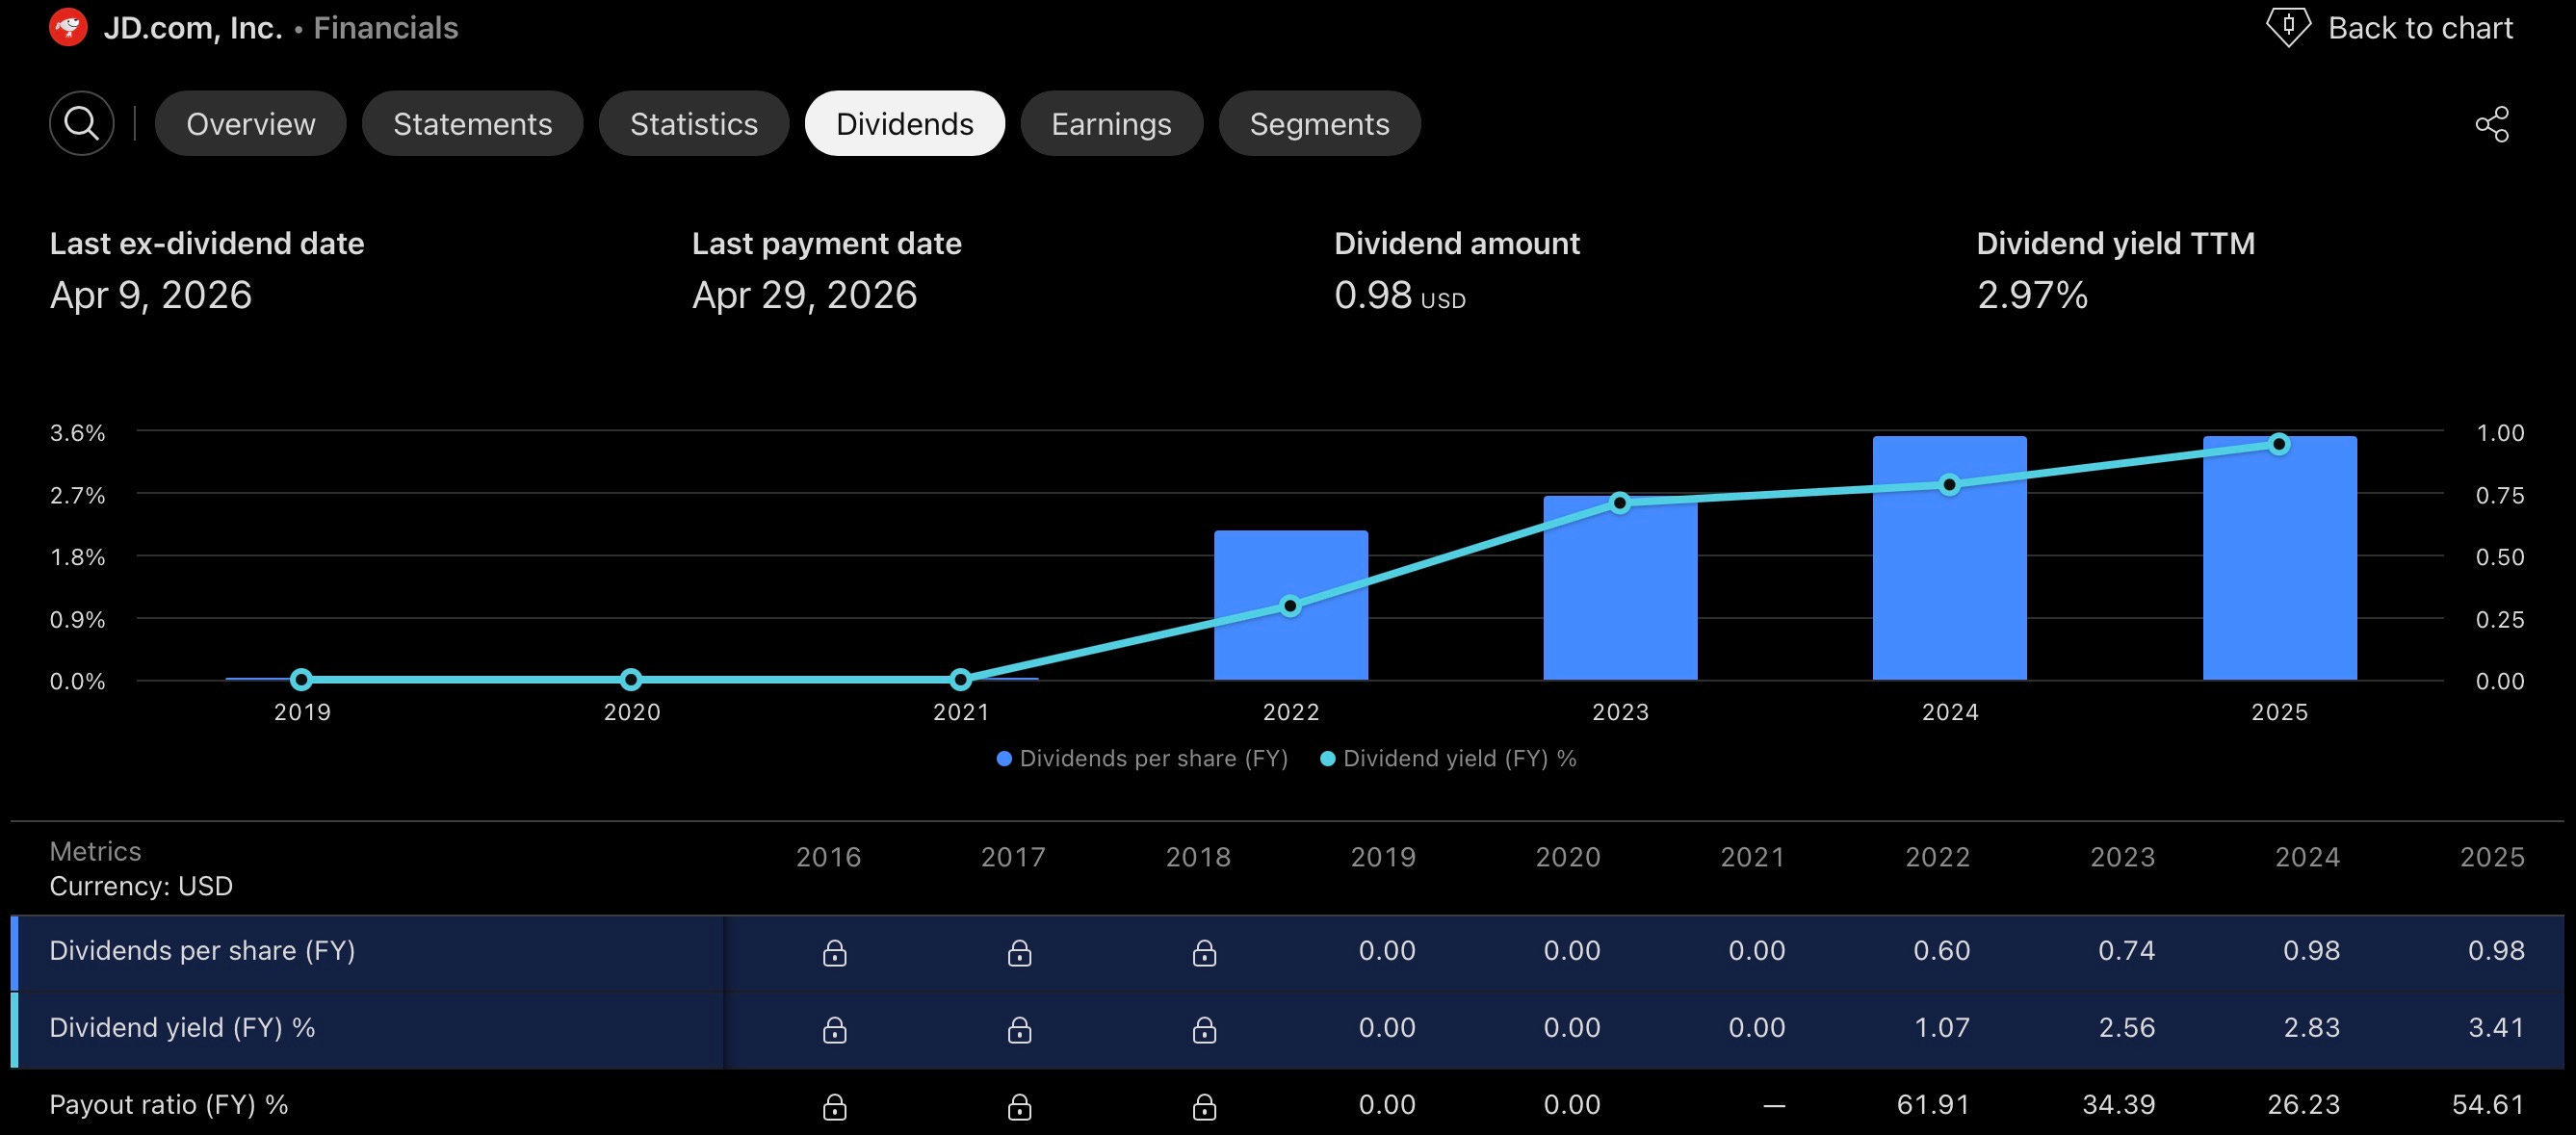
The past eighteen months have been defined by JD’s aggressive push into food delivery, where it has gone head-to-head with Meituan and Alibaba’s Taobao/Ele.me in what the market has come to call China’s “instant retail war.” That investment cycle has been expensive: New Businesses posted an operating loss of RMB 10.35 billion in Q1 2026, though that figure is already down from RMB 14.8 billion in Q4 2025, and management has characterized the investment as having peaked. Alongside this, JD has been expanding internationally under its Joybuy brand, now live in more than thirty European cities, and has agreed to acquire German electronics retailer Ceconomy for roughly €2.2 billion (~$2.5 billion), a deal currently under a full-scale European Commission Foreign Subsidies Regulation investigation with a decision deadline of October 2, 2026. On the capital-returns side, JD has stayed committed to shareholders throughout this investment cycle: an active $5 billion buyback program running through August 2027, an annual dividend of $1.00 per ADS, and continued repurchases even during the heaviest quarters of New Businesses spending.
The broader backdrop matters here too. Chinese consumer demand has stayed uneven through 2025 and into 2026, propped up periodically by government trade-in subsidies for electronics and appliances that have created pronounced base-effect swings in JD’s own numbers, and Chinese ADRs as a group continue to trade under the intermittent shadow of US-China trade and tariff headlines, even though the acute delisting threat tied to the Holding Foreign Companies Accountable Act has been substantially de-risked since the PCAOB’s December 2022 determination that it had gained sufficient access to audit Chinese and Hong Kong-based auditors.
VALUATION
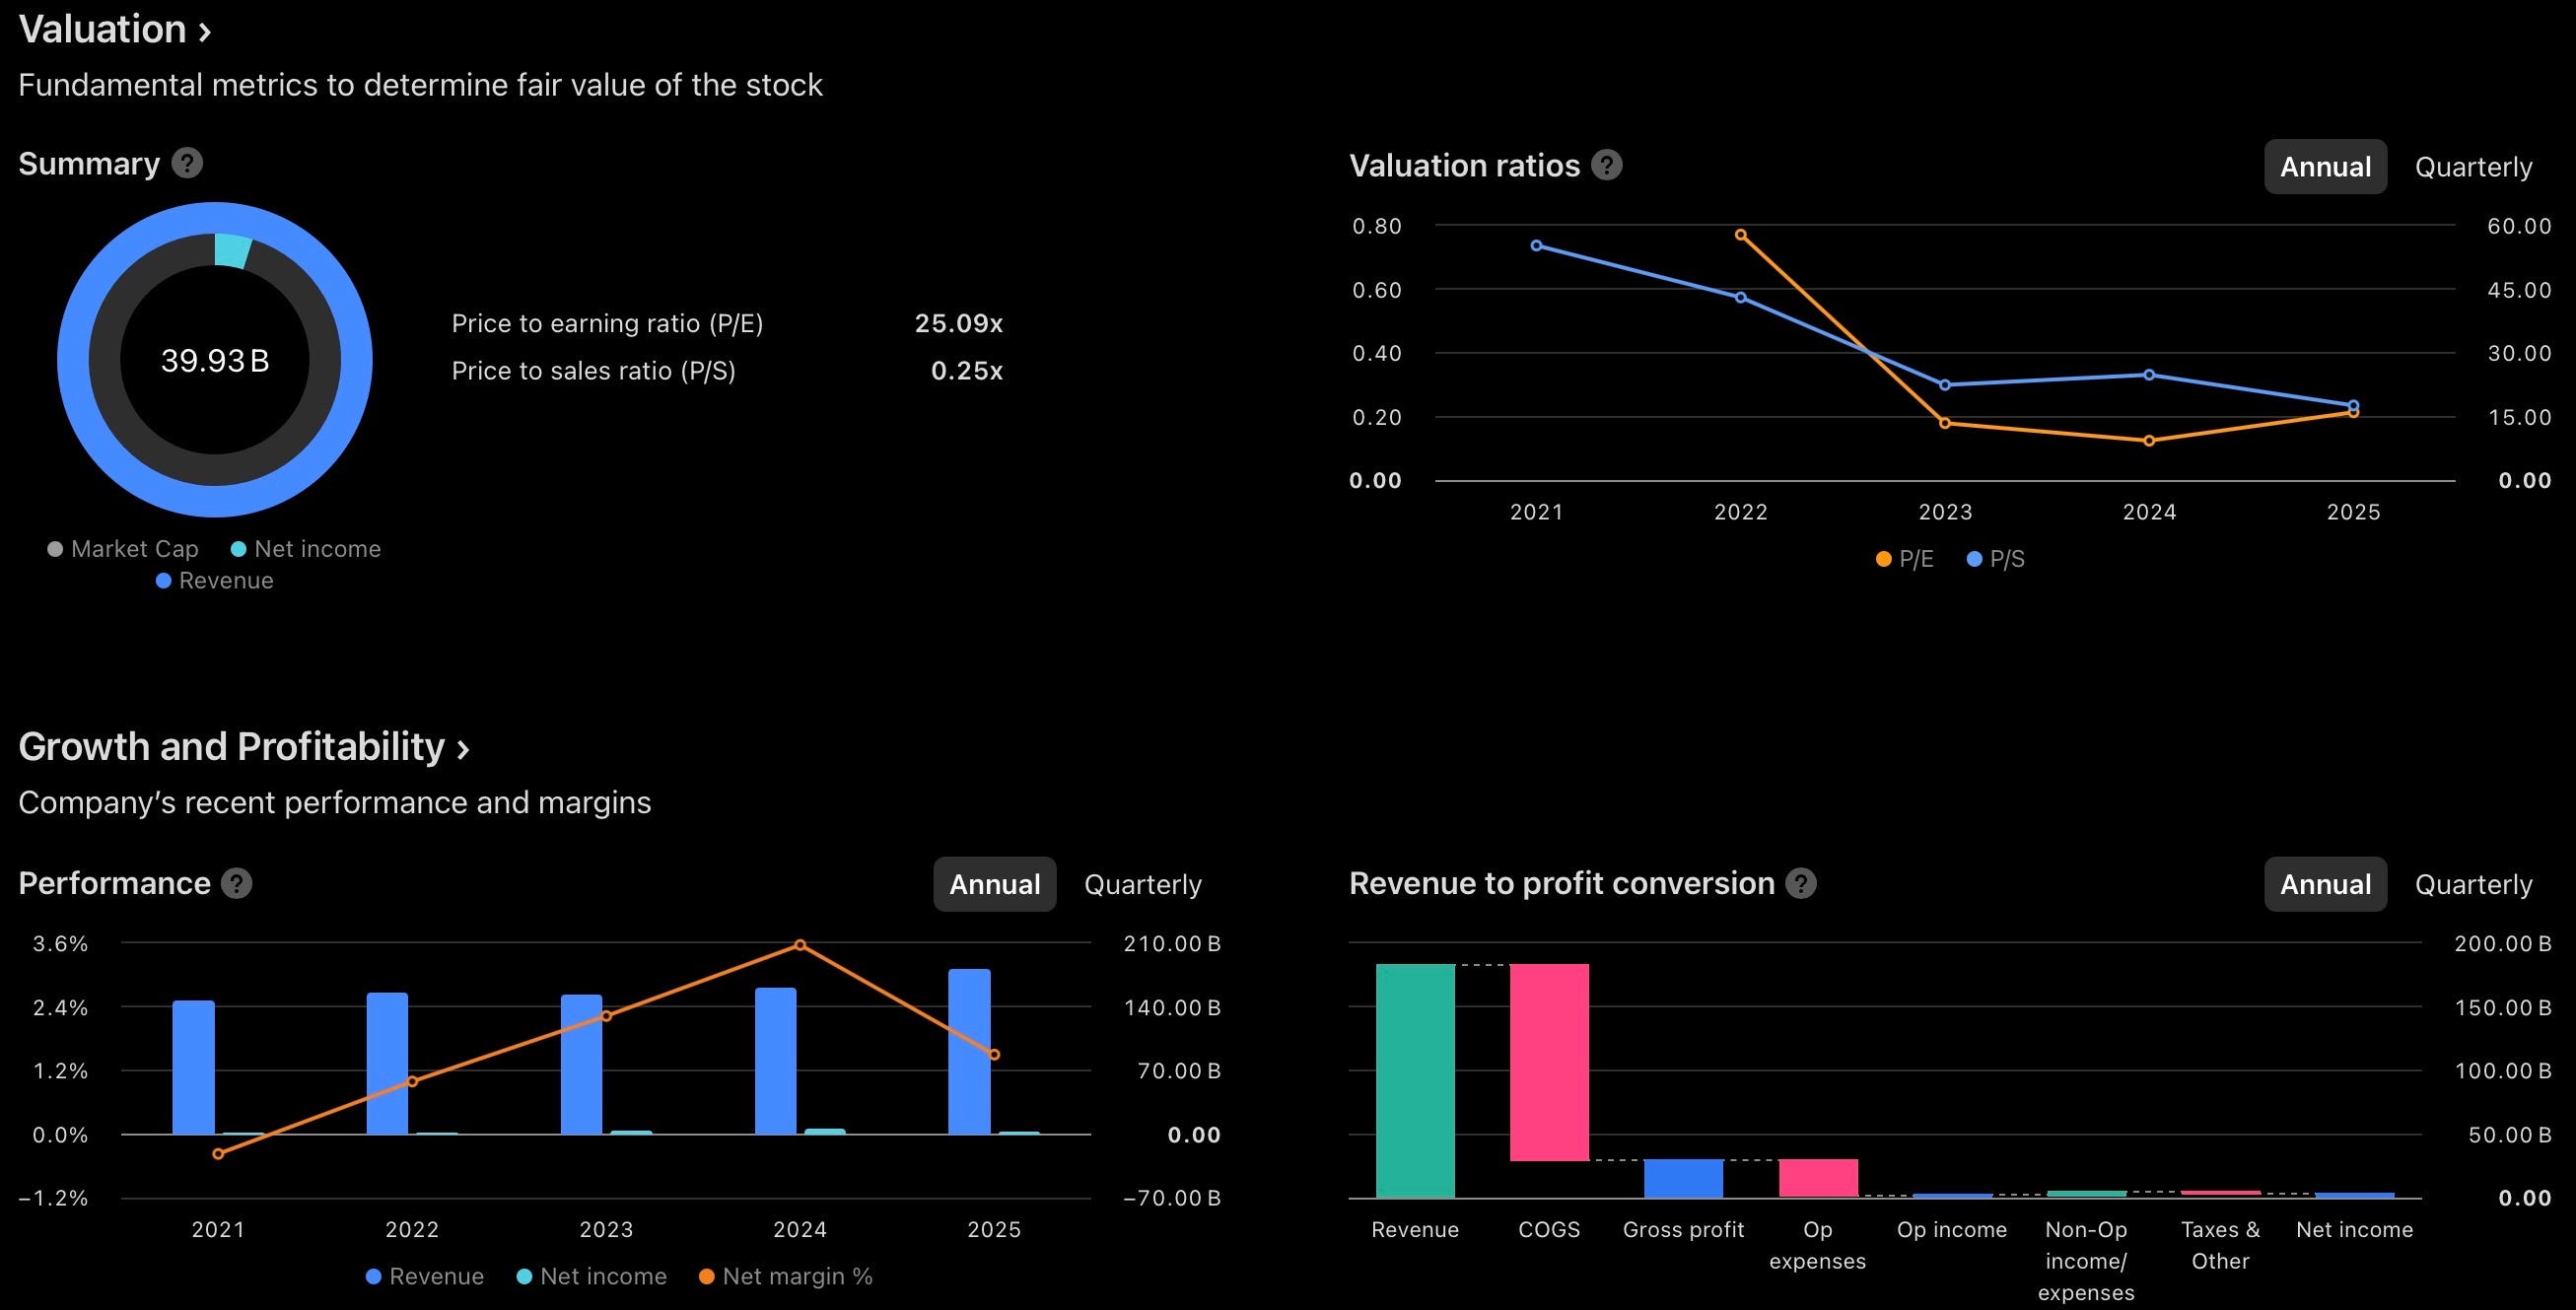
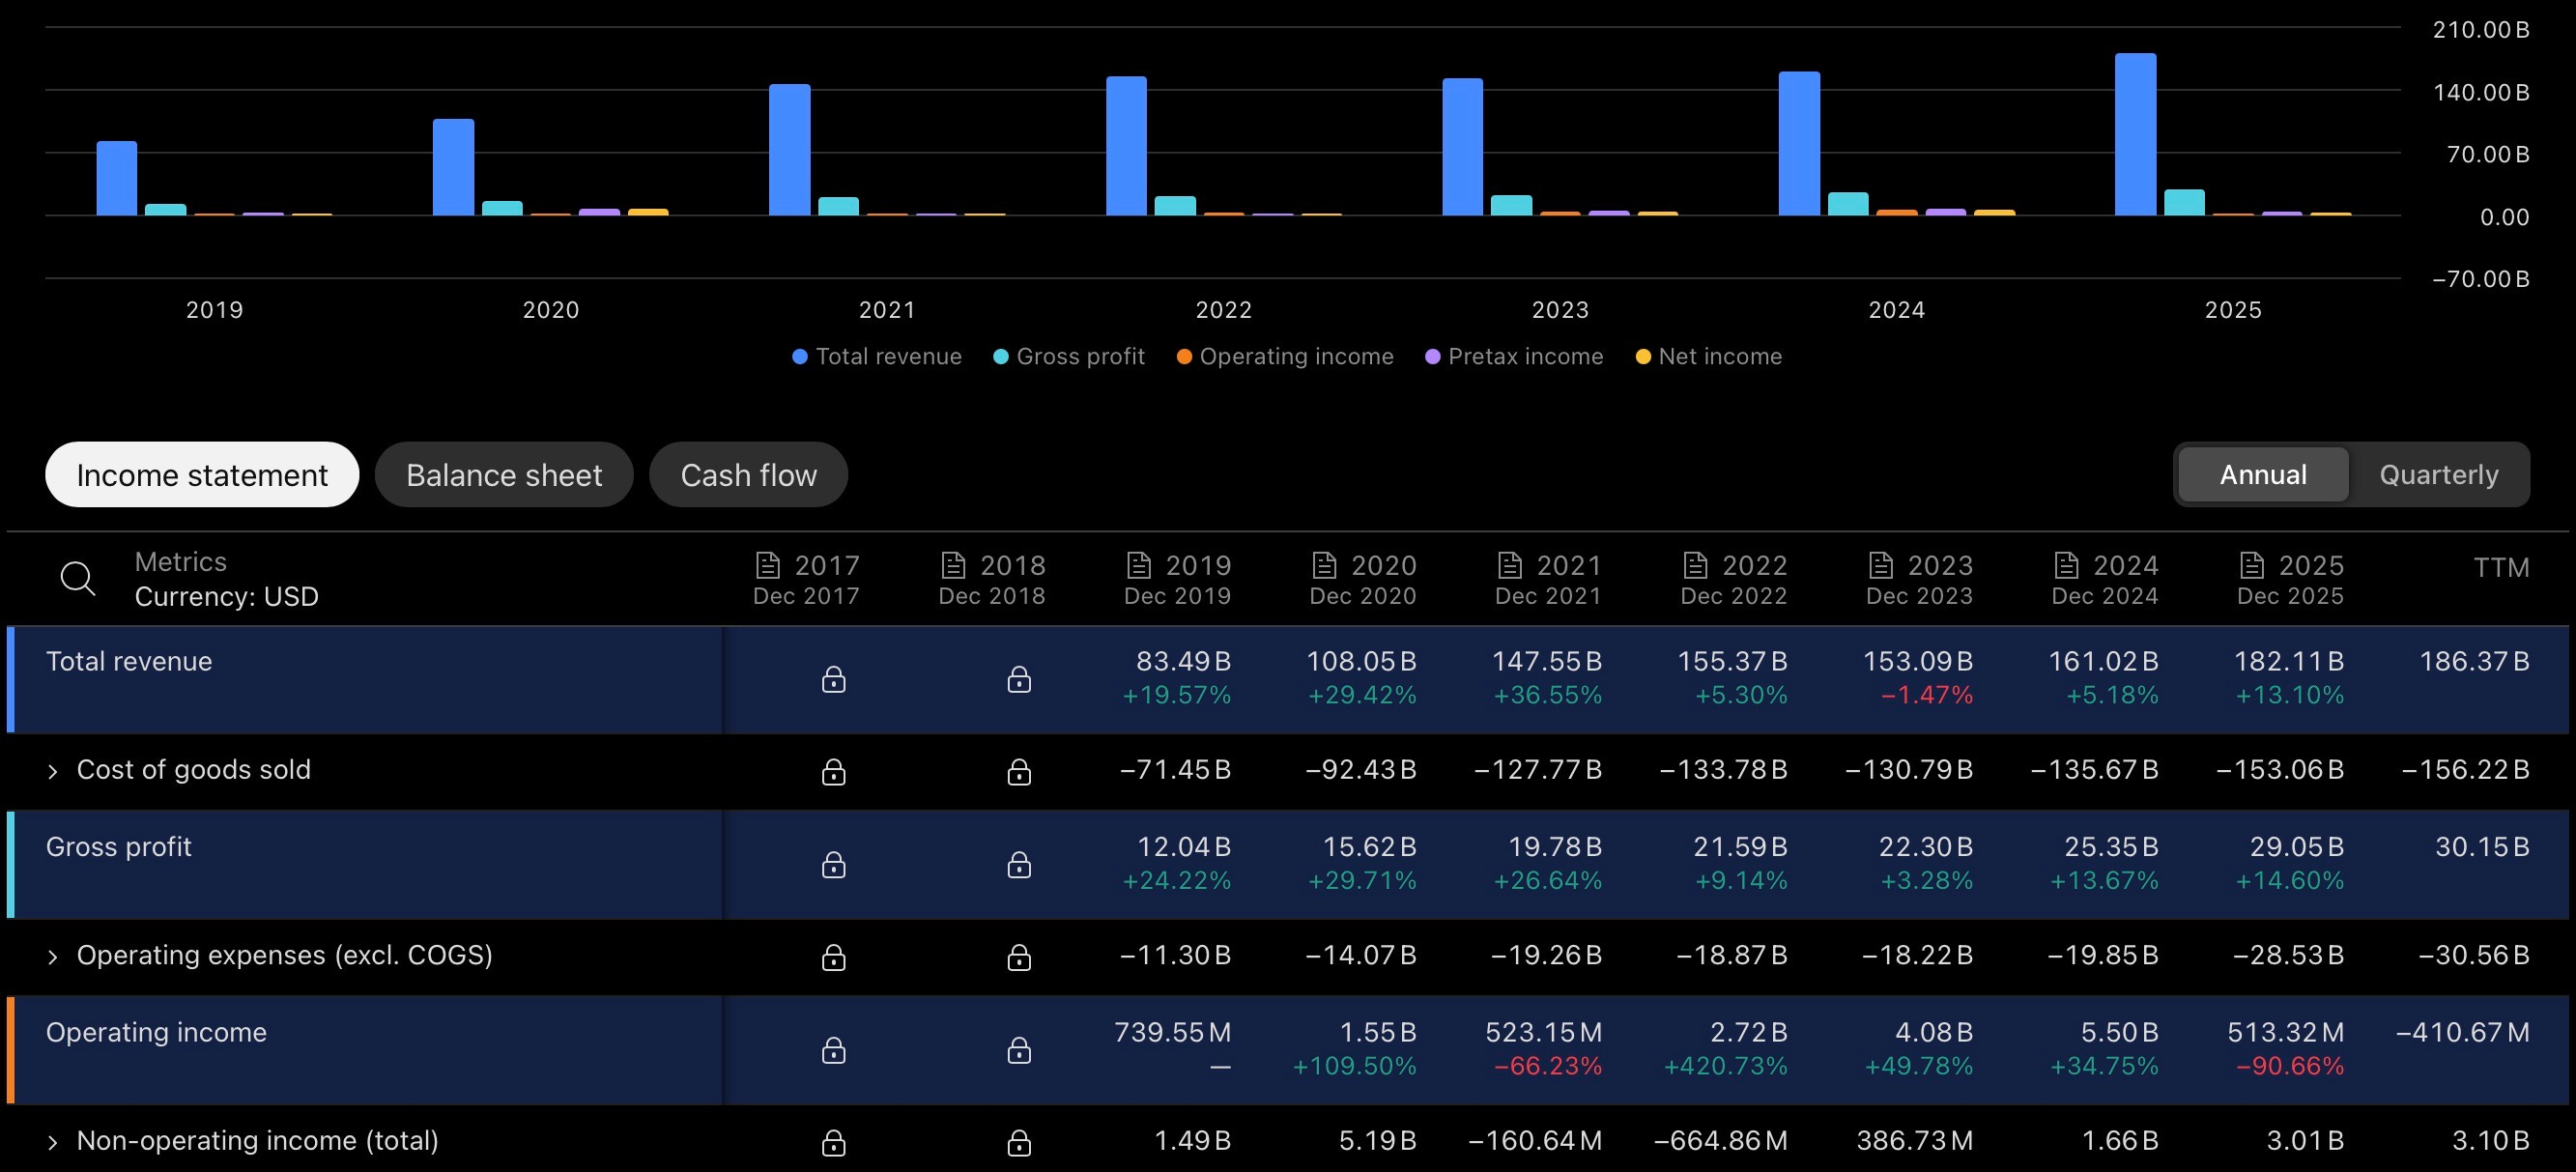
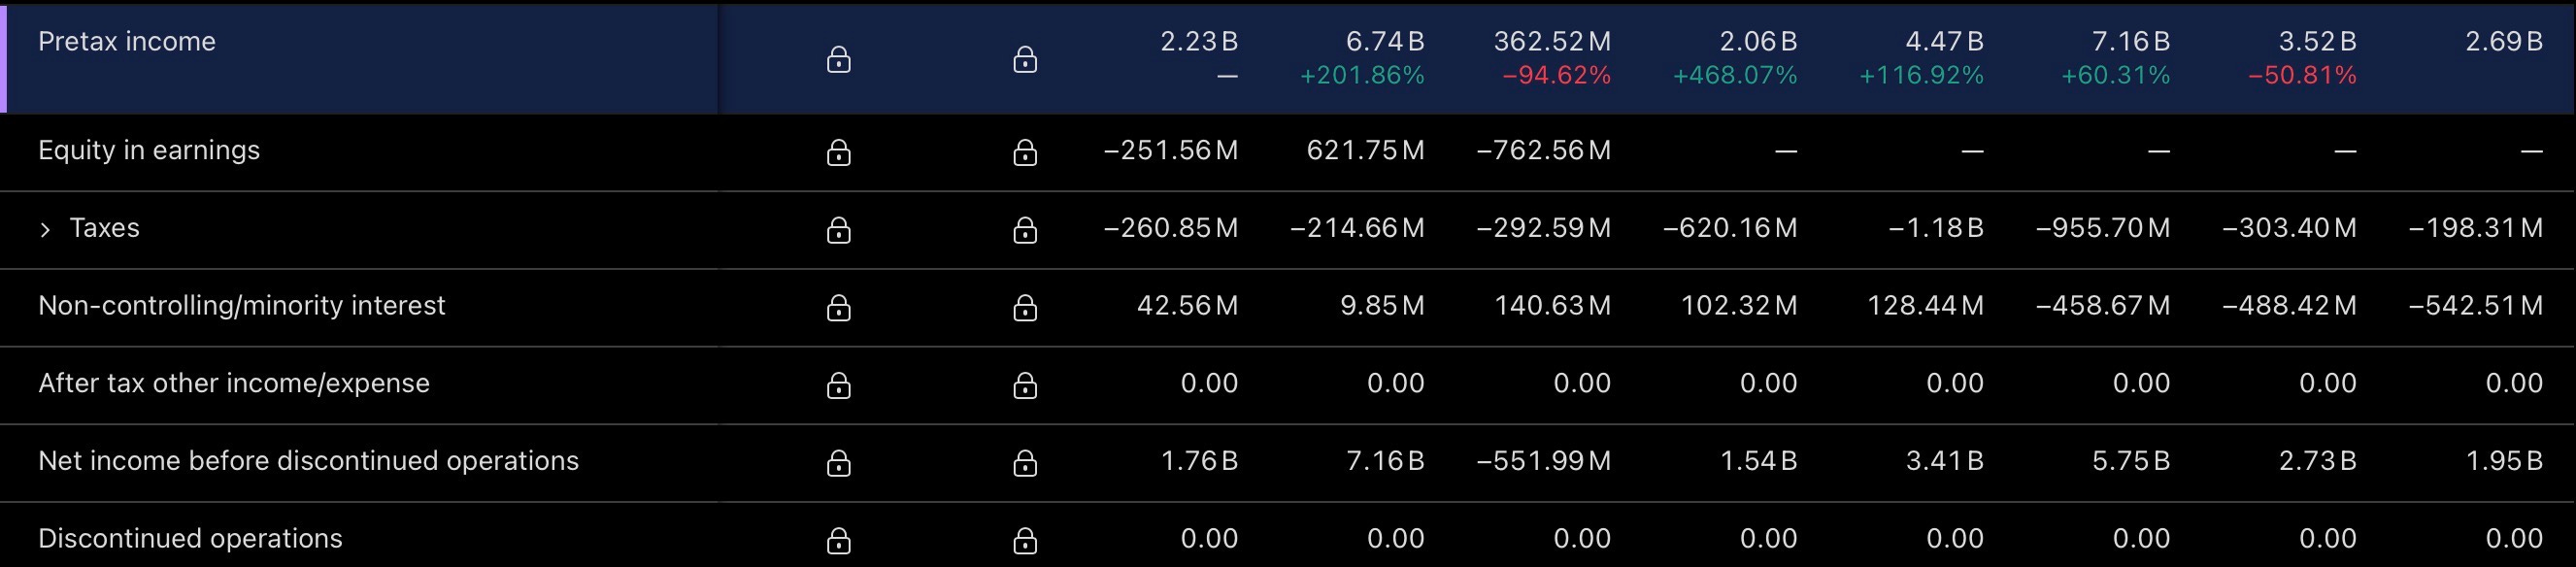
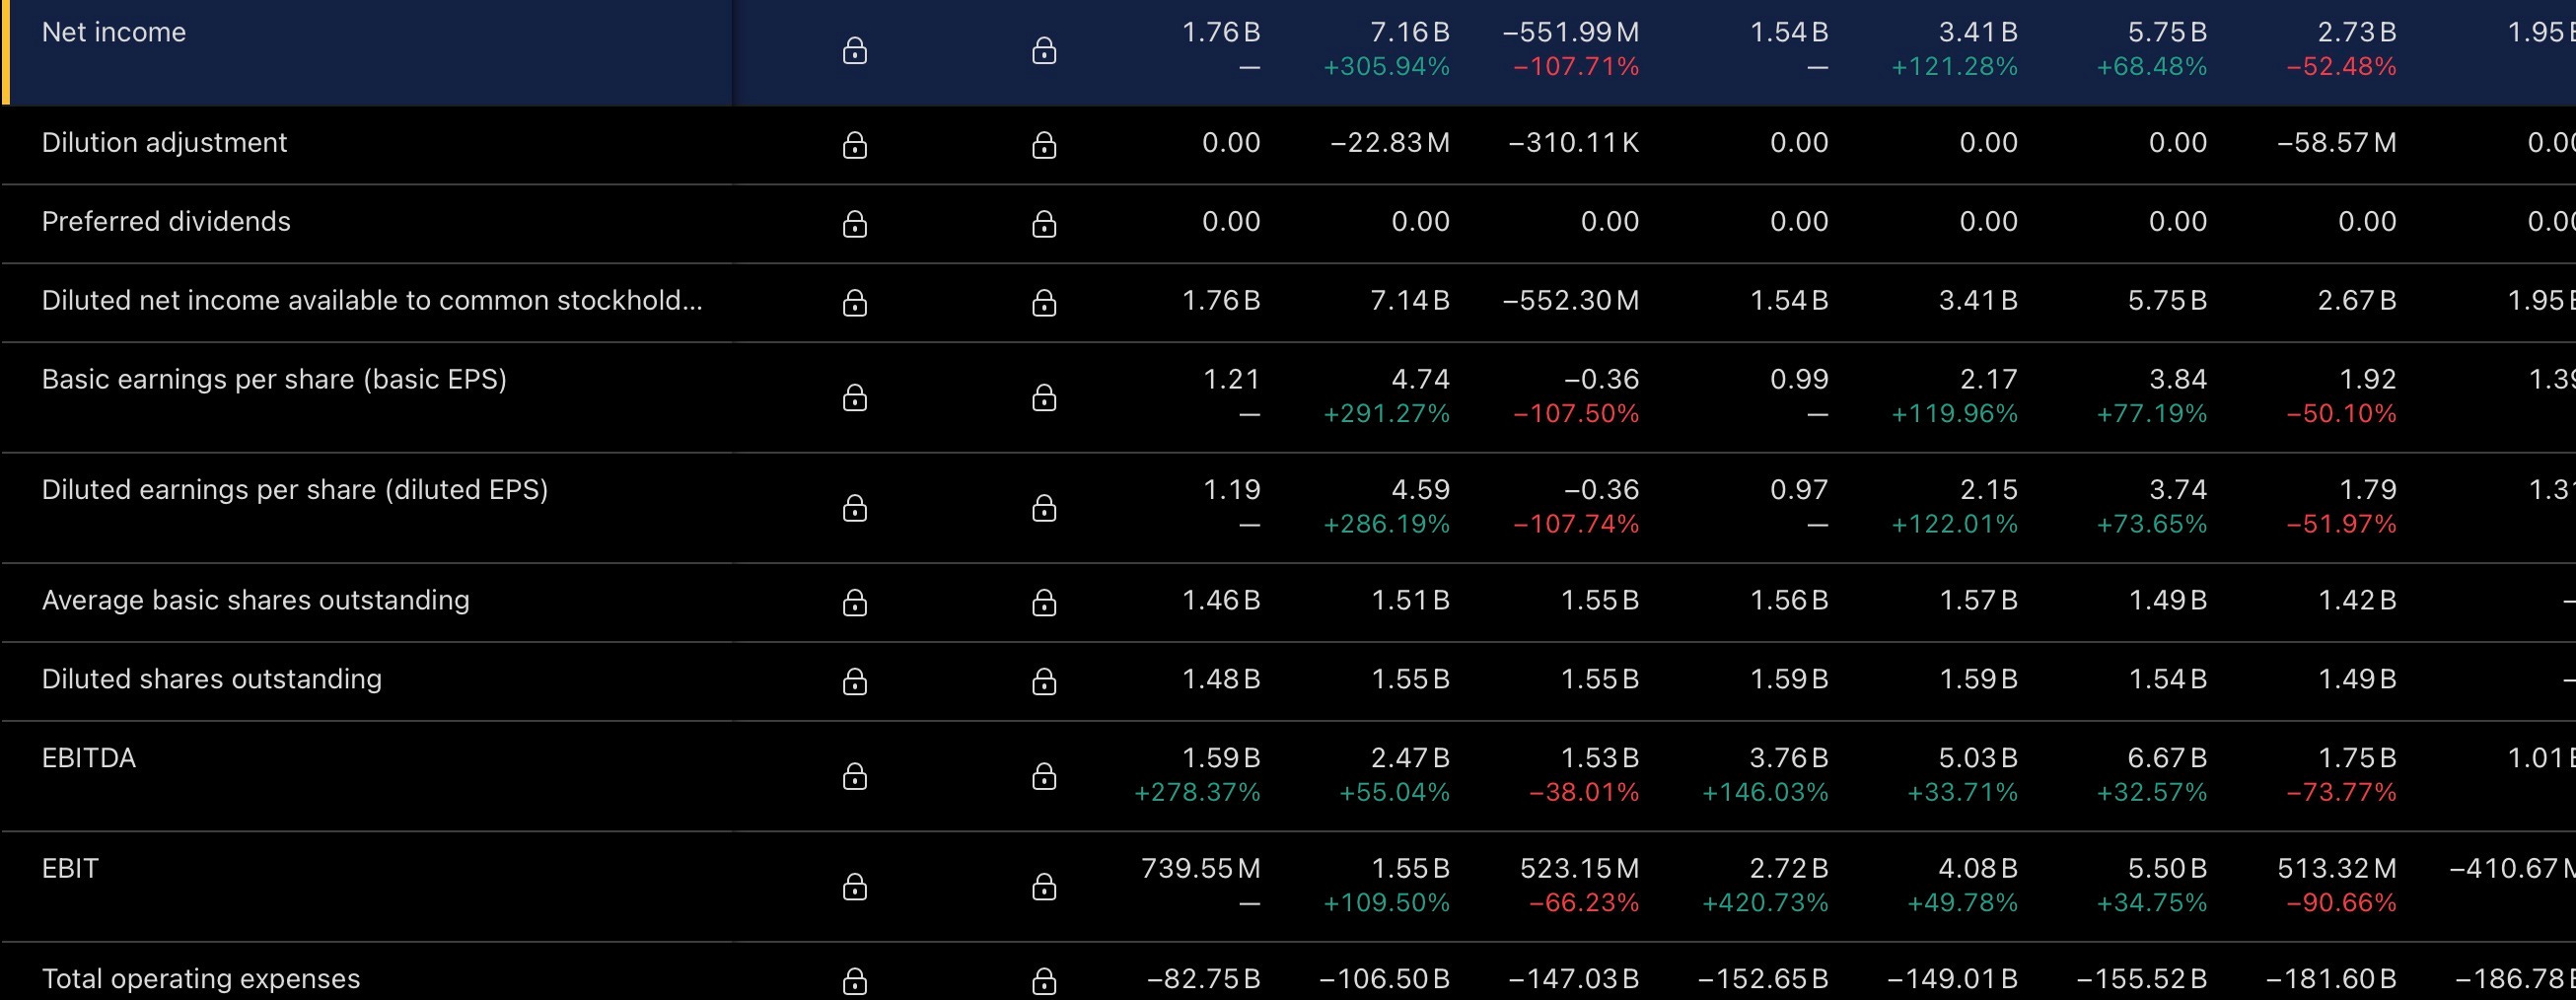
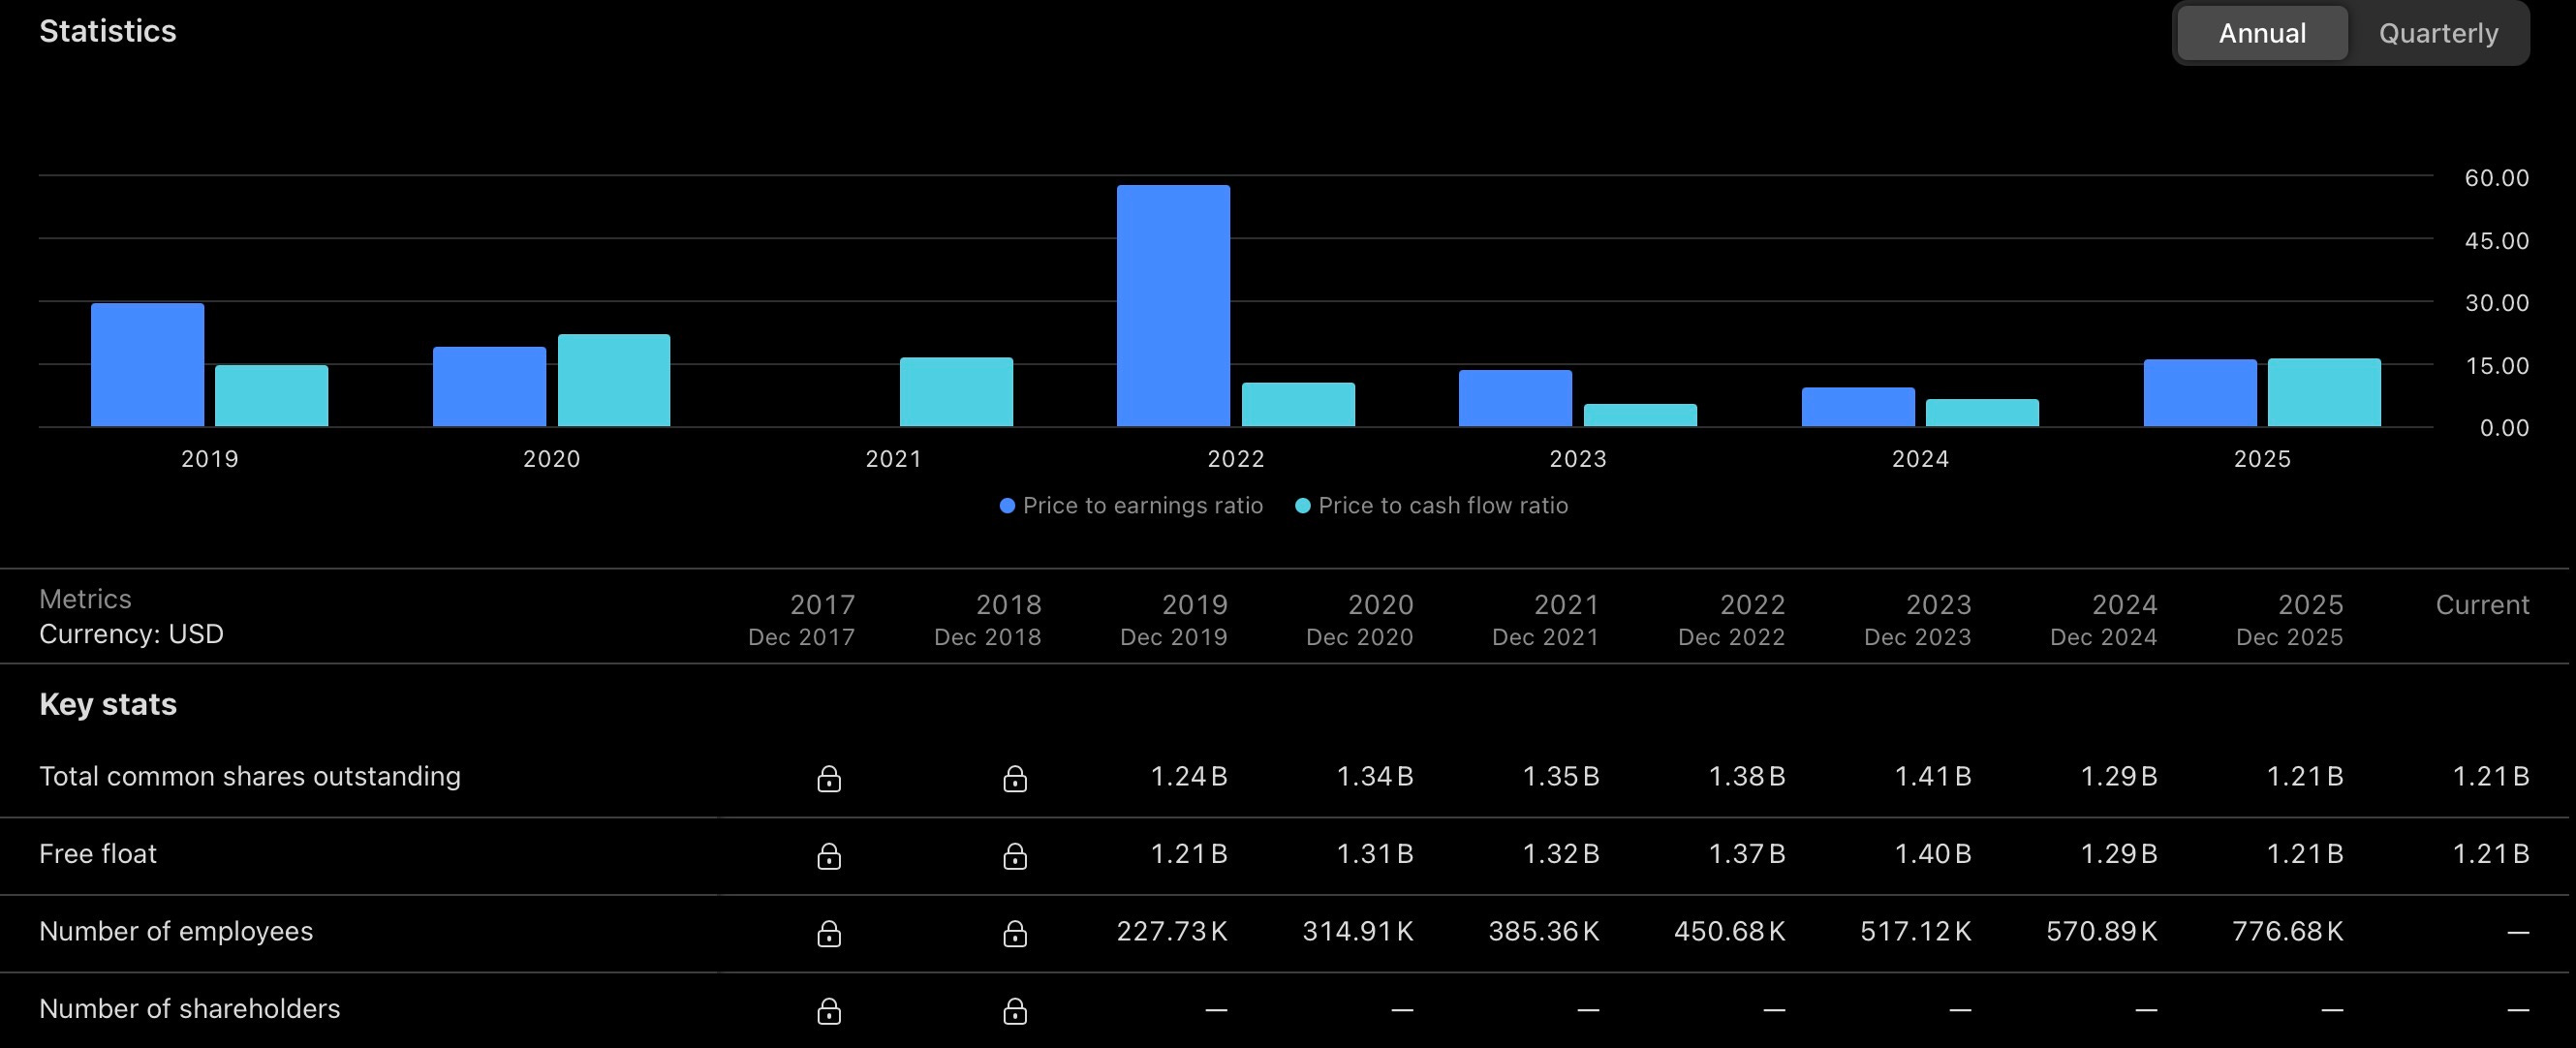
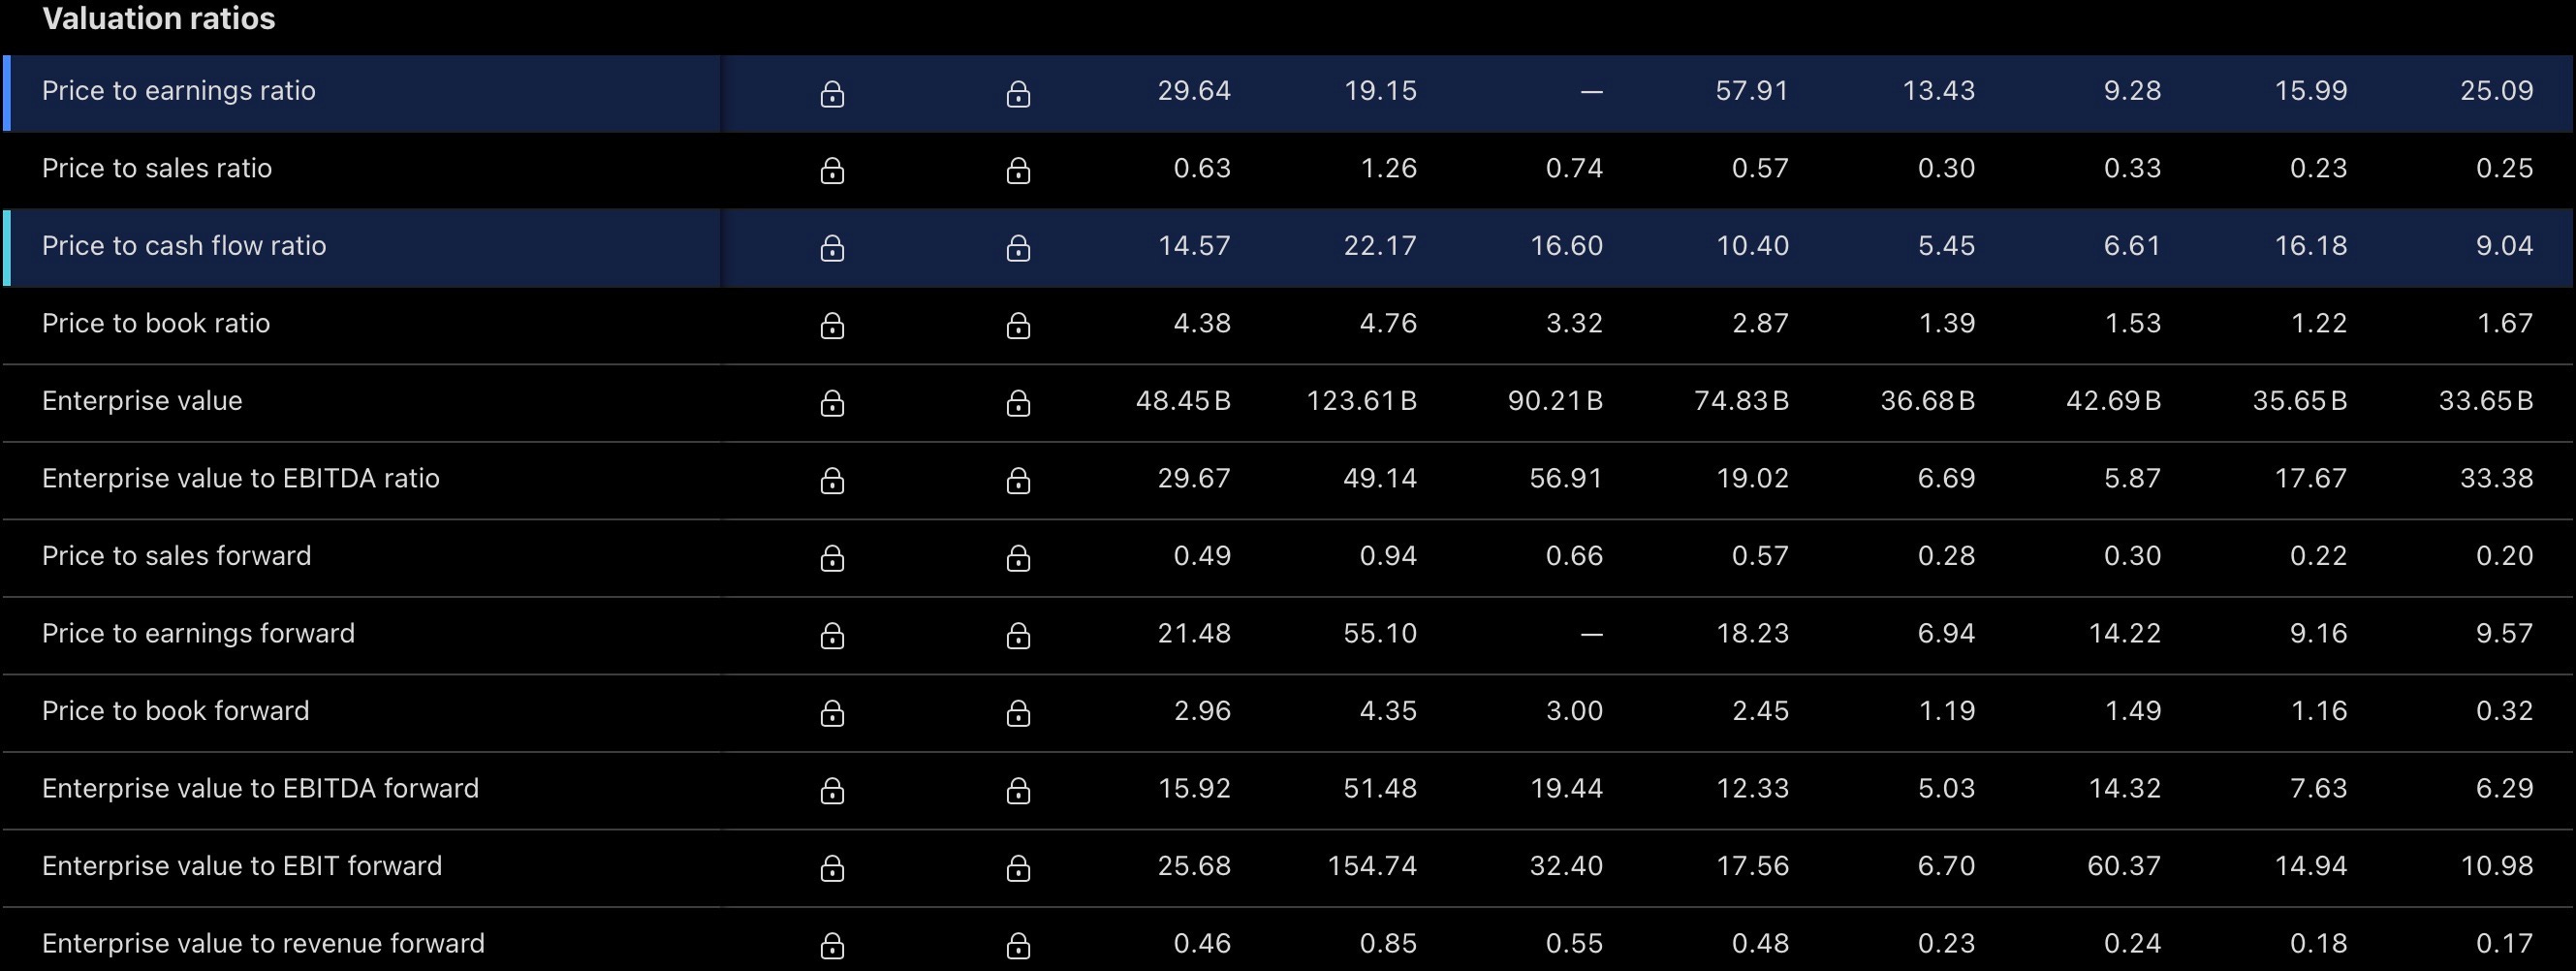
Trading near $33 as of early August 2026, JD carries a market capitalization of roughly $44.6 billion against an enterprise value of only about $23.5 billion. That roughly $21 billion gap is JD’s net cash position, and it colors every multiple that follows: this reads as one of the cheaper large-cap platforms in global e-commerce on a headline basis. The trailing P/E of roughly 25.0x looks unremarkable in isolation, but it reflects FY2025’s depressed earnings base, when net income attributable to shareholders nearly halved year-over-year as JD absorbed the brunt of its food-delivery investment. The forward P/E for FY2026, at roughly 9.4x against consensus EPS growth of +26.2%, is the more useful number, cheap in absolute terms and cheap relative to the growth being priced in, and it produces a PEG ratio of just 0.34, comfortably inside statistically inexpensive territory. Consensus detail beyond FY2026 sits behind a data paywall at this report’s primary source and could not be independently verified line by line; directionally, sell-side commentary following the Q1 2026 beat has trended toward raising FY2026–2028 estimates rather than cutting them, consistent with management’s own framing that the worst of the New Businesses drag is behind the company. A P/S ratio of roughly 0.23x and an EV/Sales ratio of roughly 0.12x are both strikingly low for a company still growing revenue at a high-single-digit clip, sitting at a steep discount to Western e-commerce peers such as Amazon, whose multiples run several turns higher, even allowing for the structurally thinner margins that come with a first-party retail model. P/B of roughly 1.7x is undemanding without being a screaming bargain on its own, and EV/EBITDA in the mid-4x area, cross-referenced across JD’s several listing venues, reads as inexpensive, again flattered by the size of the net cash sitting inside the enterprise value calculation.
PROFITABILITY AND CAPITAL RETURNS
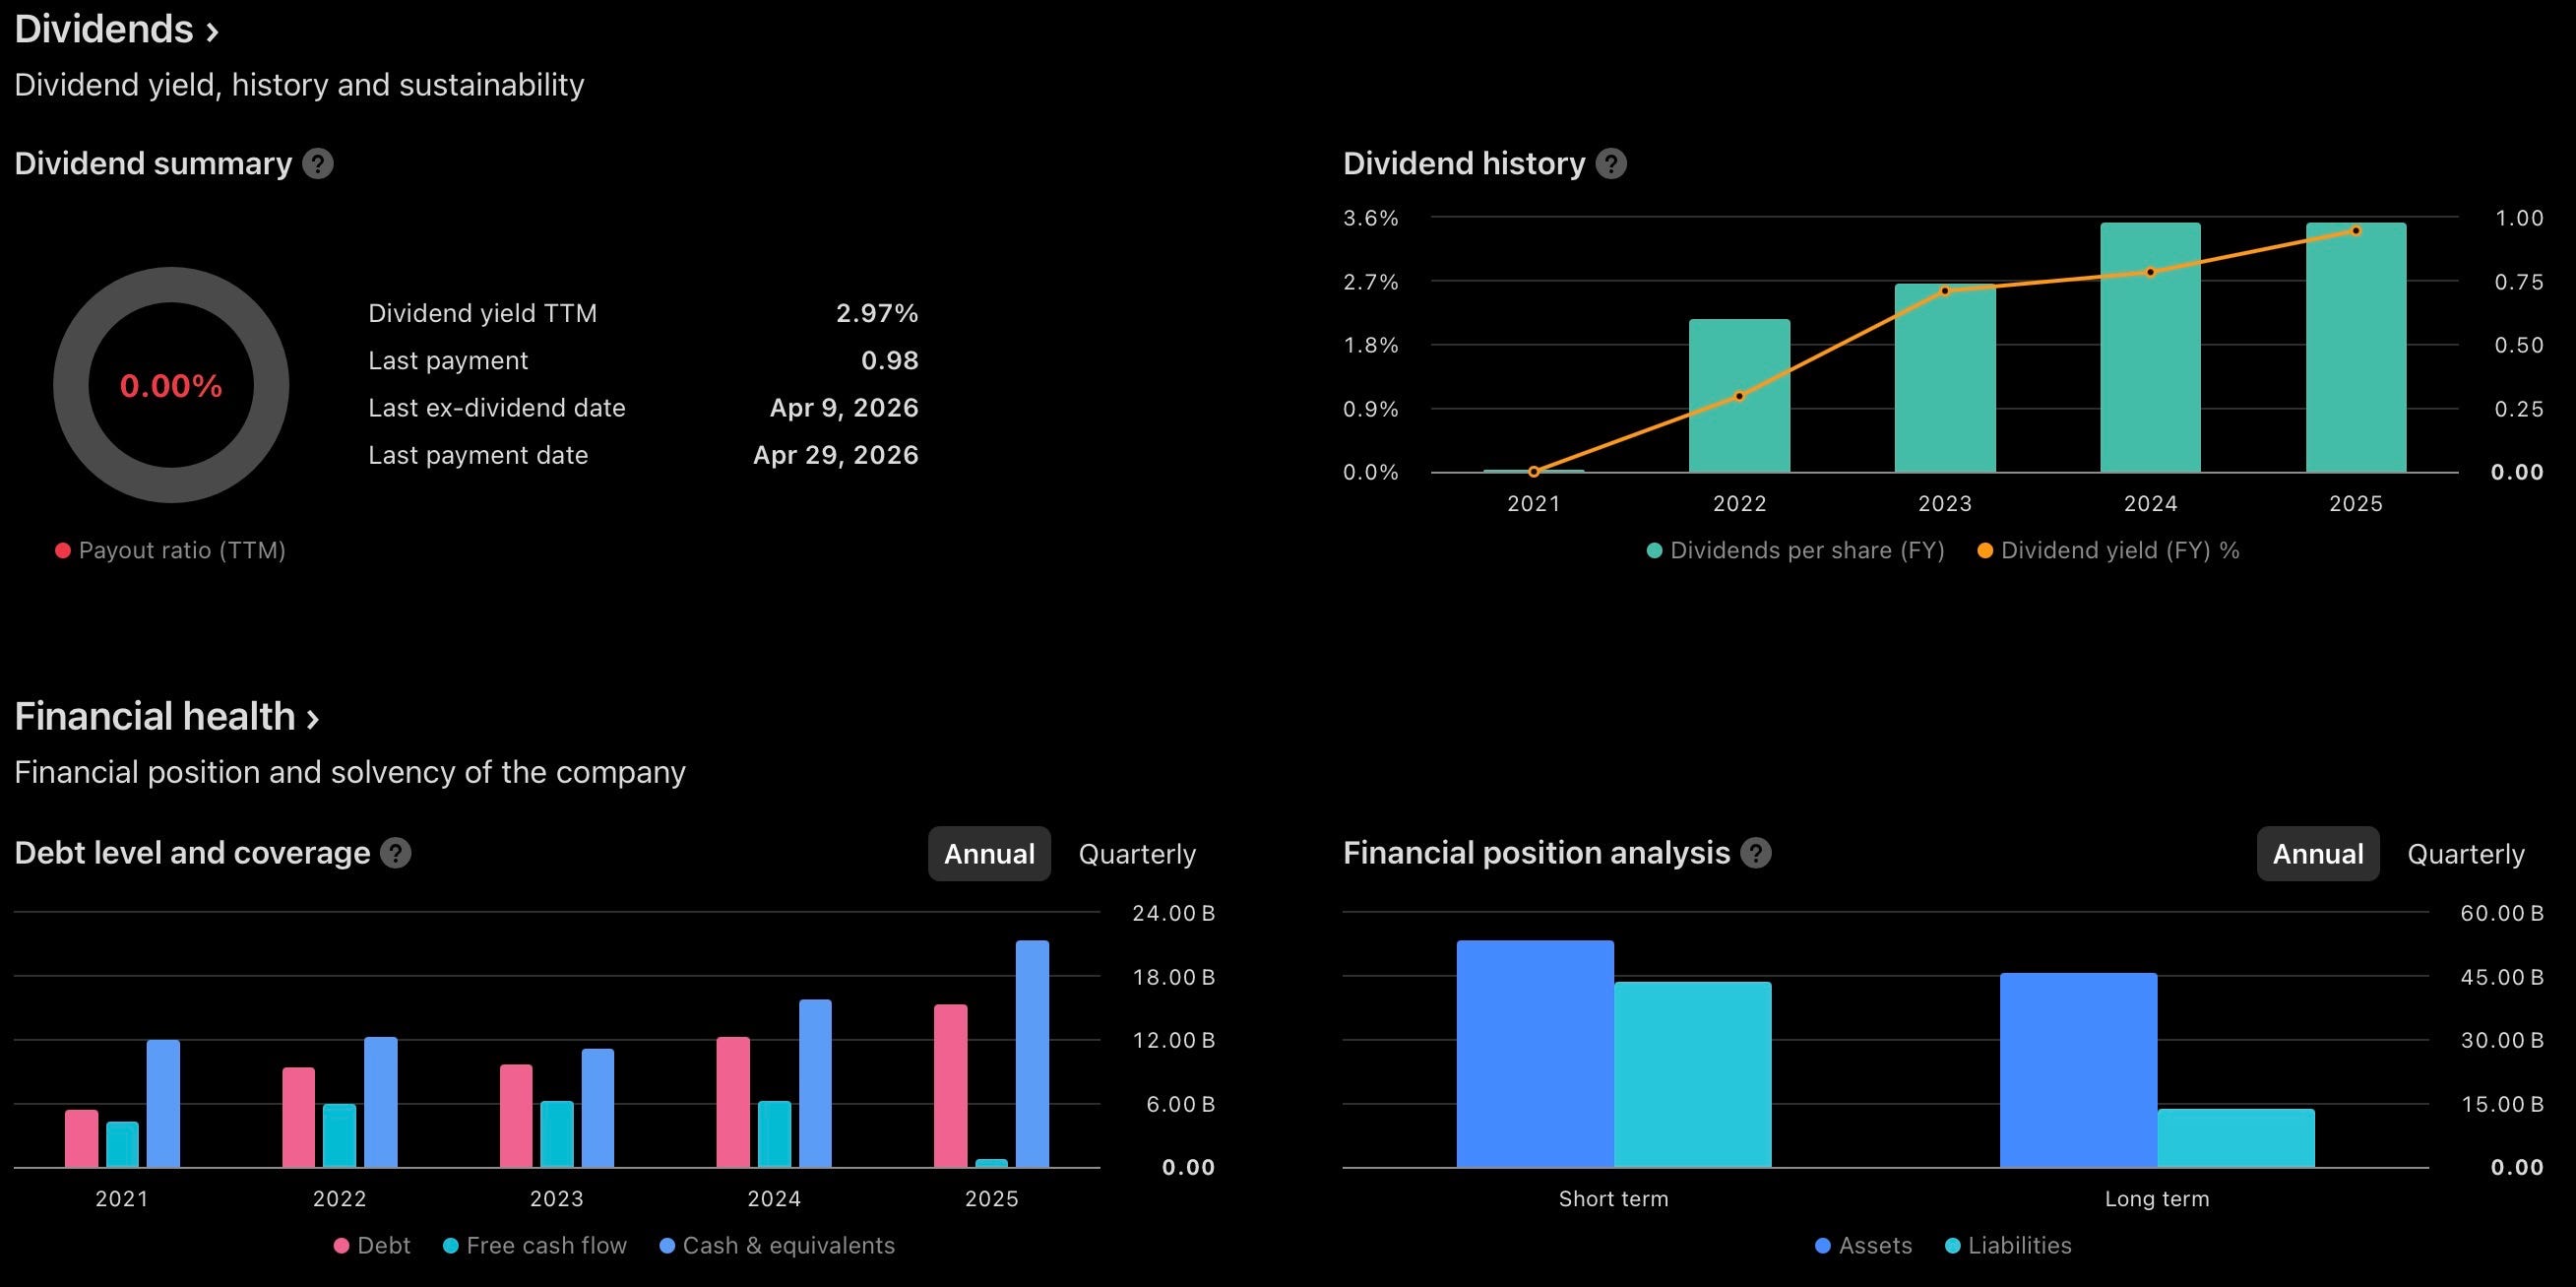
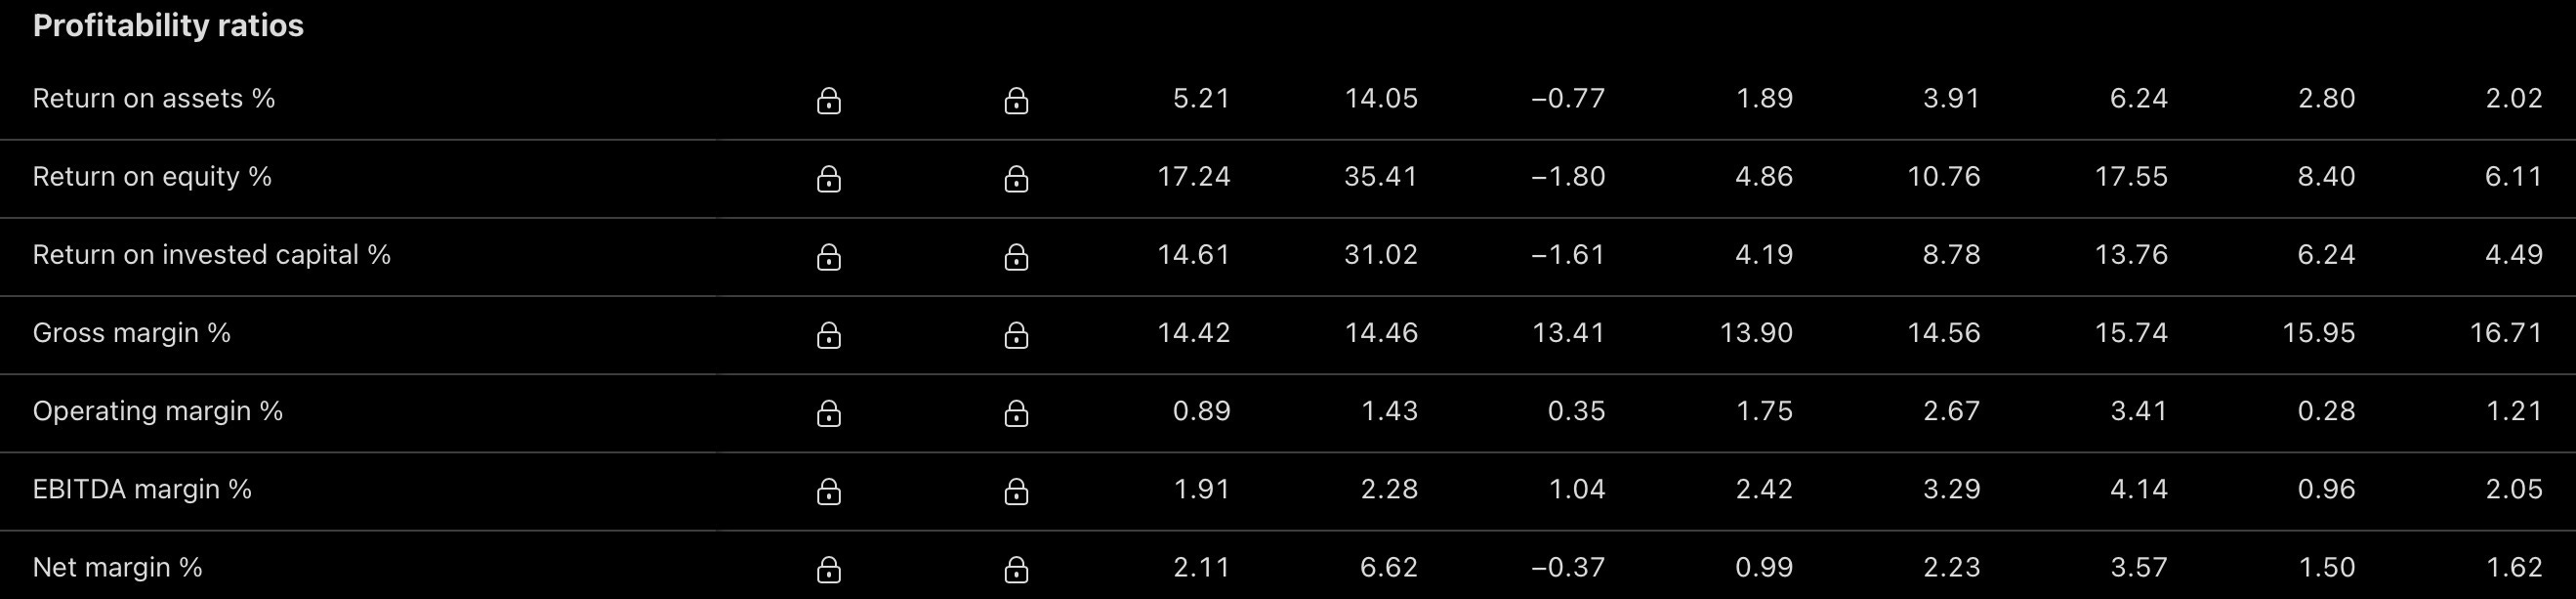
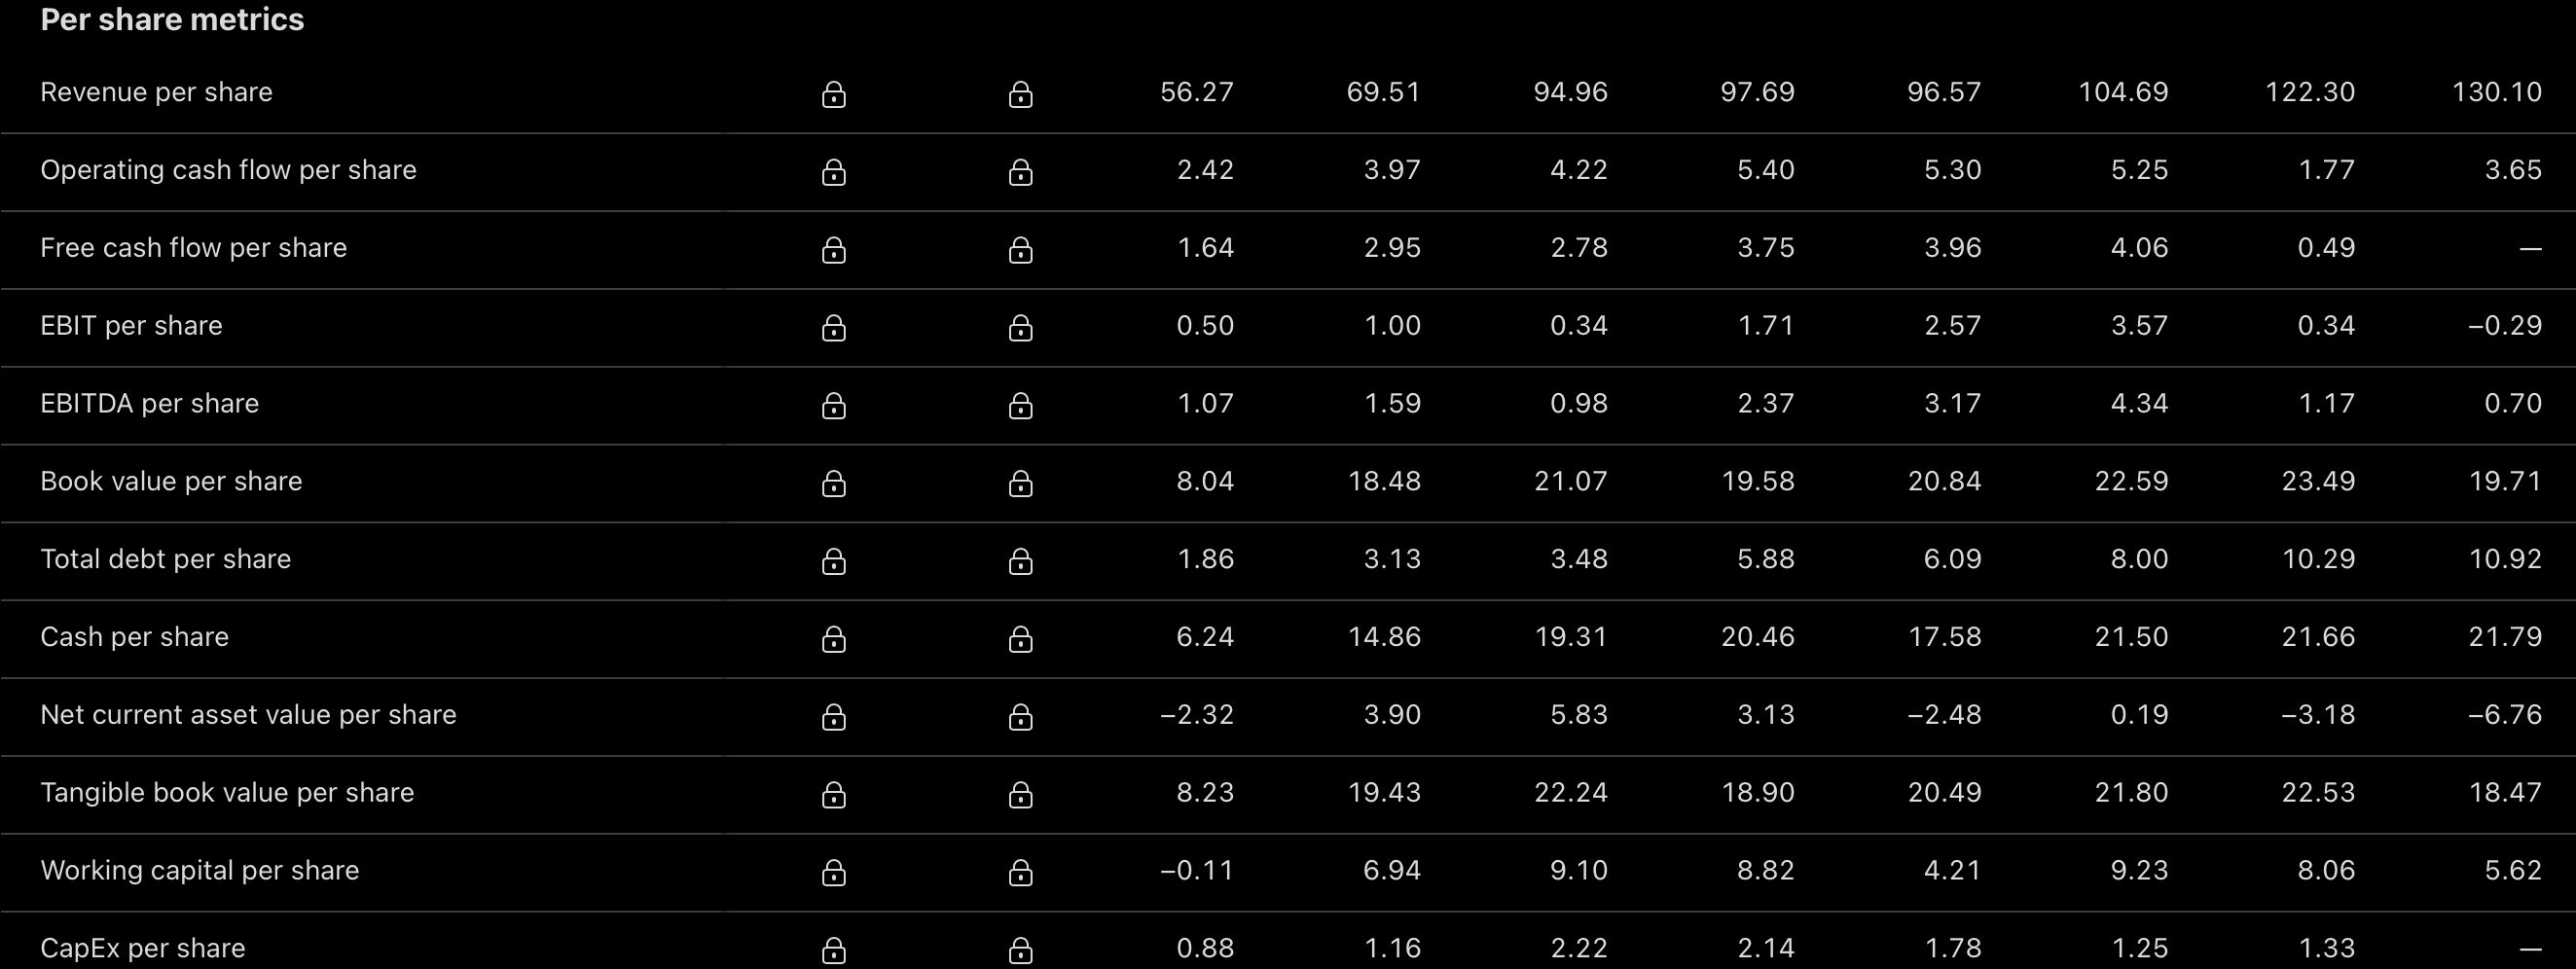
ROE of 6.0% and a trailing ROIC near breakeven, reported at -1.51%, look weak set against a cost of capital that third-party estimates place broadly in the 5%-9% range depending on the beta and risk-premium assumptions used, and on a strict trailing basis JD is arguably not clearing that hurdle right now. That said, this is a snapshot of an unusually depressed period rather than a steady-state read: ROE ran closer to the mid-teens in FY2024, before the food-delivery investment cycle compressed group profitability through FY2025 and into early FY2026. ROA sits at roughly 3.0%, modest but positive. Capital returns are the more straightforwardly attractive part of this picture: a $1.00 per ADS annual dividend, yielding roughly 3.0%, running alongside an active $5 billion buyback authorization through August 2027 (roughly $2 billion of remaining capacity at the end of 2025, plus a further $631 million repurchased in Q1 2026 alone), with share count already down close to 4% year-over-year. Management has explicitly reaffirmed this dual commitment to shareholder returns even while reinvesting heavily in New Businesses.
MARGINS
Group-level margins look thin and, on a trailing basis, clearly compressed: gross margin near 9.3% on a fulfillment-inclusive basis, and an operating margin hovering close to breakeven, both down sharply from FY2024, when operating margin ran closer to 3.3%. Net margin has followed the same arc, from north of 3.5% in FY2024 to roughly 1.5% in FY2025. The more important read sits one level down, however: JD Retail, the core segment, has expanded its operating margin for six consecutive fiscal years, closing FY2025 at 4.6% and pushing to a record 5.6% in Q1 2026, even as the group-level number was dragged toward zero by New Businesses losses. That divergence, a structurally improving core retail engine funding a deliberately loss-making expansion into food delivery and international markets, is the single most important nuance in JD’s current margin profile, and the sequential narrowing of New Businesses losses each of the last two quarters is the trend worth tracking against FY2026 guidance.
BALANCE SHEET AND LEVERAGE
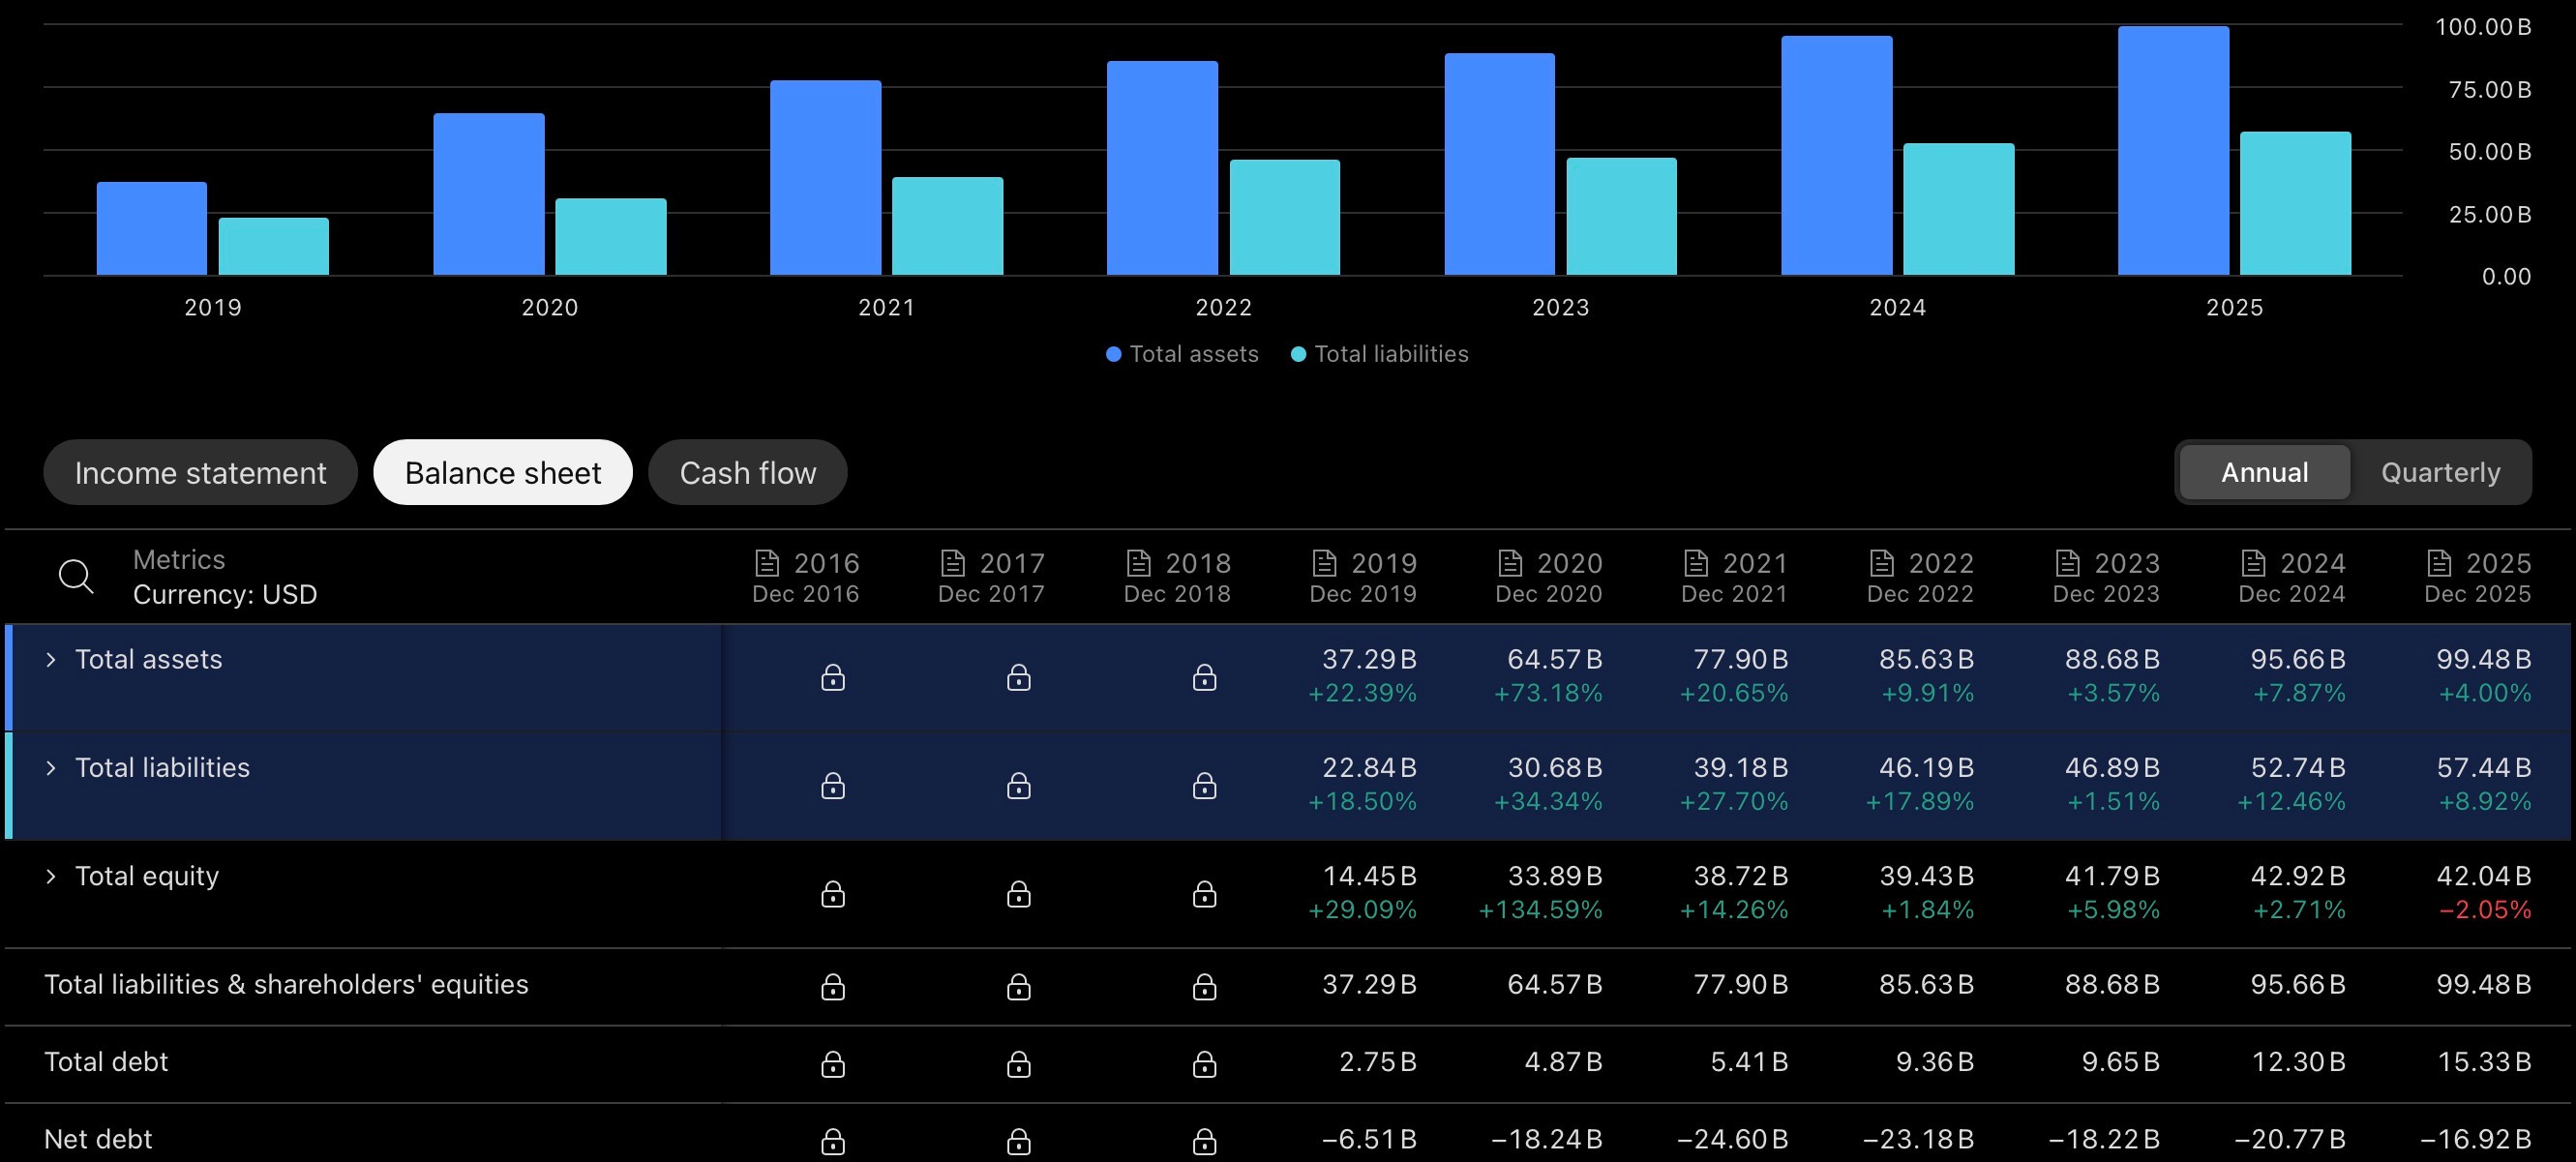
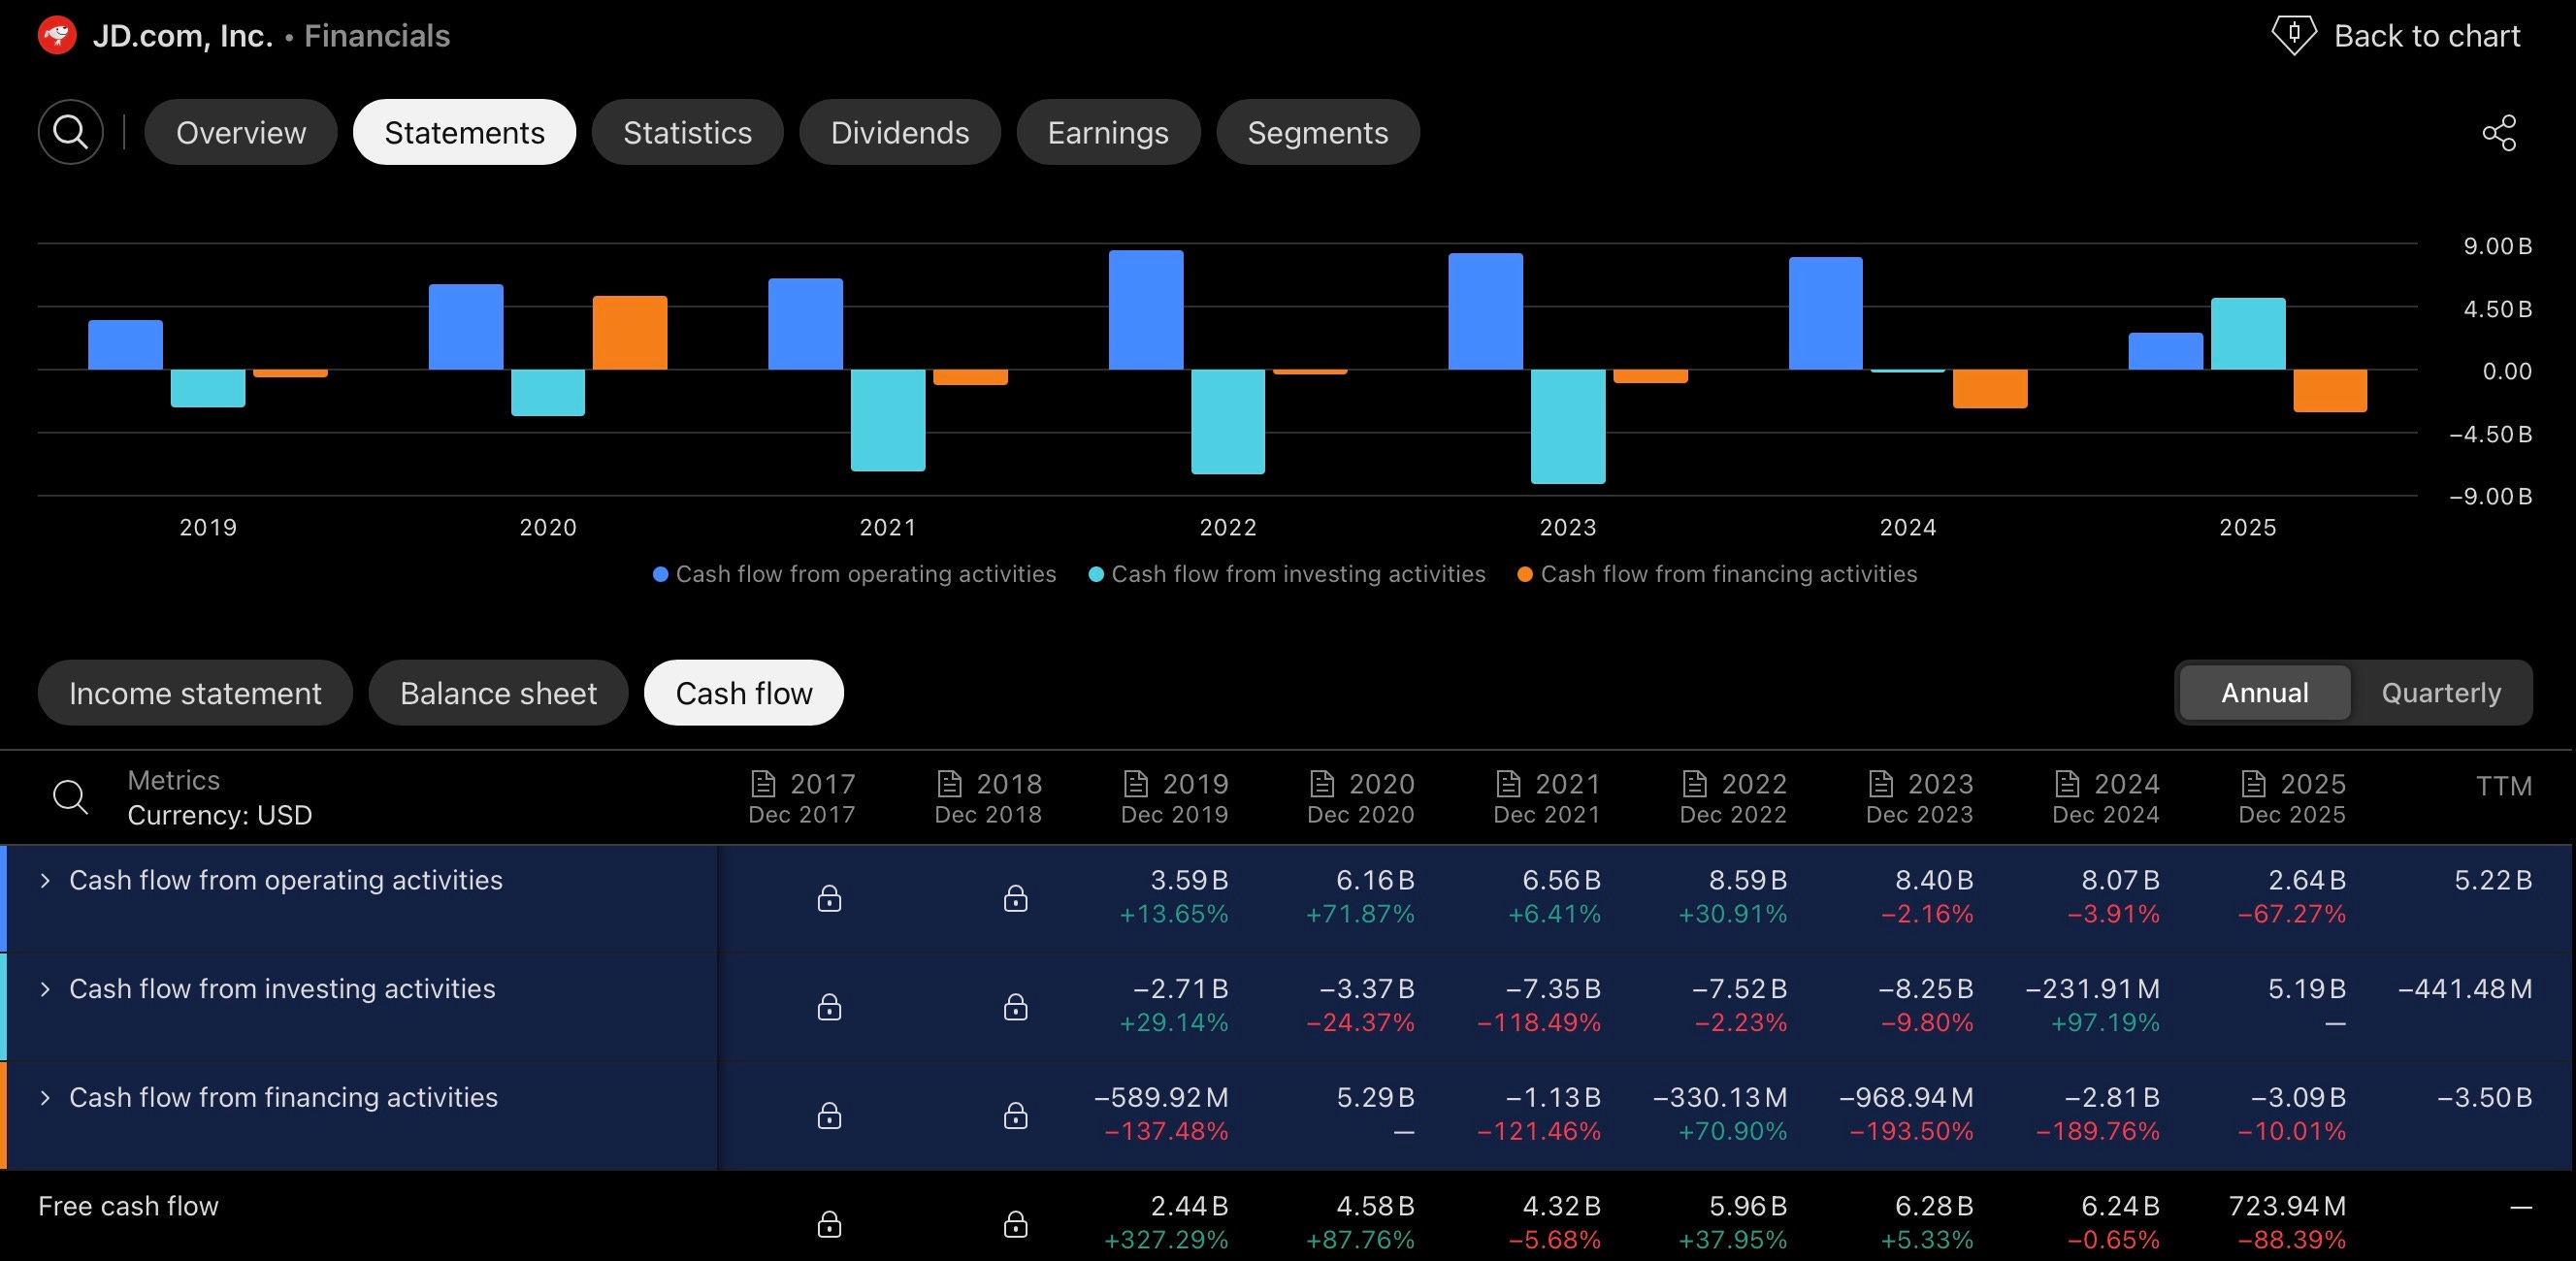
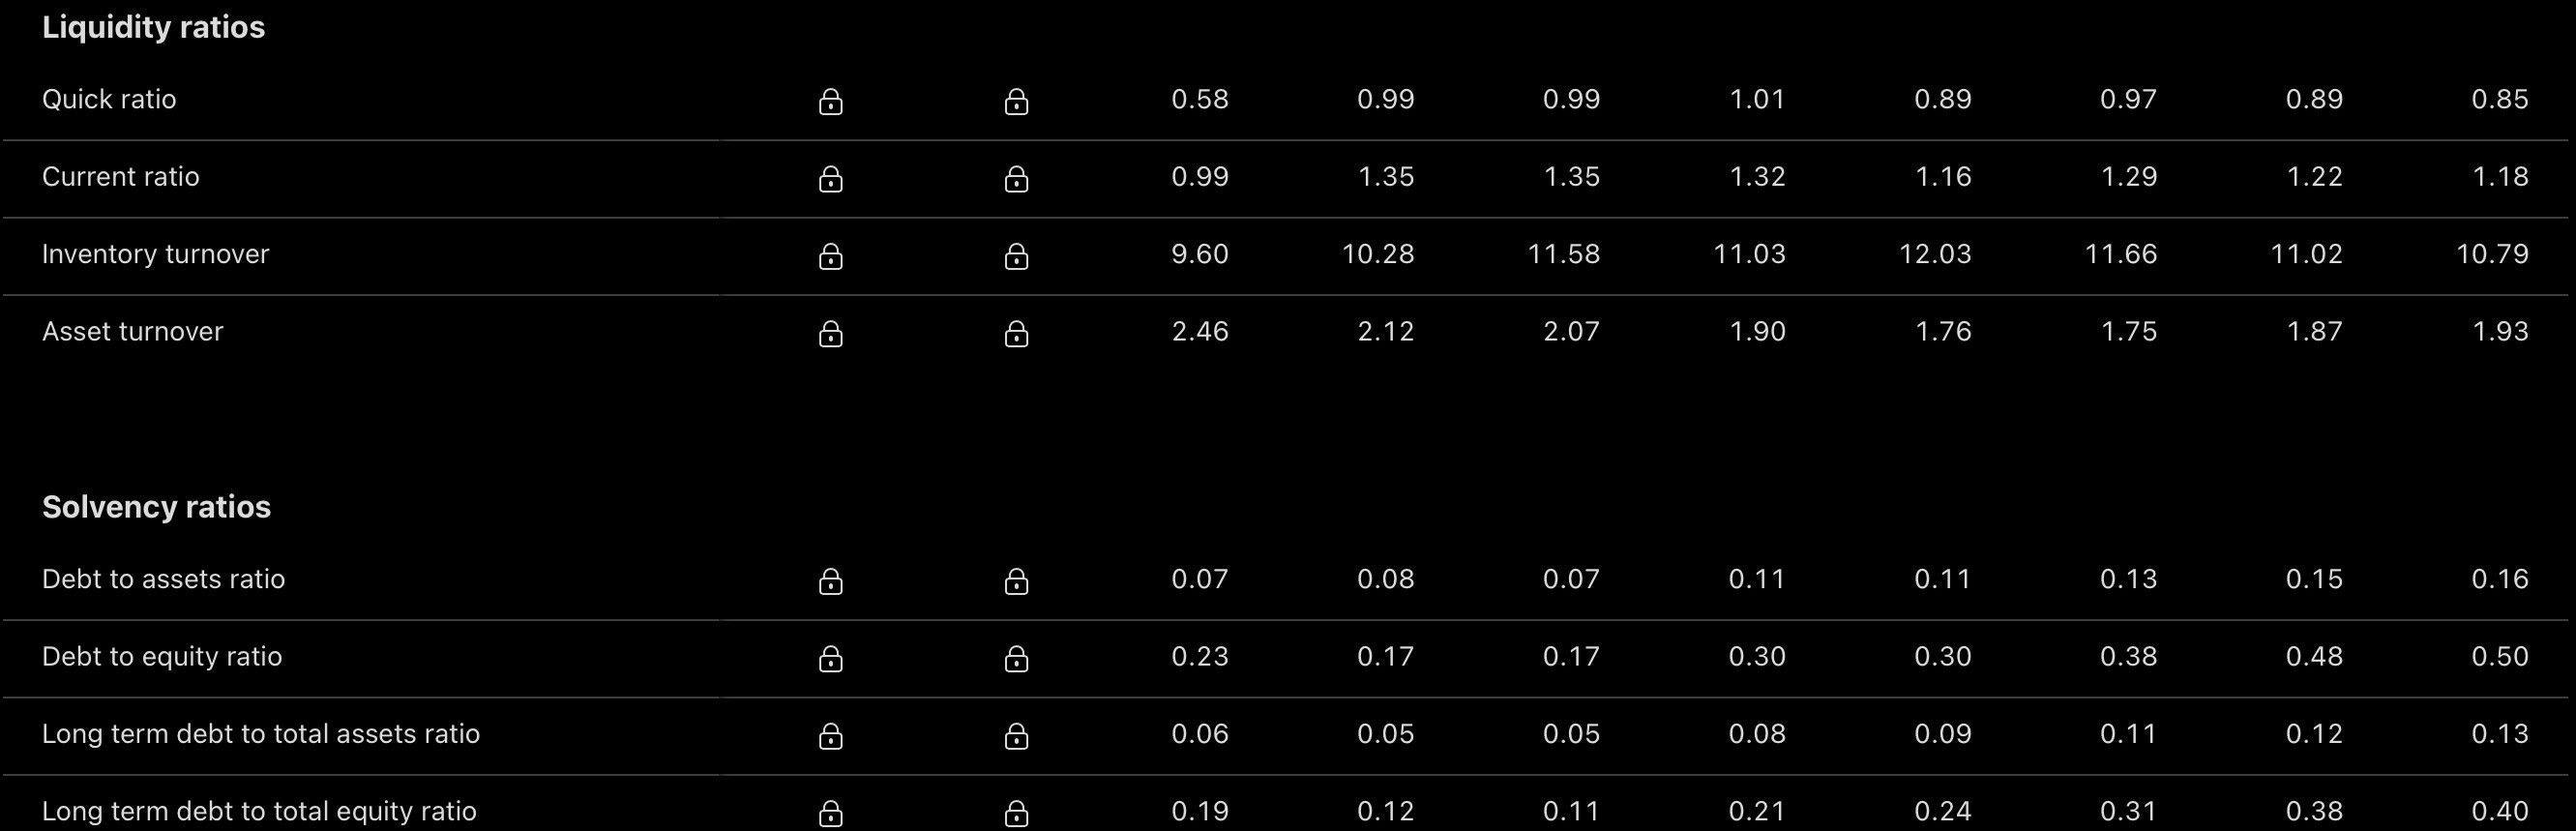
The balance sheet is a clear source of strength. Debt/Equity of roughly 0.38 and a current ratio of roughly 1.18 both sit comfortably within healthy territory and raise no liquidity flag. The more telling figure is the roughly $21 billion of net cash embedded in the gap between JD’s market cap and enterprise value, a buffer large enough to fund the food-delivery investment cycle, the pending Ceconomy acquisition, and the ongoing buyback and dividend program simultaneously without meaningful balance-sheet strain. Interest coverage on a strict GAAP operating-income basis compressed to roughly 1x in FY2025, a figure that would be alarming for a company without JD’s cash position, but is really an artifact of operating income being pushed toward zero by the same investment cycle discussed above; on FY2026 consensus operating income guidance, coverage should recover toward the mid-single digits.
FORWARD ESTIMATES
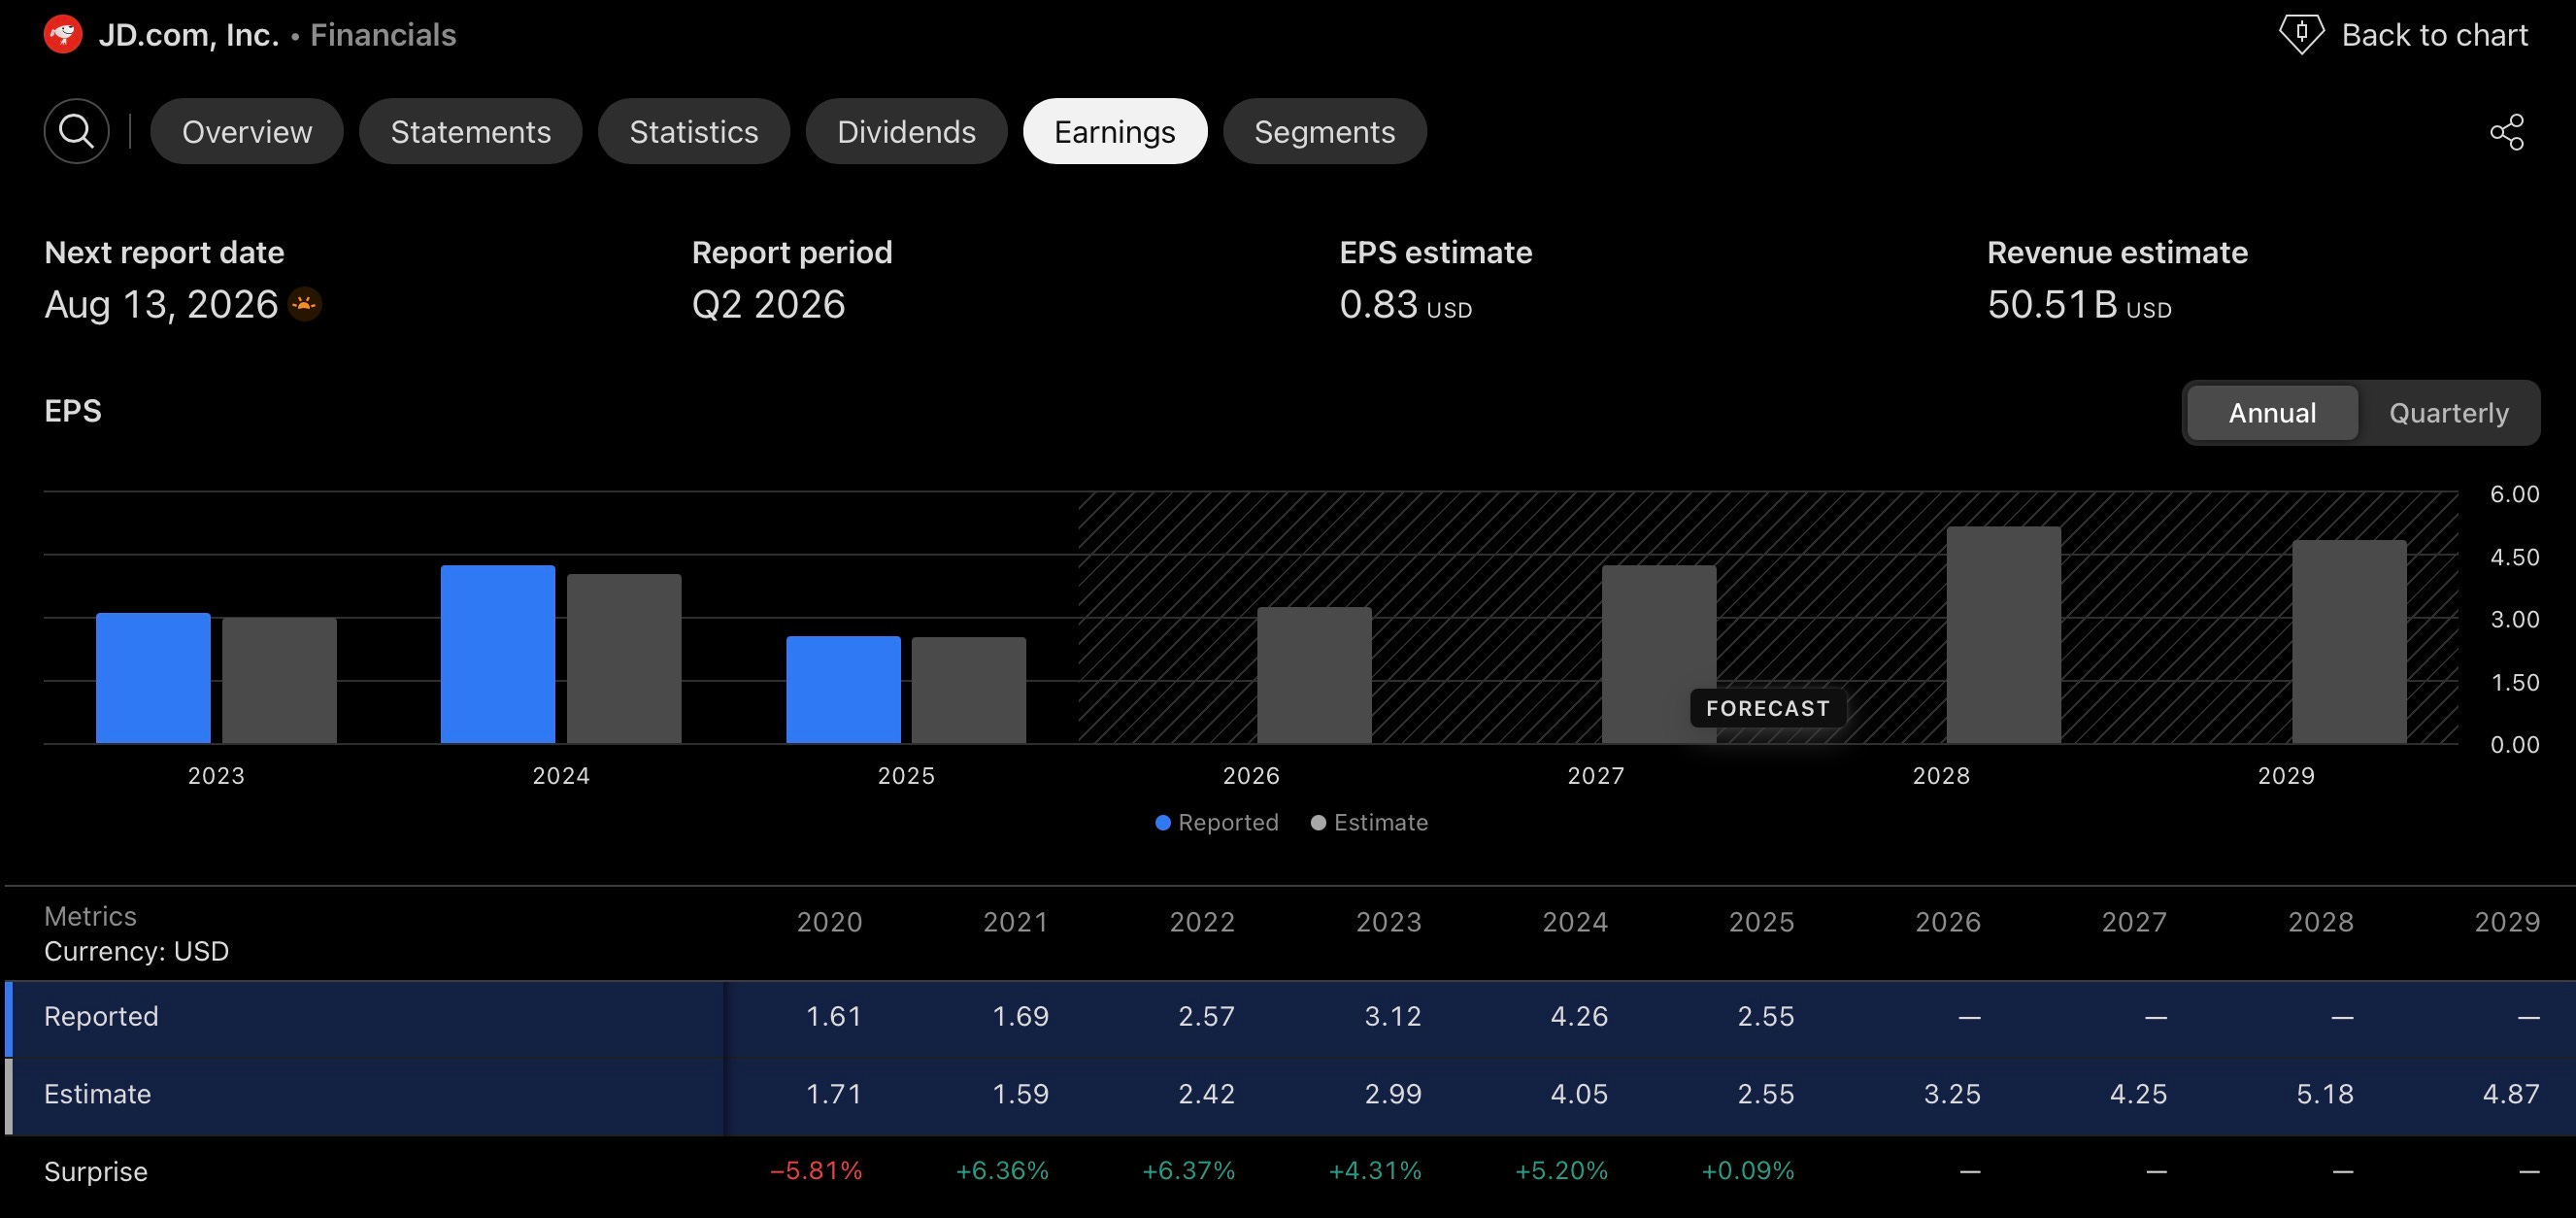
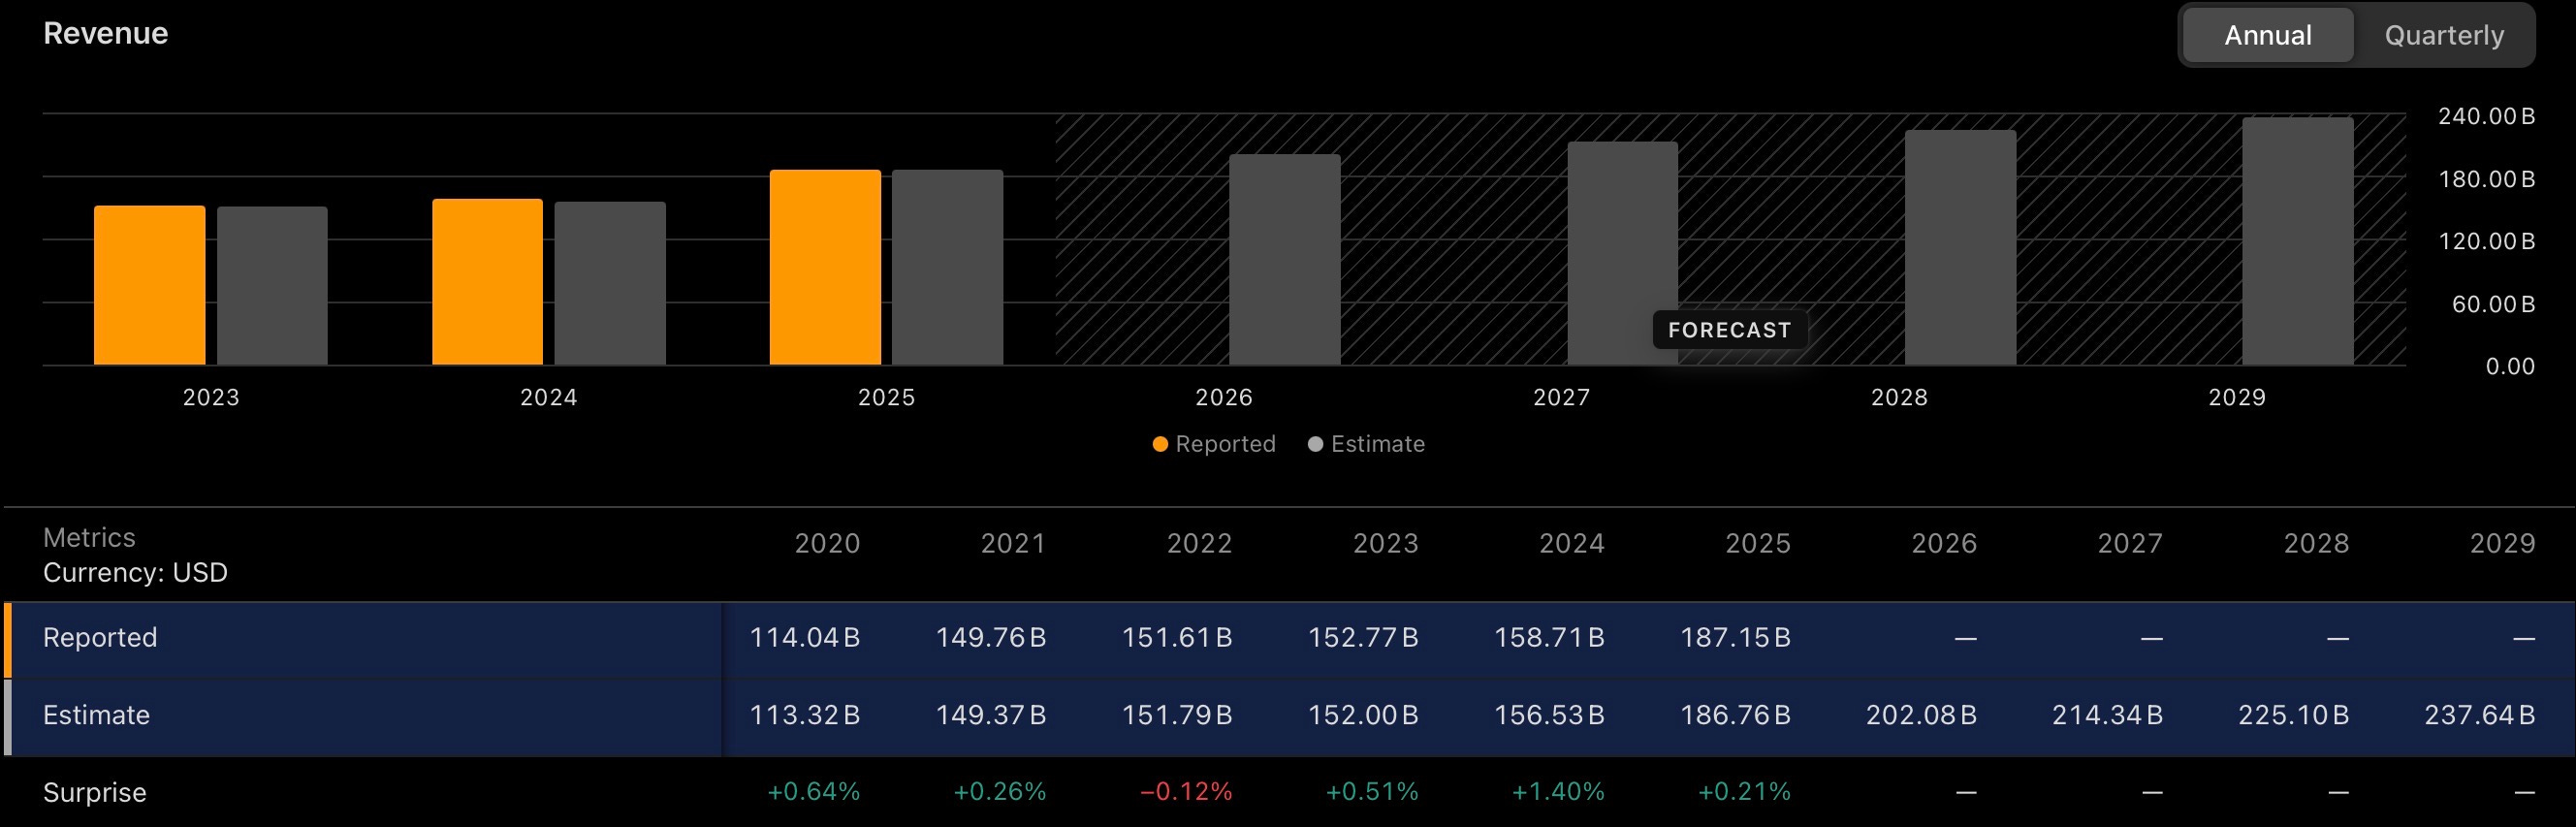
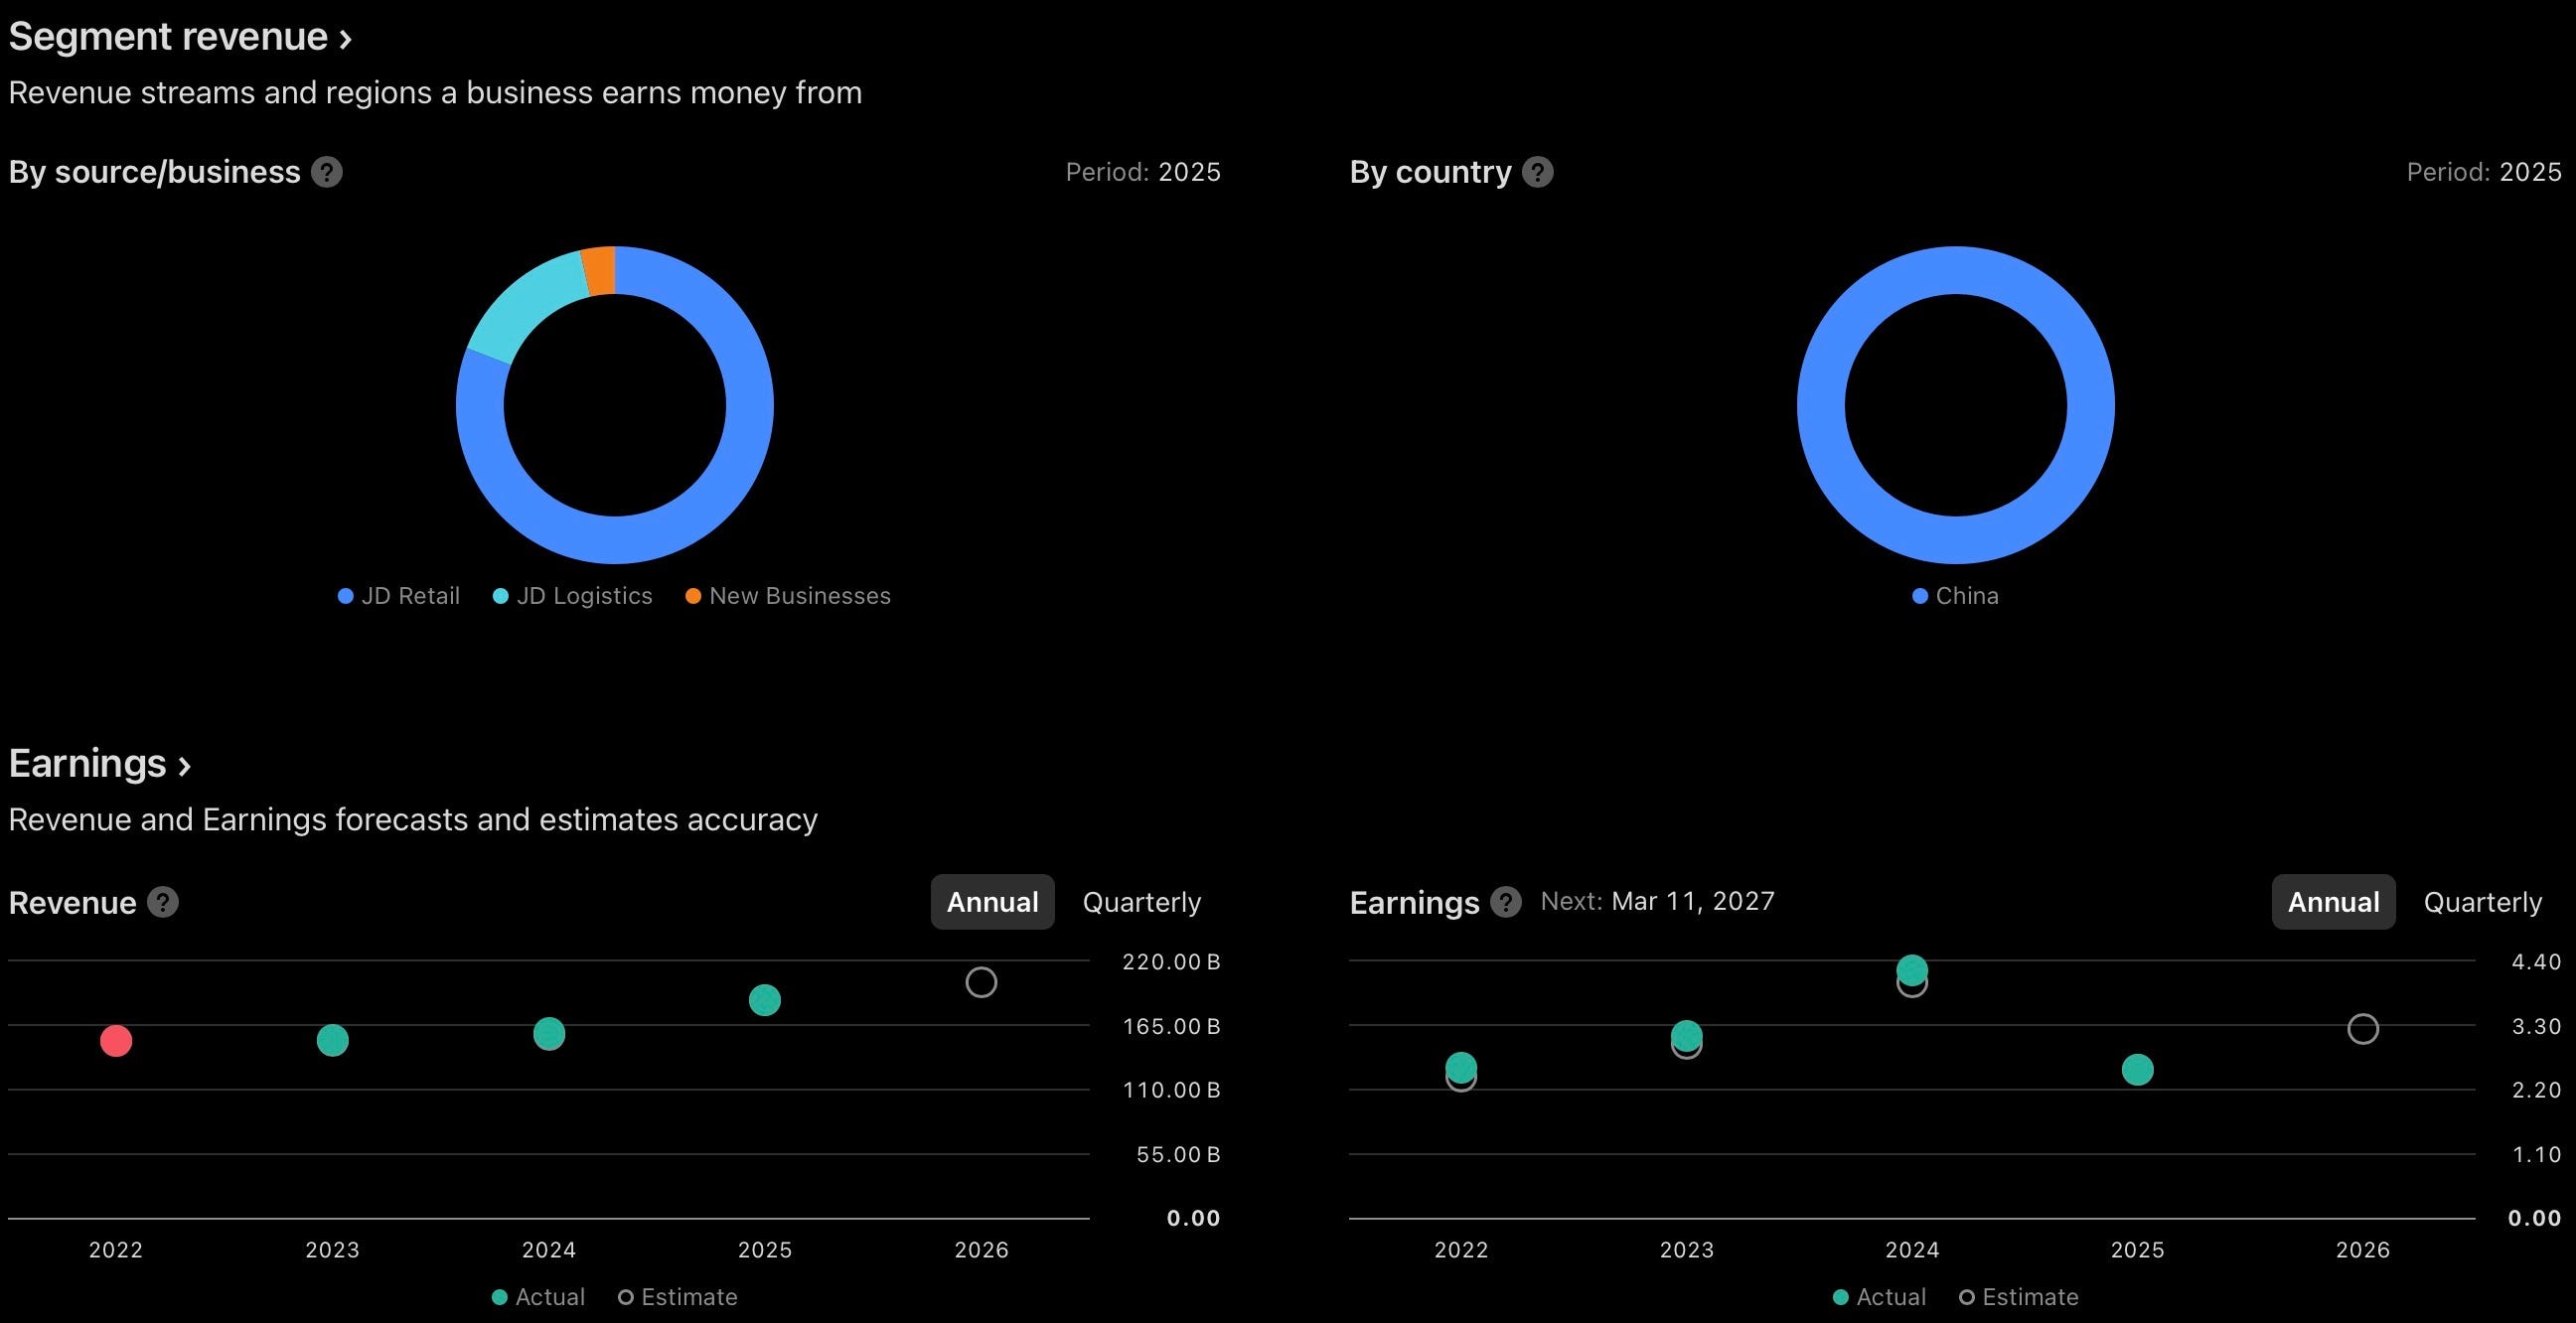
Consensus has JD.com growing FY2026 revenue to roughly RMB 1.37 trillion, up 4.5% year-over-year, and FY2026 non-GAAP EPS to roughly RMB 12.73, up 26.2% off FY2025’s depressed base, together implying the roughly 9.4x forward P/E and 0.34 PEG already noted above. Reliable fiscal-year-by-fiscal-year detail for FY2027 and FY2028 was not available from this report’s primary free-tier data source; qualitatively, sell-side revisions since the Q1 2026 print have skewed toward upgrades across that window rather than downgrades. Whether JD’s roughly 9x forward multiple re-rates toward its own historical range, or toward the higher multiples parts of the Hang Seng Tech complex have periodically commanded during 2026’s AI-driven rally, likely hinges more on execution in food delivery and the Ceconomy integration than on the headline growth number itself.
FUNDAMENTAL CONTEXT FOR THE TECHNICAL READ
On balance, the fundamental backdrop leans supportive of the primary Elliott Wave count rather than neutral to it. A valuation this depressed, sub-10x forward earnings, sub-0.25x sales, a PEG near a third, alongside a margin trough that already looks to be behind the company as of the Q1 2026 print, is broadly consistent with a Wave 2 correction reaching structural exhaustion in the current price zone rather than needing to travel meaningfully further. It does not validate any single Fibonacci boundary on its own, but the net cash position and active buyback program would tend to reinforce Alternative Scenarios 1 and 2 (both of which still treat Target Zone 1 as a valid entry, just under a shallower advance) more than Scenario 4’s bearish drift-to-zero read, which finds little support in either the balance sheet or the current earnings trajectory.
2 · CORRELATIONS
JD.com’s correlation structure runs through three layers: the broad risk-on/risk-off complex that governs all growth equities, the narrower China ADR and Hang Seng Tech cohort JD trades inside daily, and idiosyncratic drivers tied to its own food-delivery investment cycle and international expansion.
Global Risk Sentiment (Risk-On / Risk-Off)
JD carries a reported beta of just 0.34, which understates its behavior during acute risk-off episodes: Chinese equities as a group have historically sold off in sympathy with US tech and broader global risk appetite during tariff scares or Fed policy shifts, regardless of company-specific fundamentals.
Hang Seng Tech Index / Hang Seng Index
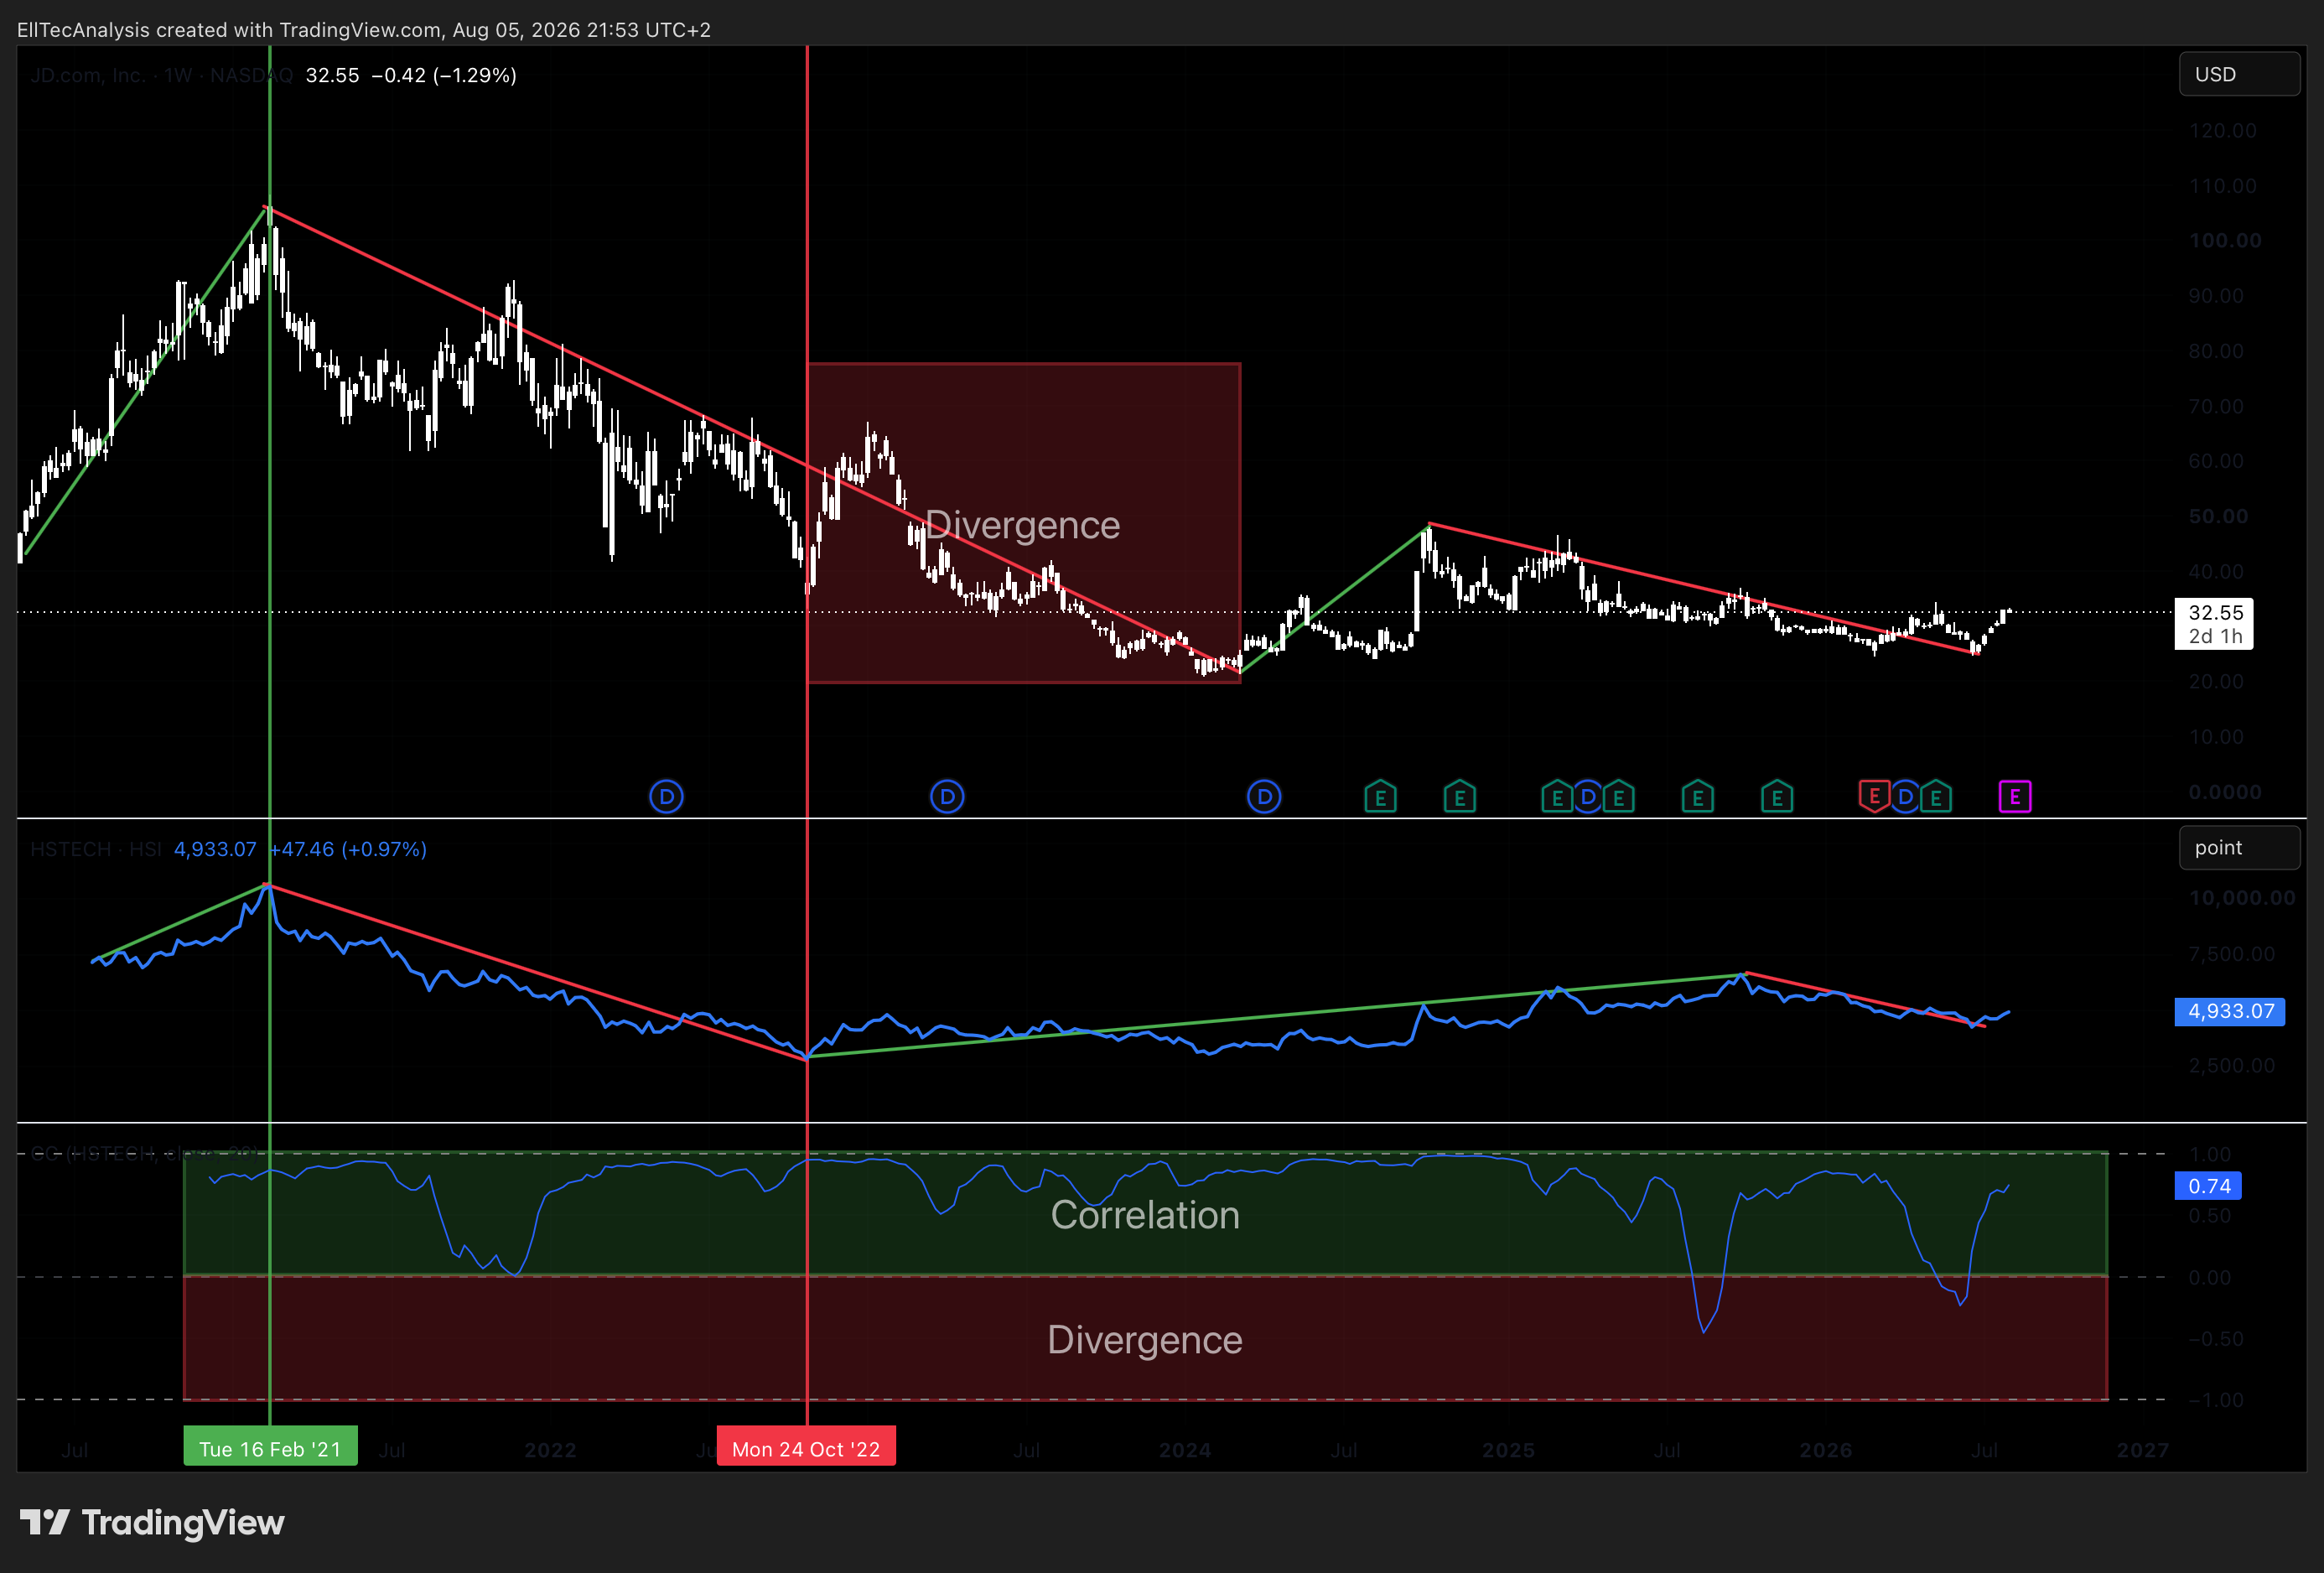
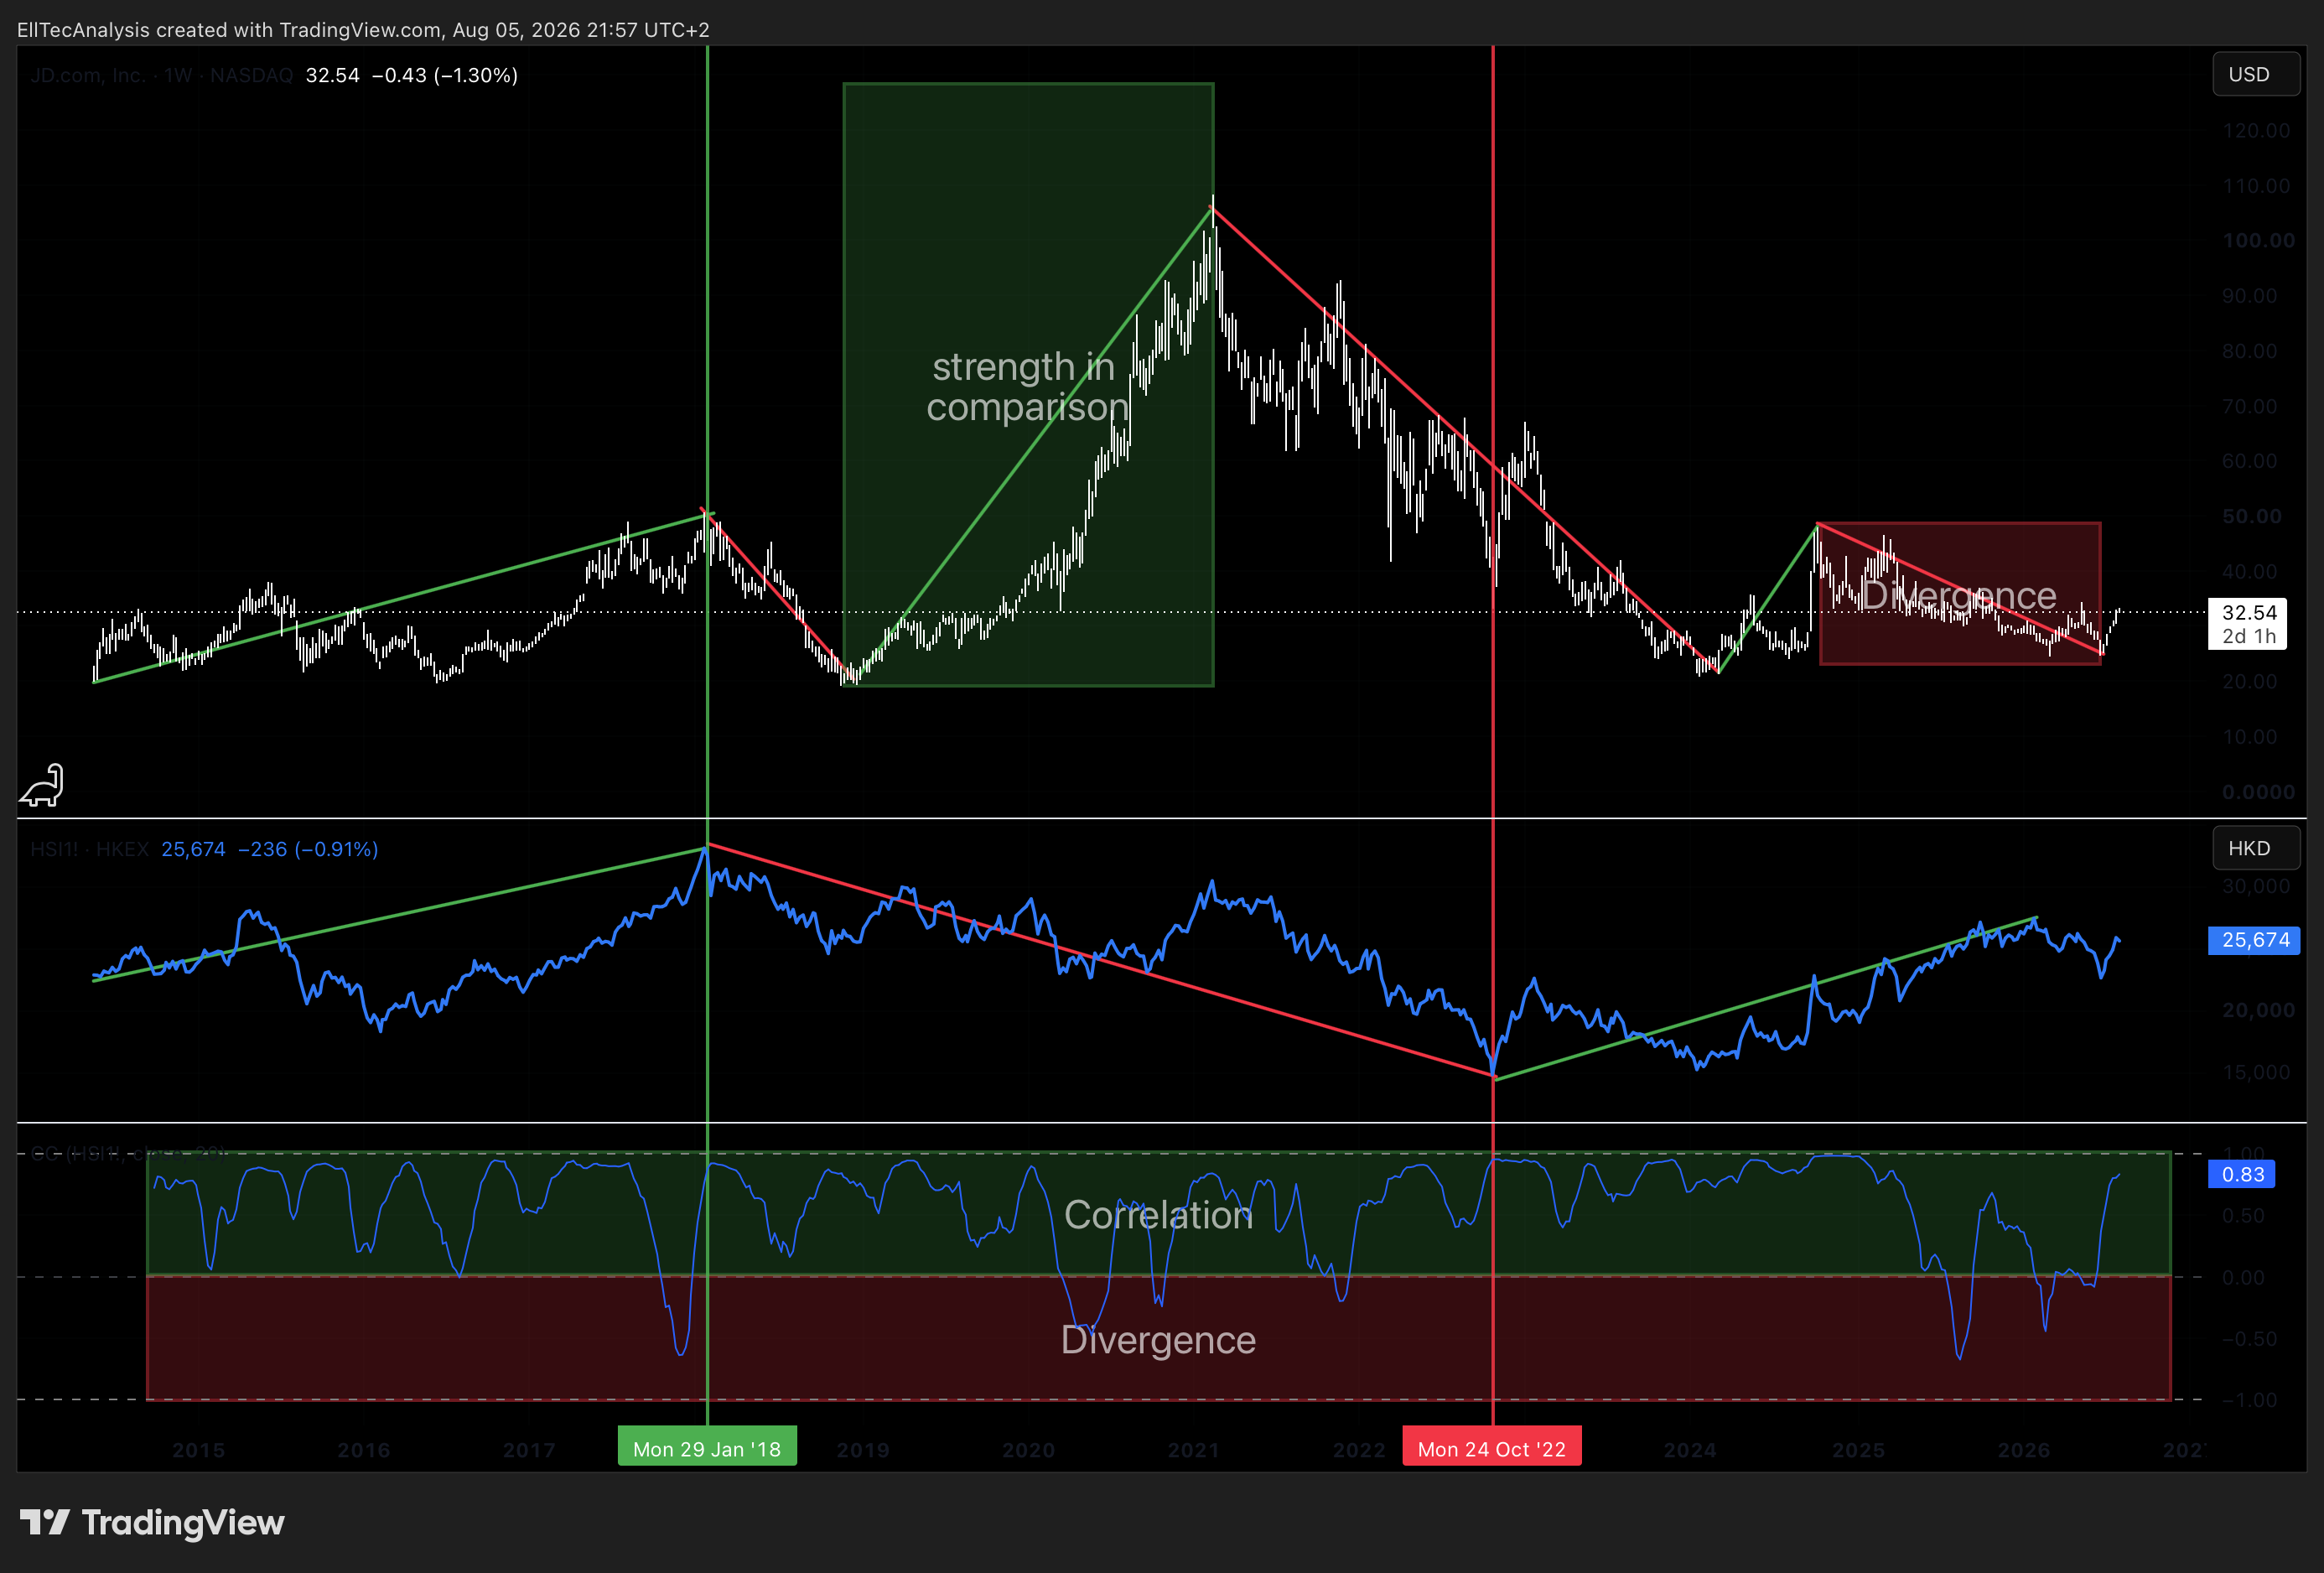
JD’s tightest correlation runs with its direct China internet peers, Alibaba, PDD Holdings, and Meituan, and with the Hang Seng Tech and Hang Seng Indices more broadly. Notably, 2026’s China tech rally has been led disproportionately by AI-capex beneficiaries and hardware names rather than internet and e-commerce constituents like JD, so JD’s correlation to the index has held even as its relative performance within it has periodically lagged the AI-driven leadership.
More about the Hang Seng Index:

More about a sector competitor, Alibaba:

US Dollar Index (DXY) / USD-CNY
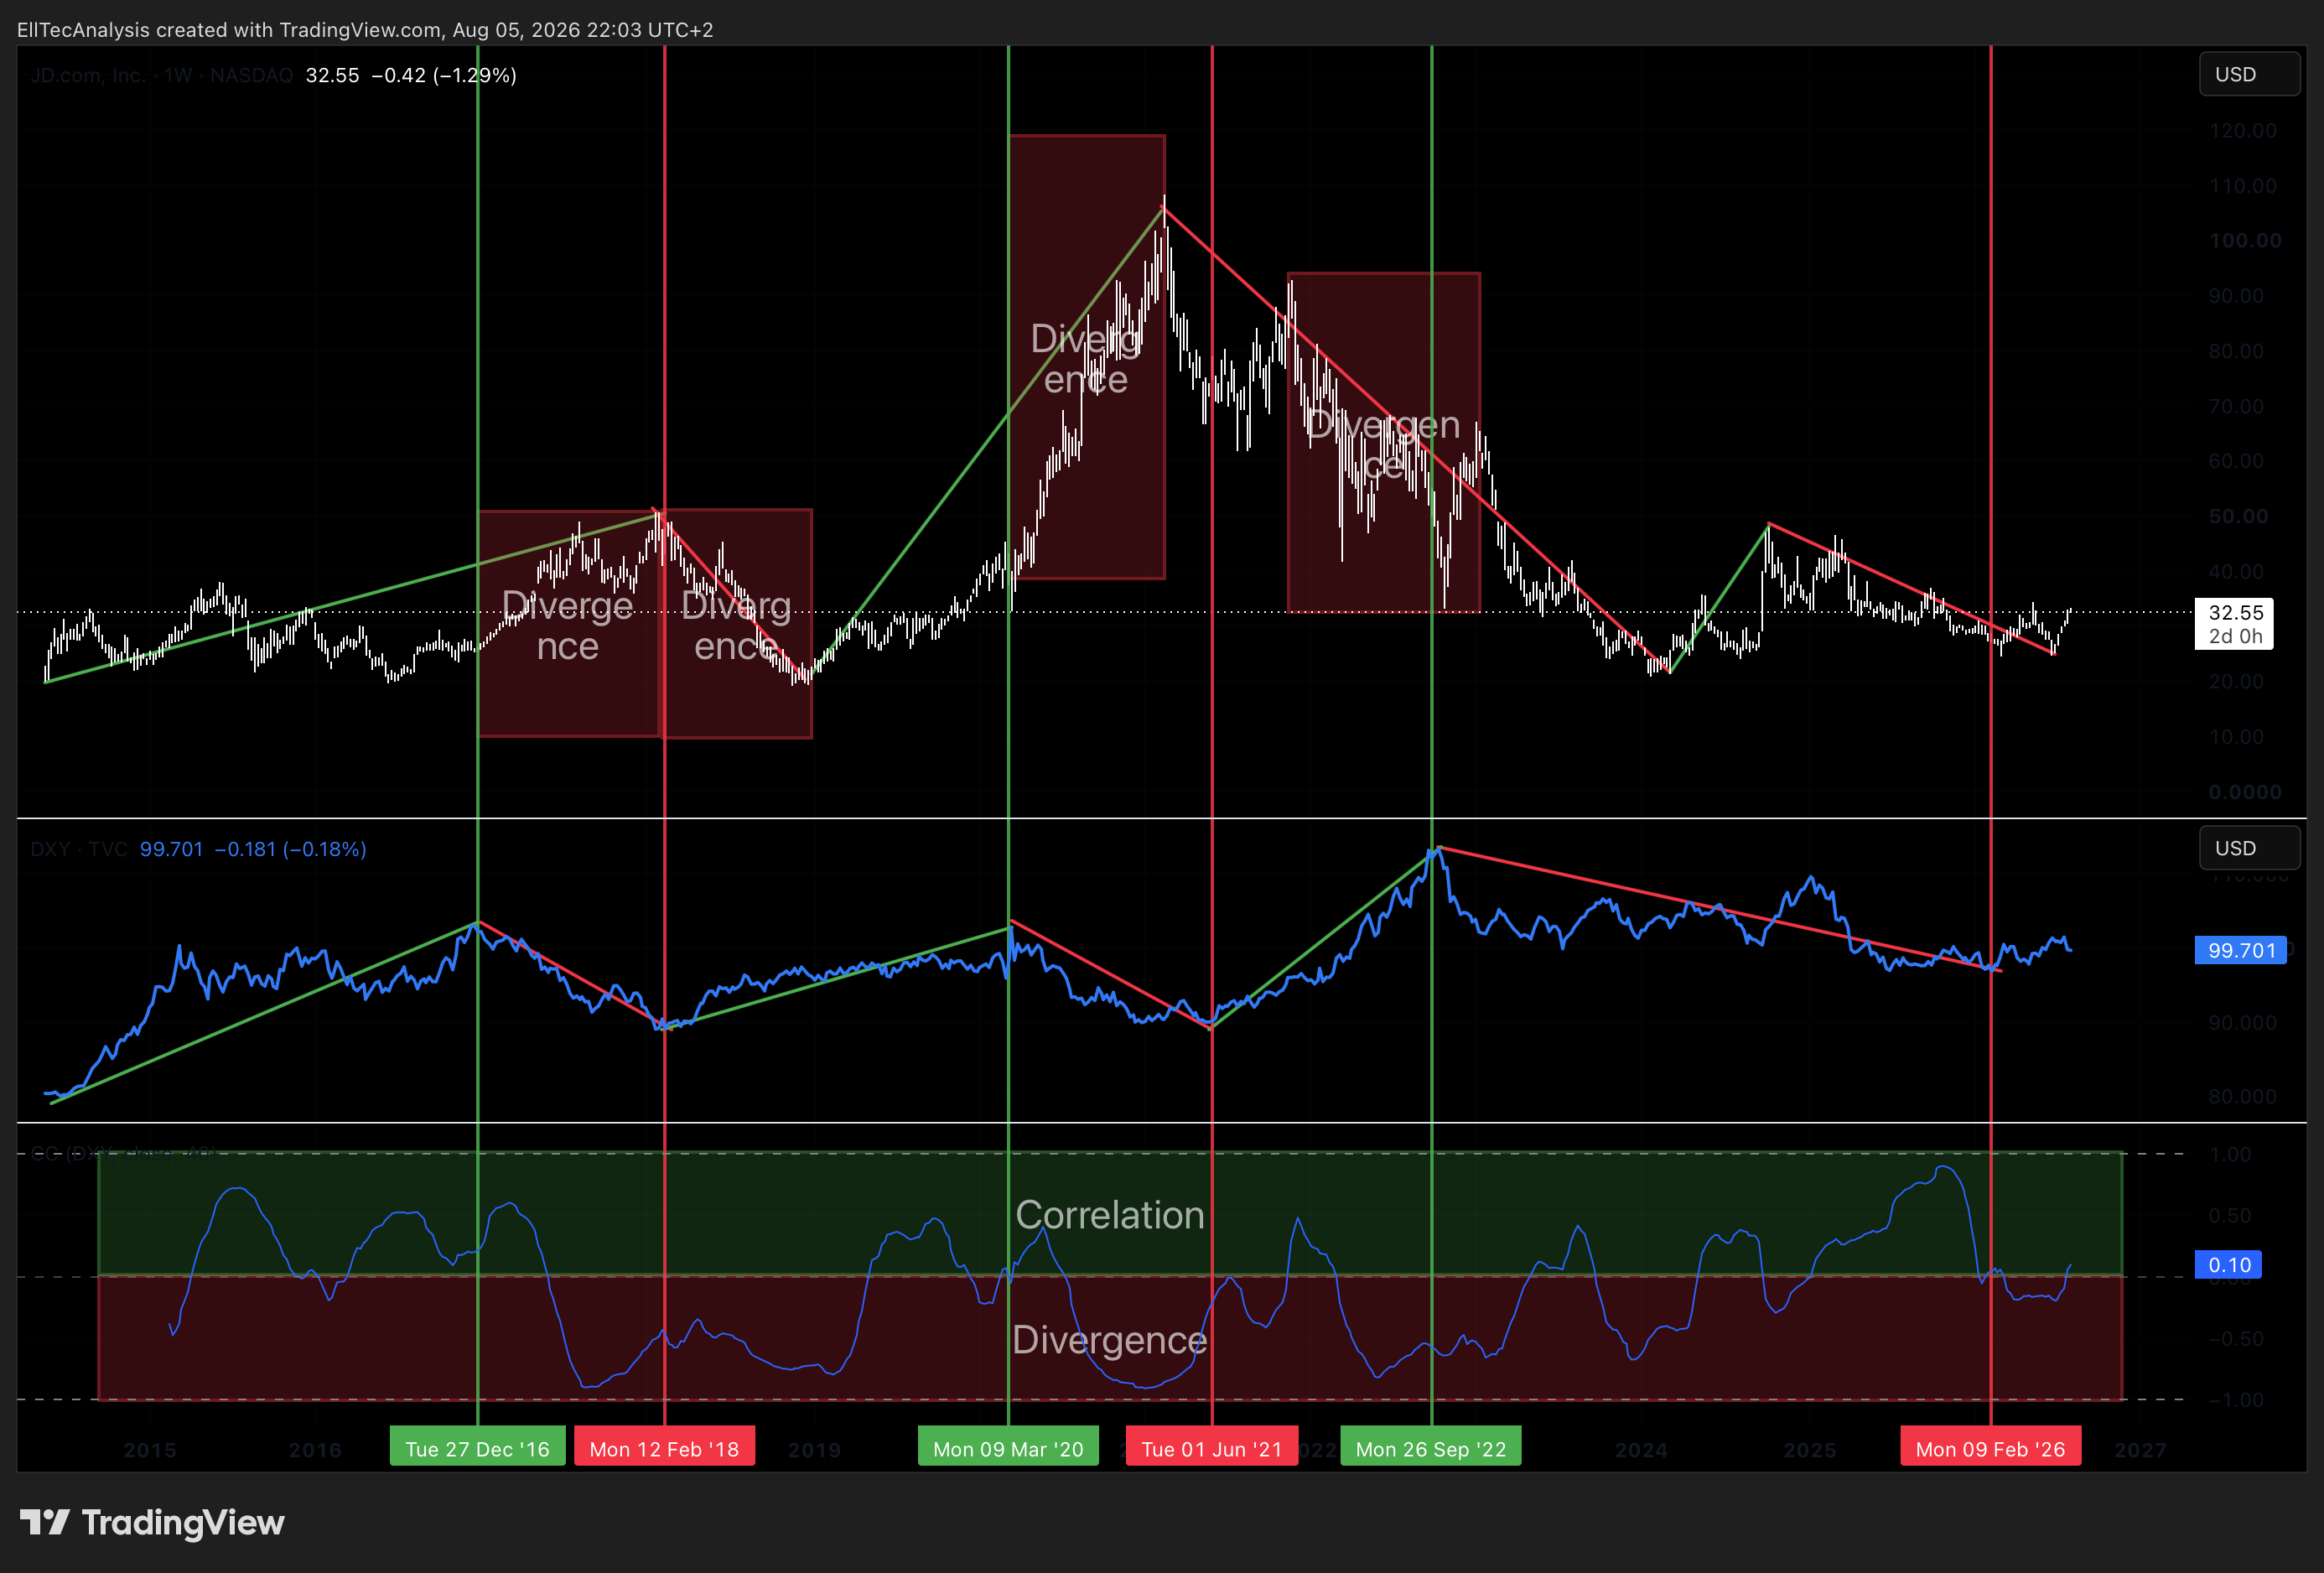
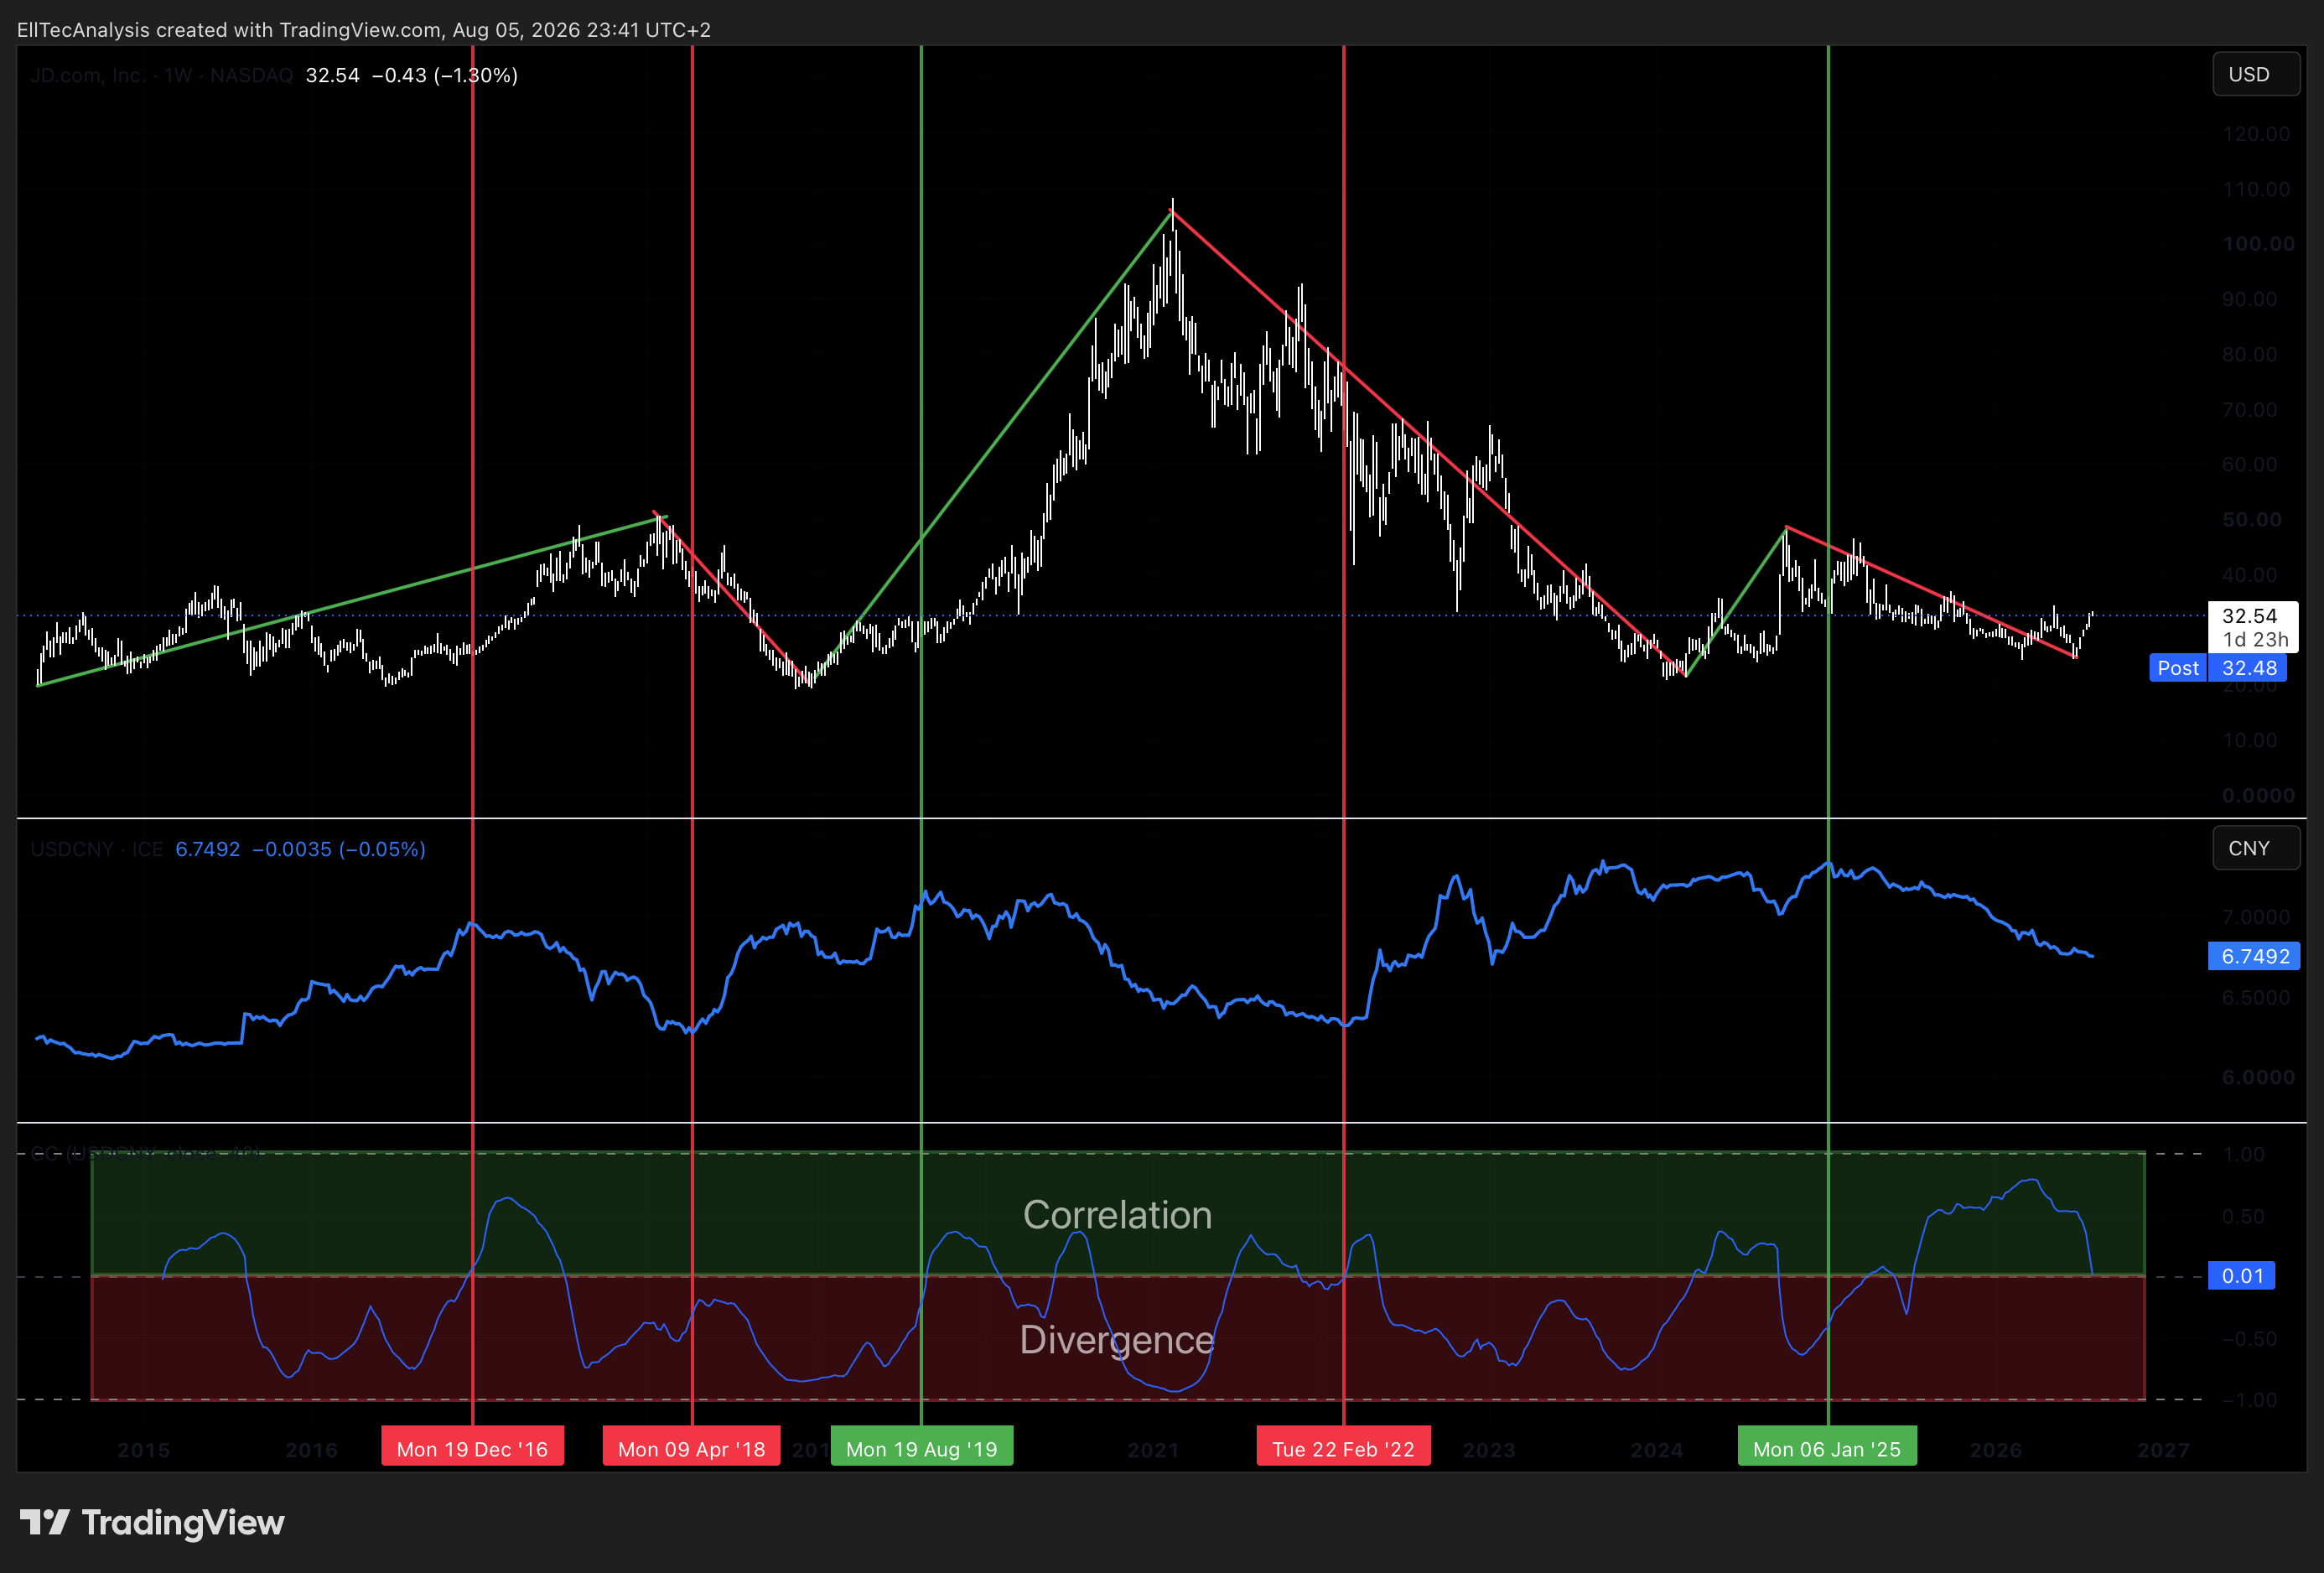
JD reports in RMB but trades as a USD-denominated ADR, giving it a structural sensitivity to the CNY/USD rate: RMB weakness mechanically compresses the USD-equivalent value of JD’s revenue, earnings, and dividend for ADR holders even when underlying RMB-denominated performance is unchanged, while broad dollar strength tends to coincide with the same risk-off conditions that pressure Chinese equities generally.
Chinese Consumer Spending & Sector Competitive Dynamics
JD’s most important idiosyncratic correlation right now runs through the ongoing instant retail war with Meituan and Alibaba’s Taobao/Ele.me: capital intensity and margin trajectory across all three names have moved together through 2025-2026 as each has escalated and then moderated food-delivery investment, and spending-discipline headlines from any one competitor tend to move the whole group. Layered on top is JD’s sensitivity to Chinese government stimulus, particularly trade-in subsidies for electronics and appliances, JD’s largest single product category, which has driven the pronounced base-effect swings visible in the FY2025/FY2026 numbers discussed in Section 1.
US-China Trade Relations & Regulatory / ADR Risk
Periodic flare-ups in US-China trade rhetoric, tariff threats, and chip-export policy continue to move the entire China ADR complex, JD included, even though the acute HFCAA delisting threat has been substantially de-risked since the PCAOB’s December 2022 audit-access determination. JD’s dual-primary listing on the Hong Kong Stock Exchange provides a further structural hedge, giving holders a liquid alternative venue should US-listing risk ever resurface. On the corporate-action side, the pending Ceconomy acquisition adds a discrete EU-regulatory correlation of its own running into the October 2, 2026 European Commission decision deadline.
3 · SEASONALITY
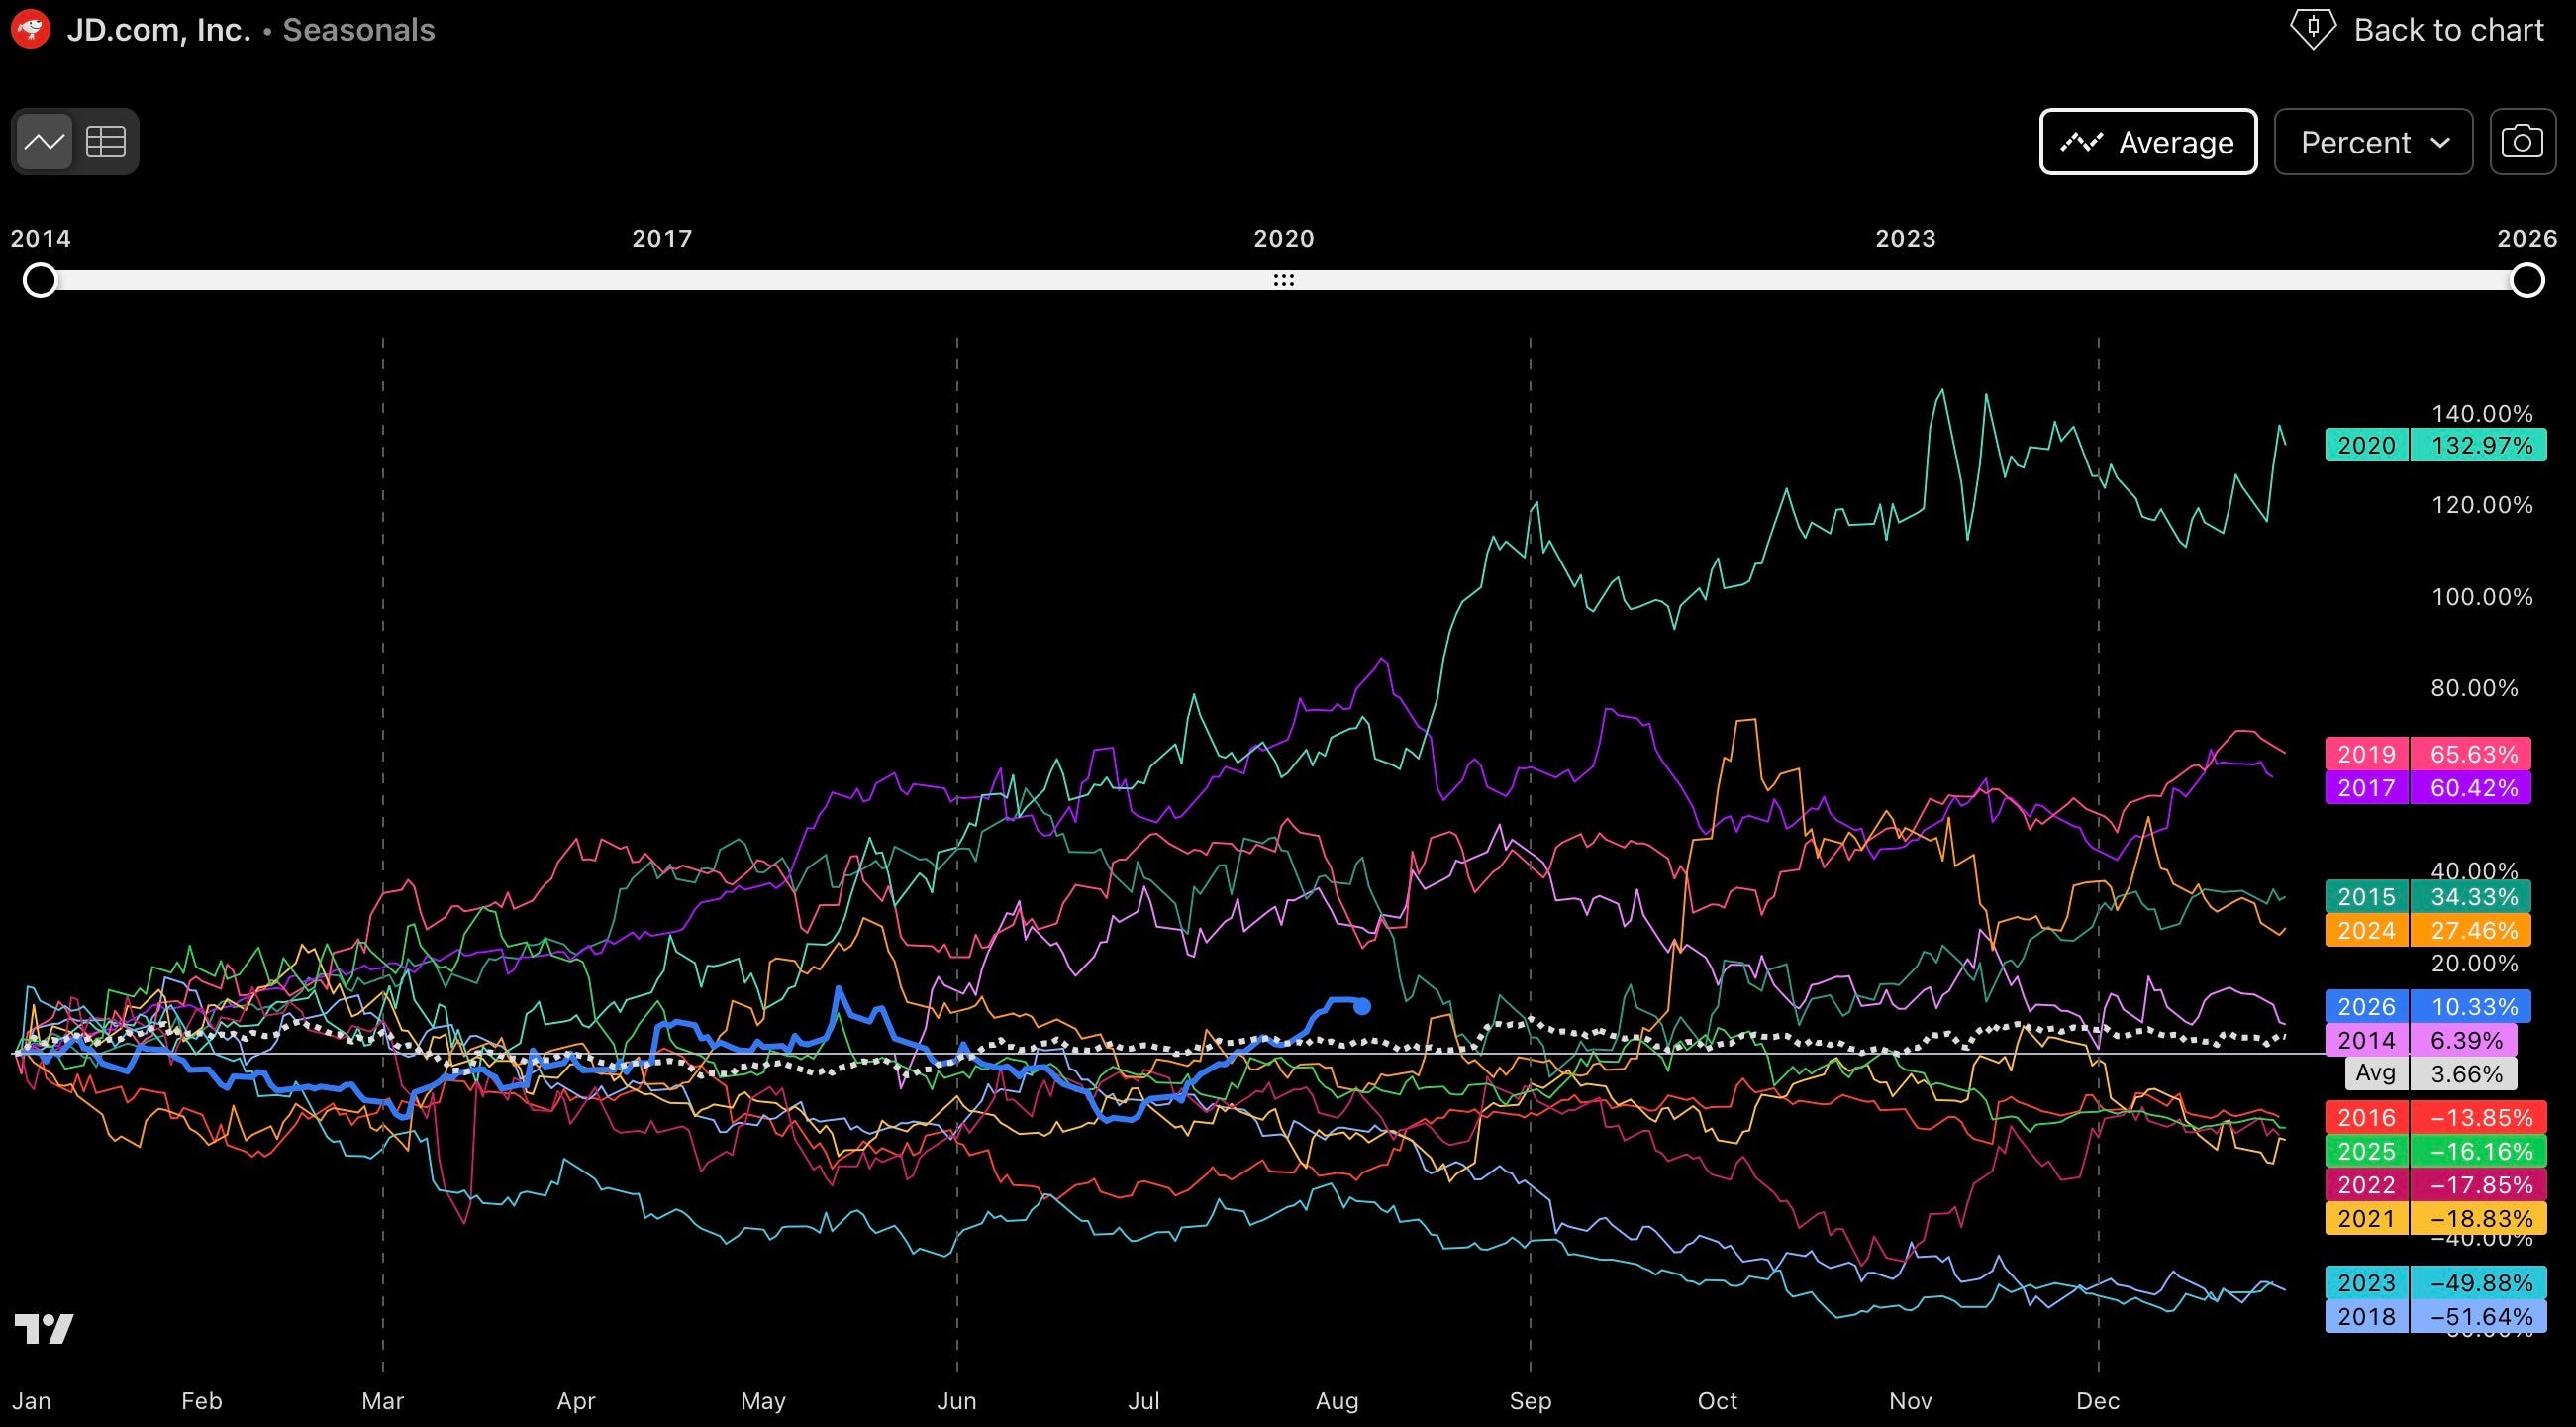
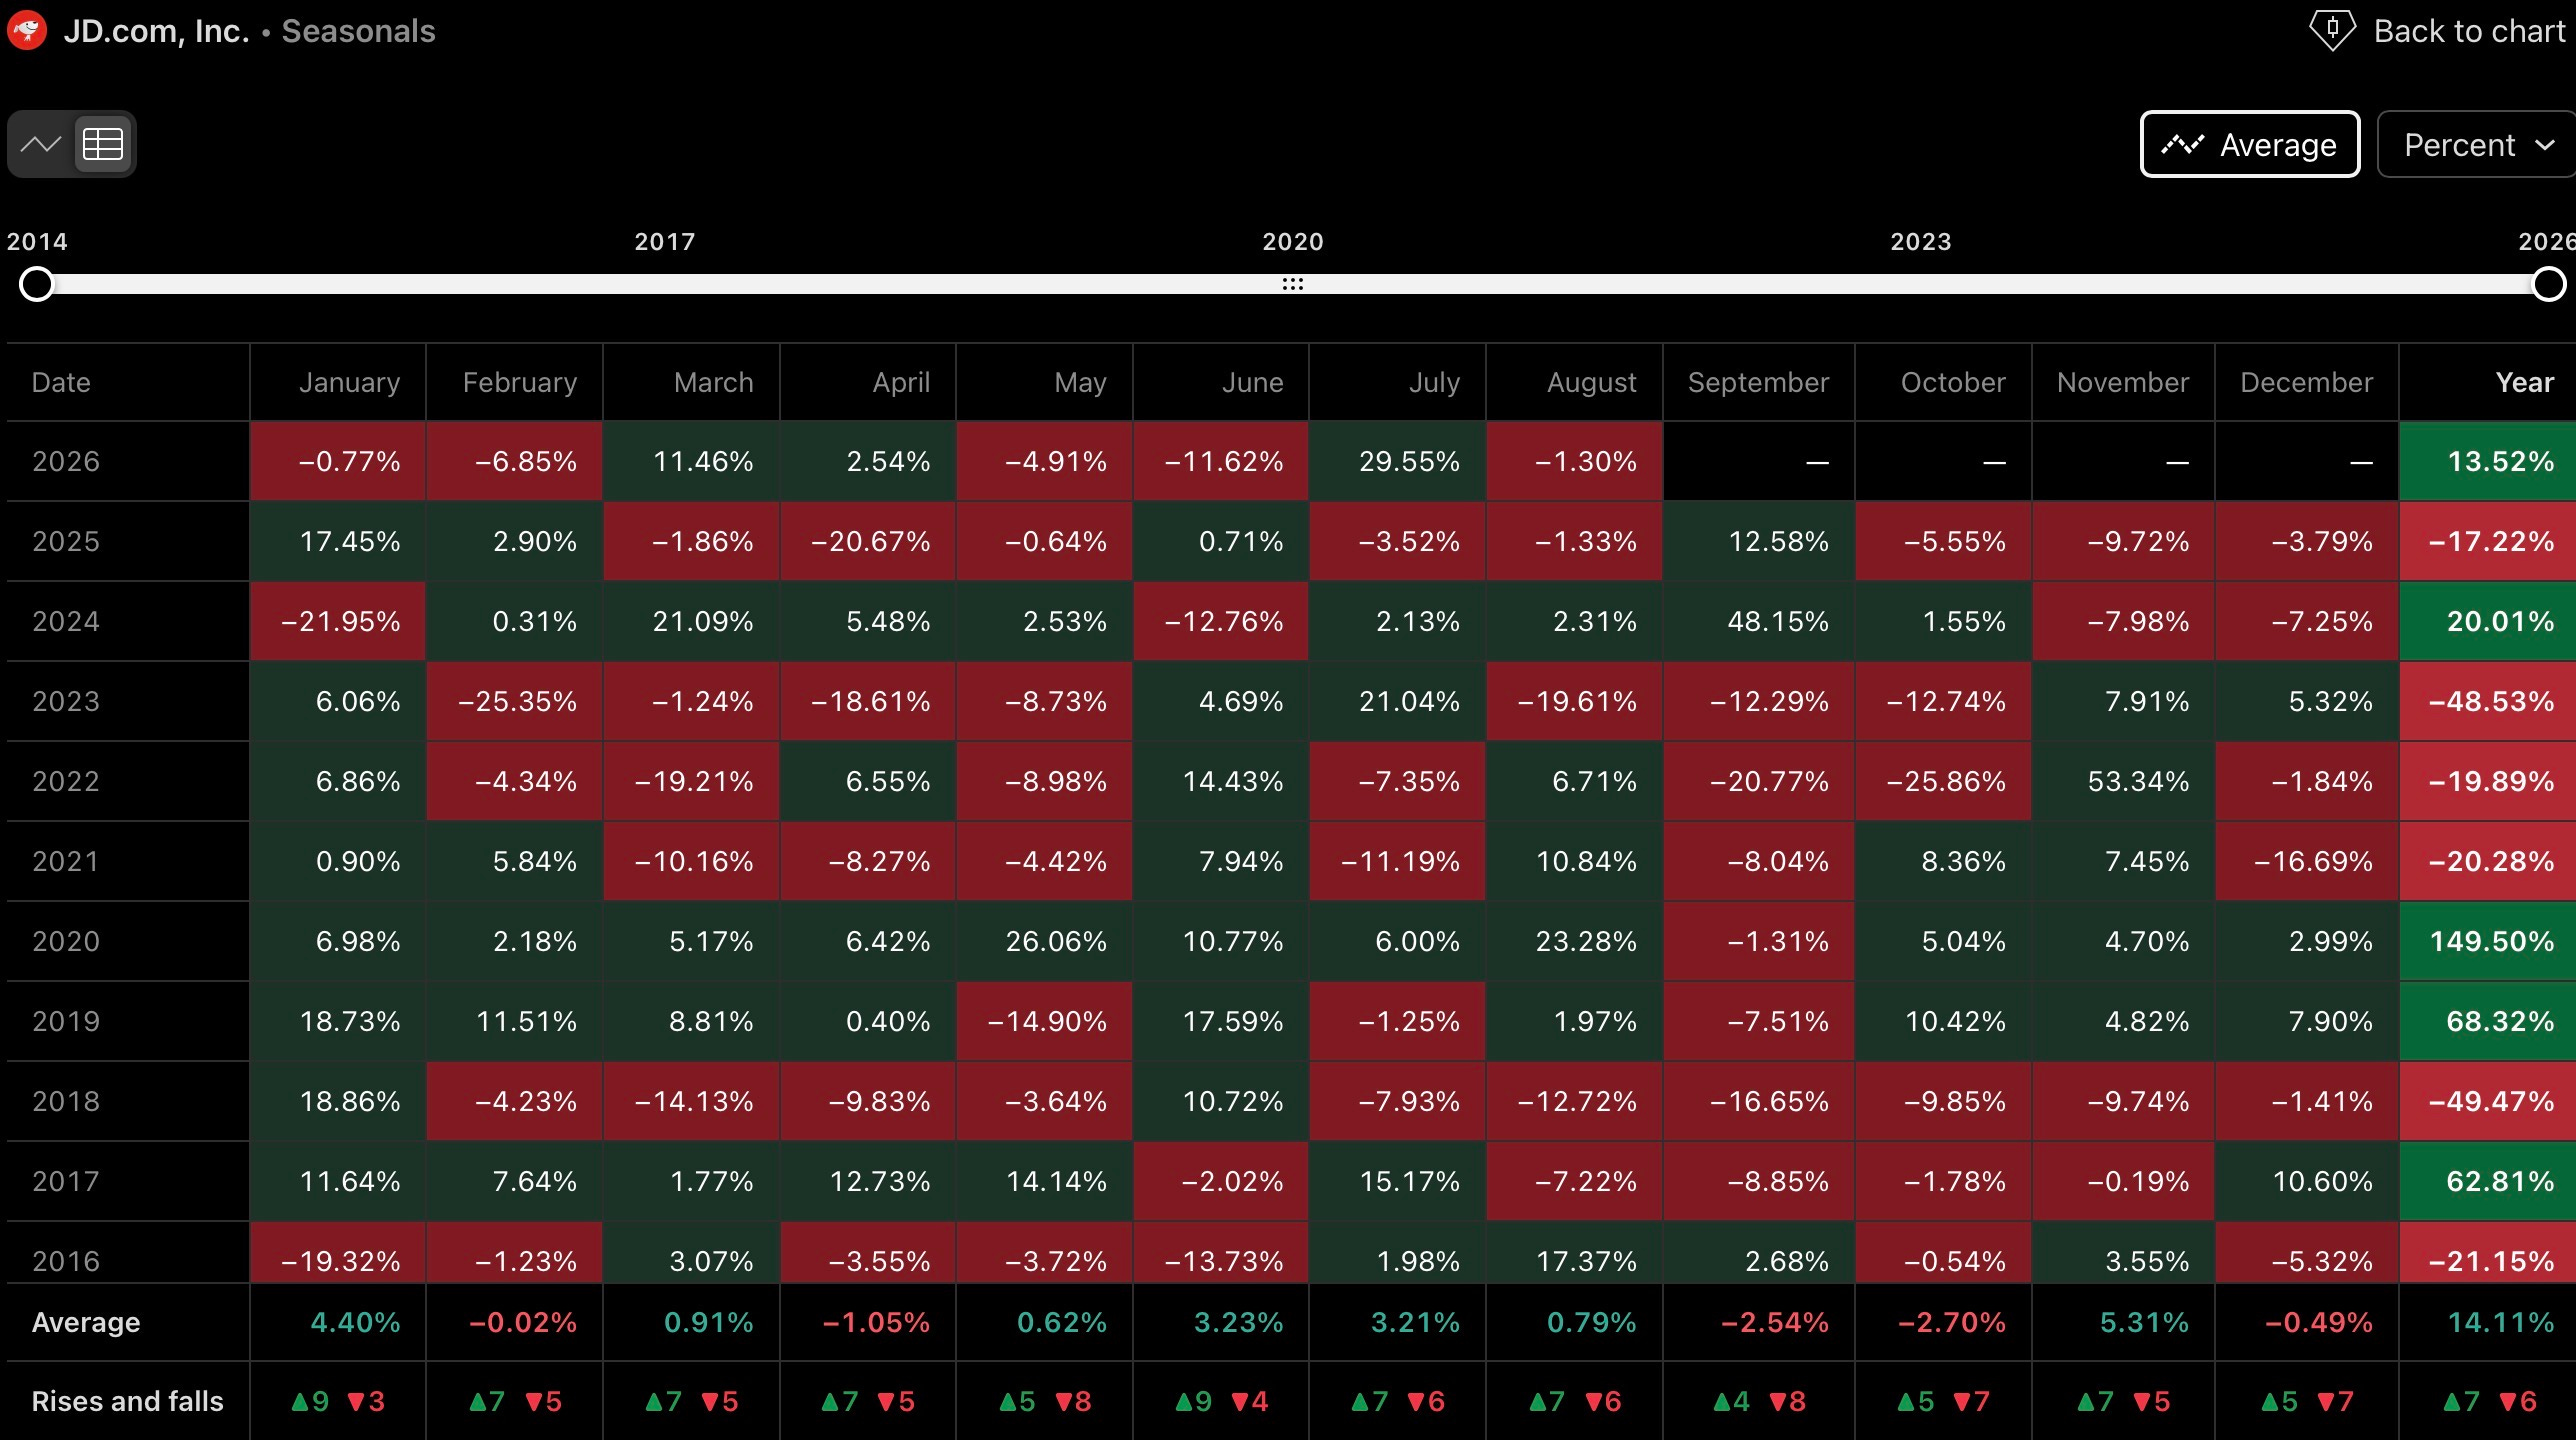

JD.com’s historical seasonal pattern is best treated as directionally suggestive rather than a standalone signal. Across the calendar, the only reliably negative months have been February (mild and fairly neutral in practice), April, September, October, and December, while May through August stands out as the one genuinely consistent stretch, four consecutive historically positive months. Outside that window, performance alternates without a strong pattern, which is exactly why this tendency should be weighted lightly, particularly given the limited historical sample size behind it. The one observation worth carrying into the trade planning section below is that September and October have historically produced the largest average monthly losses, which argues for treating renewed weakness into those months as a seasonal cue to complete position sizing by November at the latest, ahead of what has historically been the more favorable November-through-April stretch, rather than as a reason to abandon the structural thesis.
4 · TECHNICAL ANALYSIS — ELLIOTT WAVE FRAMEWORK
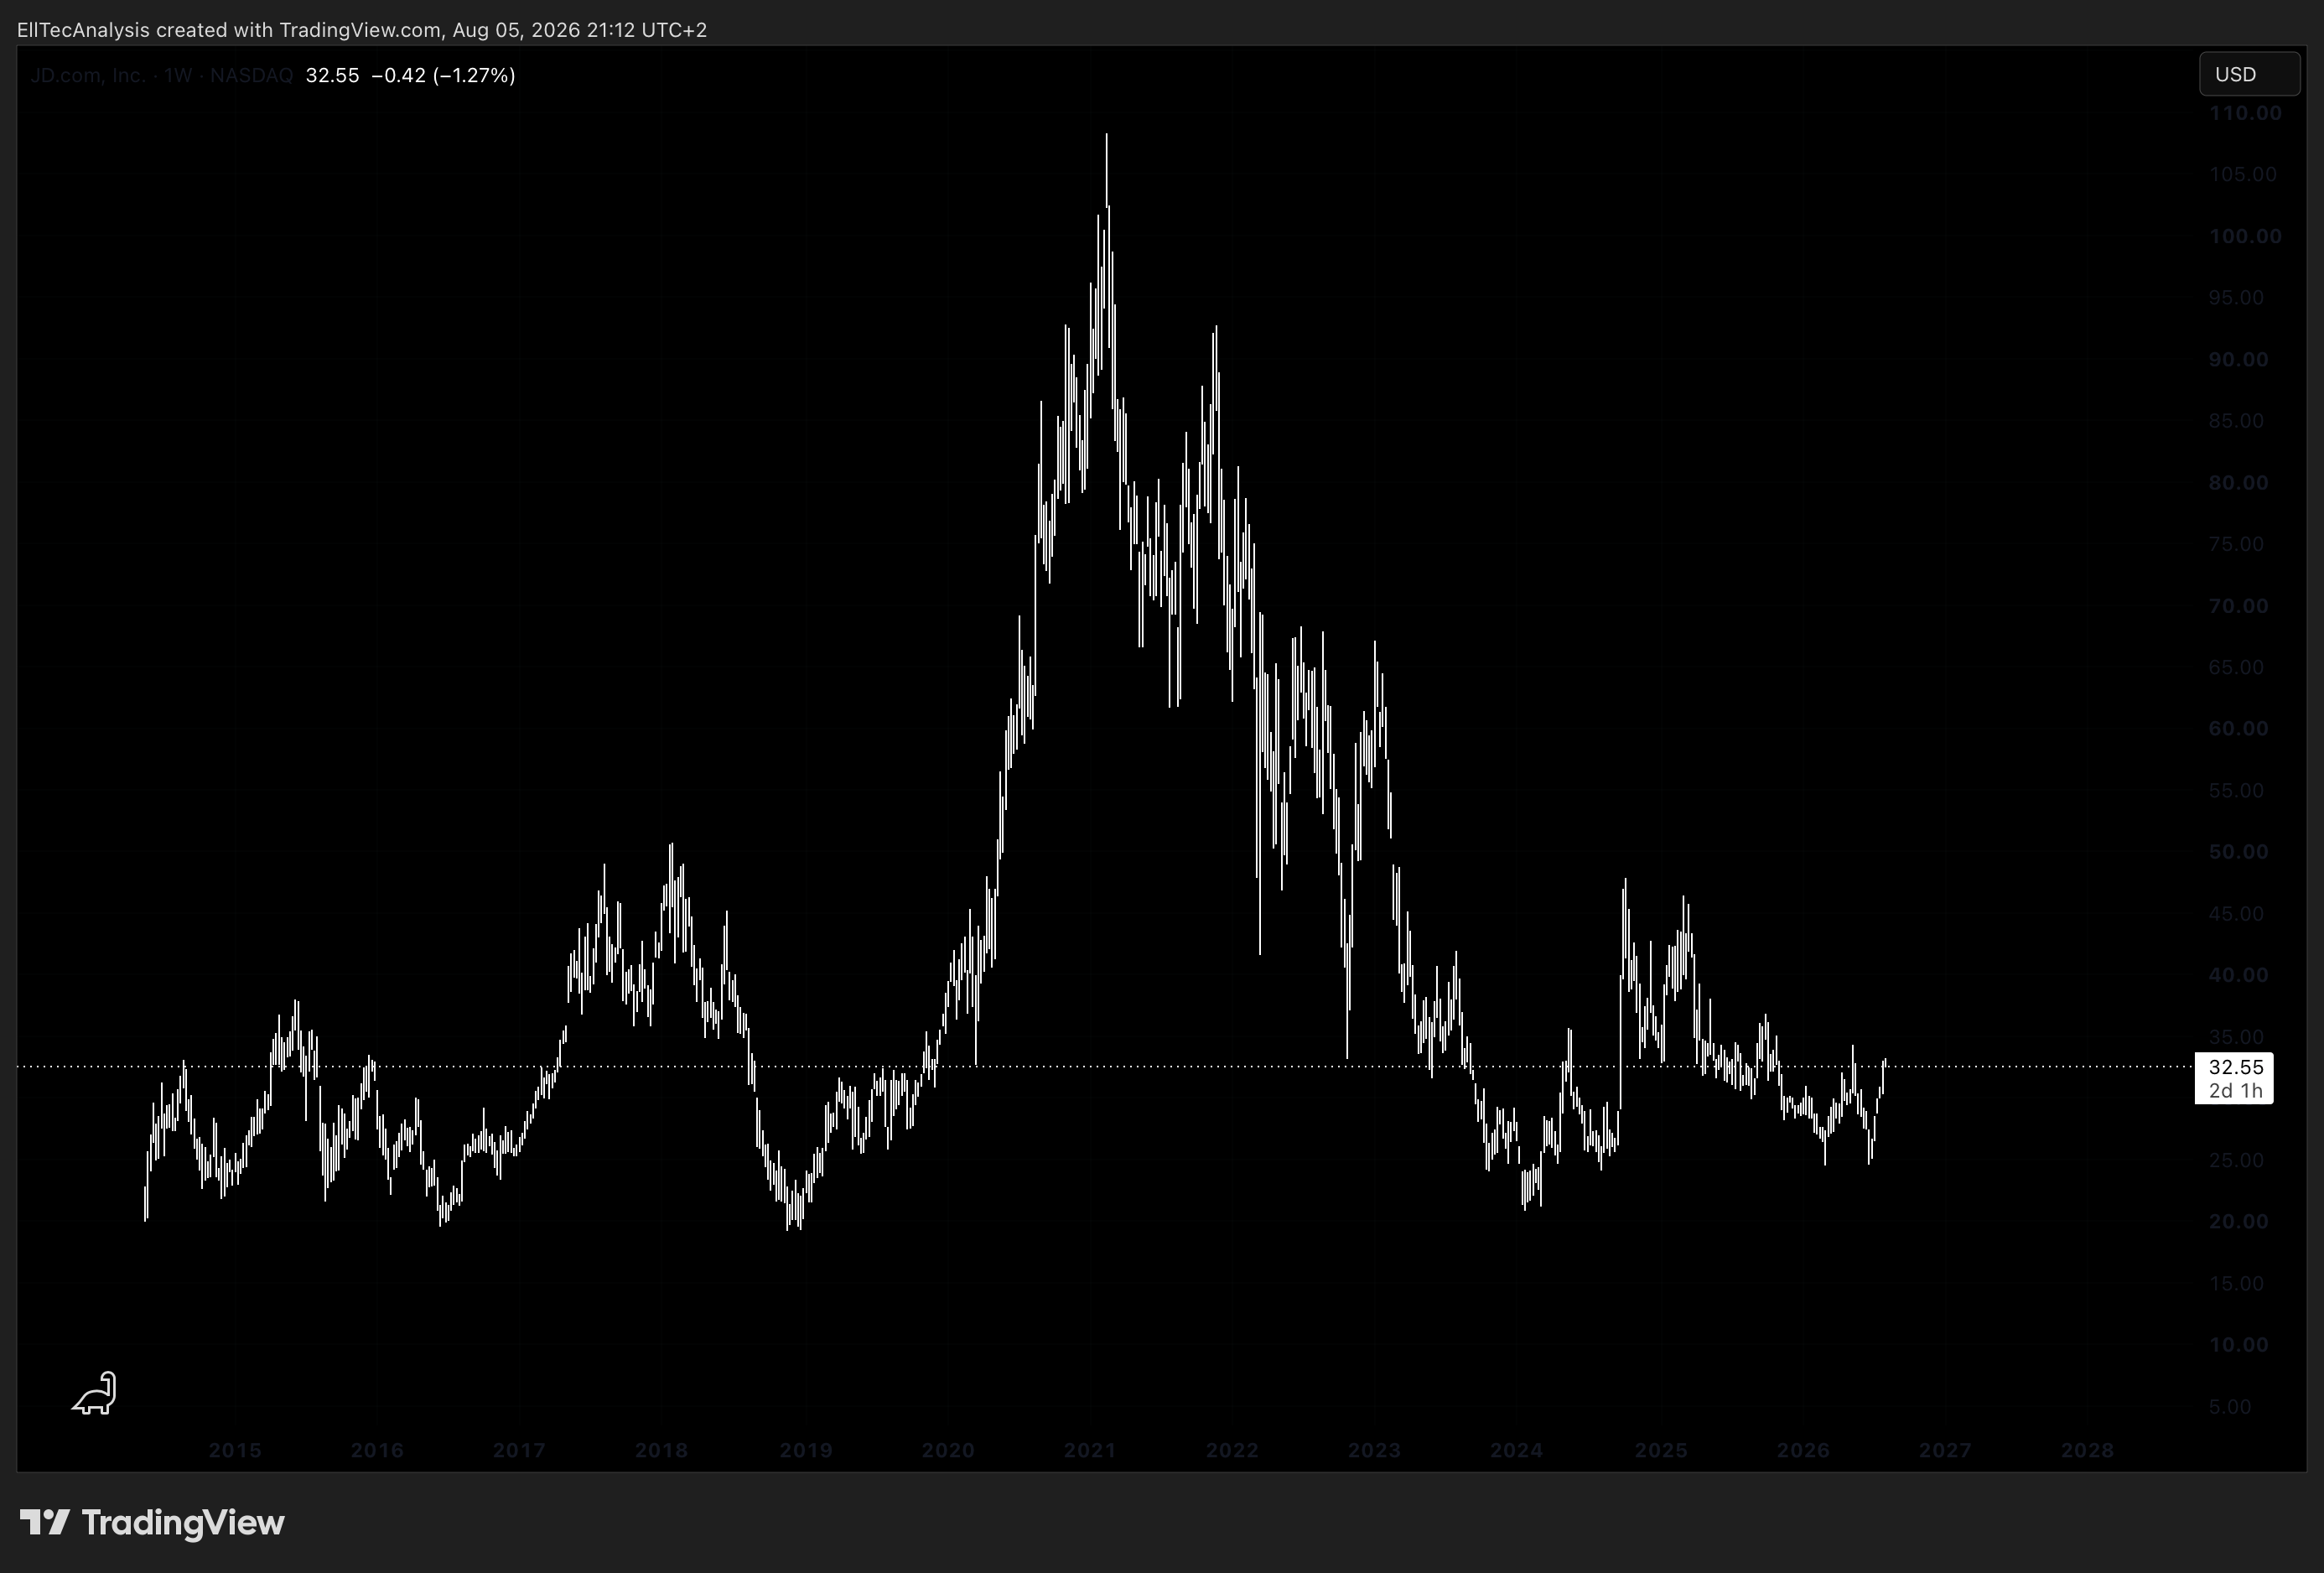
4.1 Elliott Wave Analysis

 | A guest post by
|