

Alibaba Group (BABA)
The Correction Has a Floor


1. Fundamentals

Alibaba Group Holding Limited is China’s dominant technology conglomerate, operating at the intersection of e-commerce, cloud infrastructure, digital media, logistics, and financial technology. Founded in 1999 by Jack Ma in Hangzhou, the company has grown into one of the largest corporations in the world by market capitalisation, with its primary listings on the New York Stock Exchange (BABA) and the Hong Kong Stock Exchange (9988.HK). Its principal segments include China Commerce, International Commerce, Local Consumer Services, Cainiao (logistics), Cloud Intelligence, and Digital Media and Entertainment, a breadth of operation that makes Alibaba less a retailer and more a foundational layer of the Chinese digital economy.
The macro backdrop for Alibaba is complex but increasingly constructive. China’s post-pandemic recovery has been uneven, with consumer spending and property sector headwinds weighing on domestic sentiment through 2022 and much of 2023. However, a combination of targeted fiscal stimulus, monetary easing by the People’s Bank of China, and deliberate regulatory stabilisation beginning in late 2022 has meaningfully changed the operating environment. The sweeping technology crackdown that defined 2021 and 2022 and which played a central role in compressing the valuations of Chinese internet platforms, has shifted into a phase of regulatory consolidation rather than active escalation. Alibaba itself received its final fine from the State Administration for Market Regulation in 2021 and has since been operating with greater strategic clarity. The company’s ongoing restructuring into six semi-independent business units, announced in early 2023, represents a deliberate effort to unlock embedded value and improve capital allocation discipline, with the potential for selective IPOs of individual divisions providing a further medium-term catalyst.
From a structural standpoint, Alibaba’s cloud division deserves particular attention. Alibaba Cloud remains the dominant cloud provider across Asia-Pacific and is a direct beneficiary of accelerating enterprise digitalisation and AI-driven infrastructure demand across the region. The company’s investments in large language model development and AI integration across its product ecosystem position it as a primary infrastructure player in the emerging AI supercycle, a dynamic with obvious parallels to the position held by hyperscaler peers in the United States. International commerce, via platforms such as AliExpress, Lazada, and Temu-competitor Trendyol (through its indirect exposure), adds a geographic diversification layer that domestic-focused Chinese internet peers cannot replicate.
The core investment thesis rests on the convergence of three dynamics: an extended and structurally significant valuation compression that has brought the stock from its 2020 highs to levels last seen before the 2017 breakout; a regulatory environment that is stabilising rather than deteriorating; and a business model that continues to generate substantial free cash flow through cycles. The question is not whether Alibaba generates value, it clearly does, but whether the market has, at current levels, already fully discounted the risk, and whether the structural wave sequence is now positioned to reassert that underlying value through a multi-year impulsive advance.
Valuation & Ratios
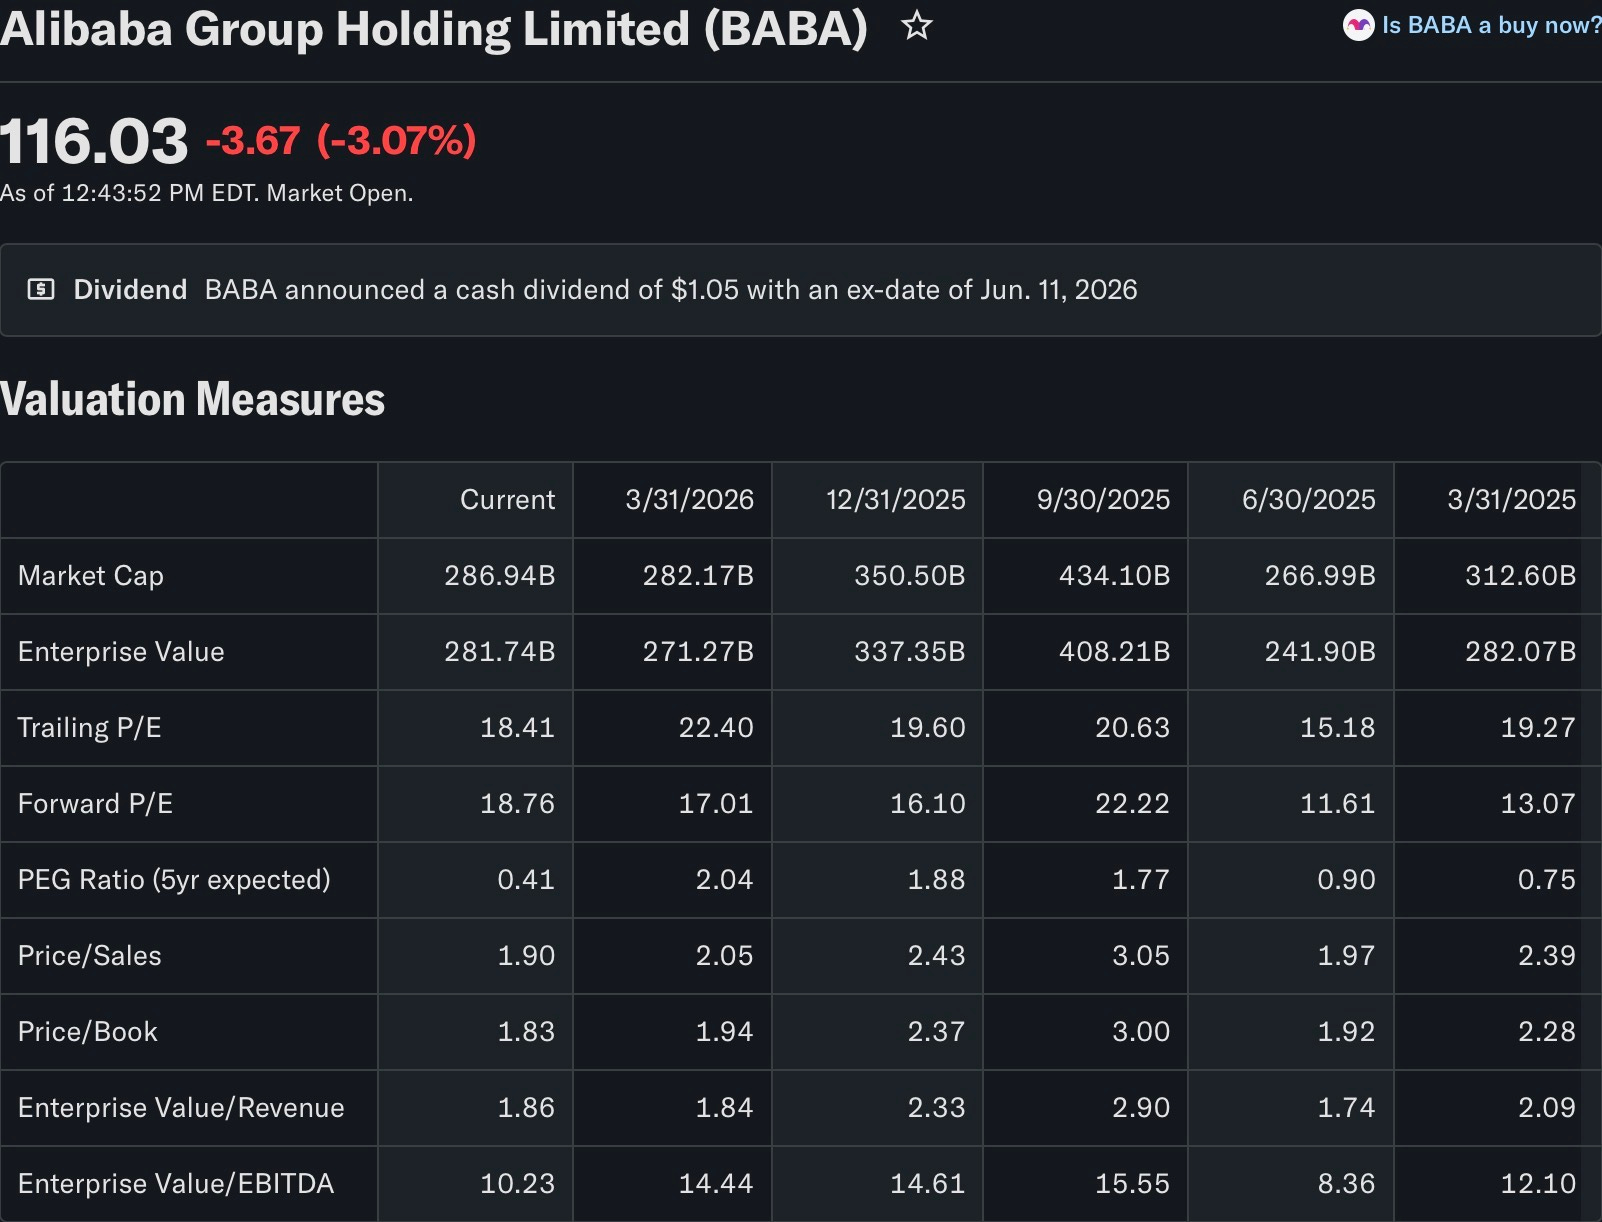
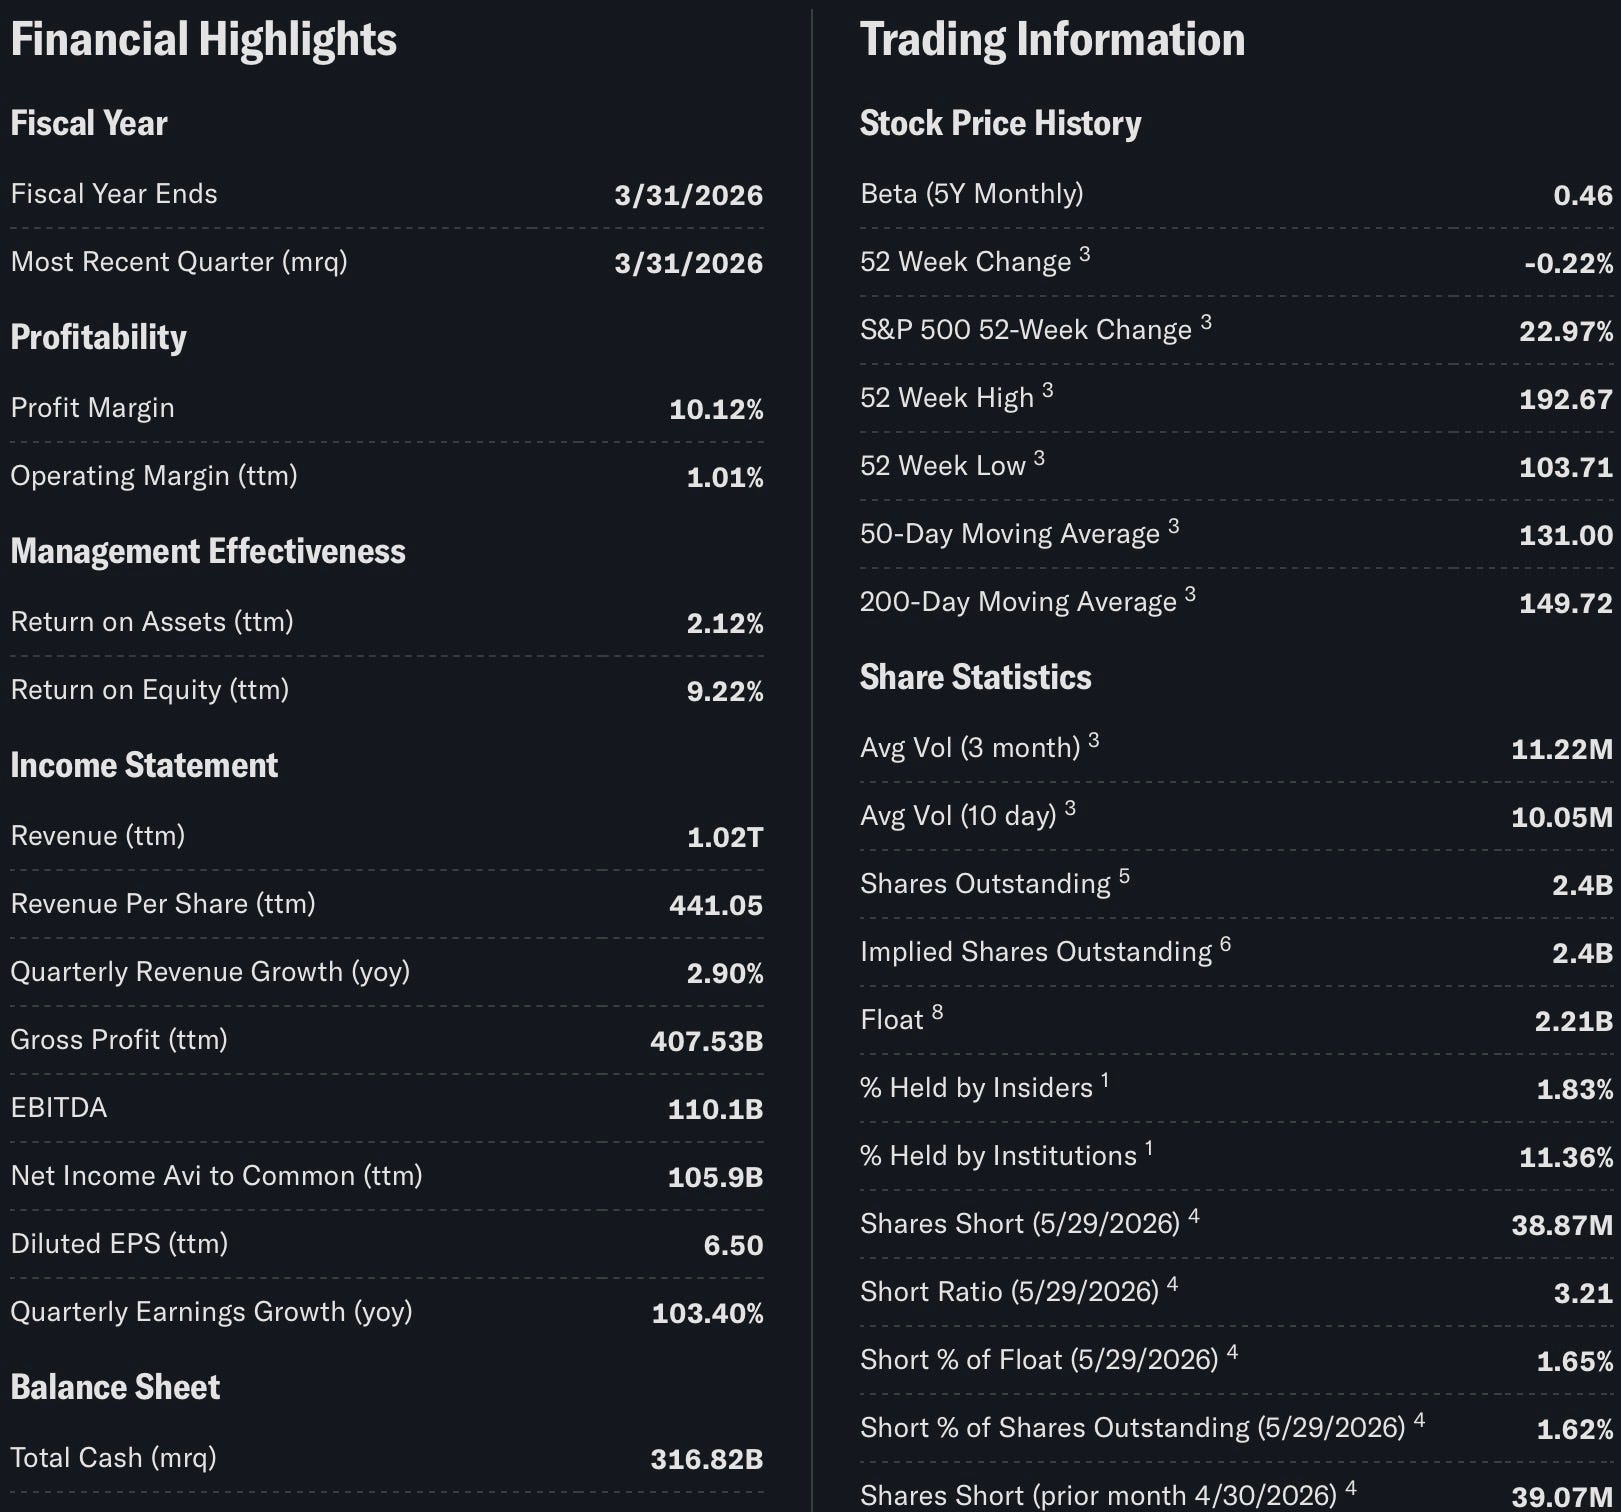
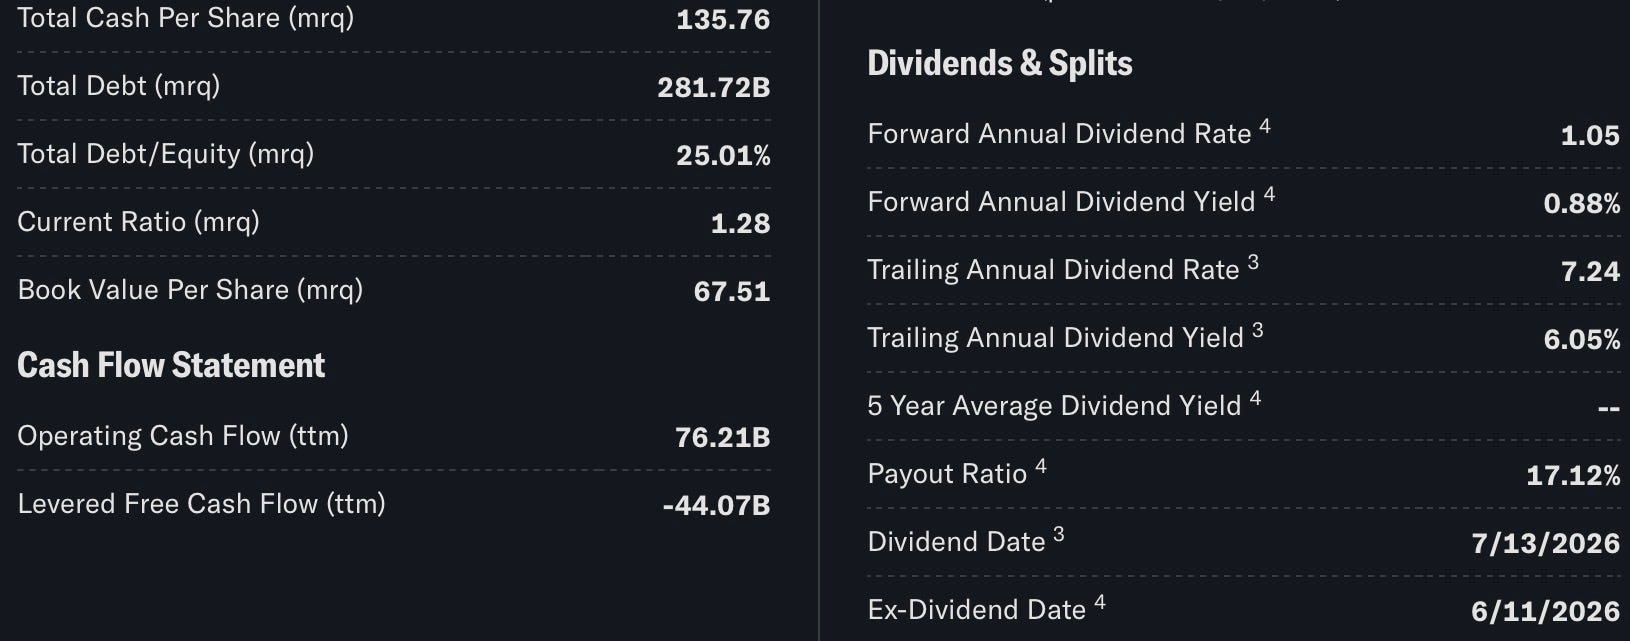
P/E Ratio (18.4x):
Alibaba is currently trading at approximately 18.4 times trailing earnings, which remains reasonable for a technology platform generating over $105 billion in annual net income. The multiple suggests that investors are still assigning a significant discount compared to many large-cap U.S. technology companies.
Forward P/E (18.8x):
The forward earnings multiple remains close to the trailing P/E, indicating relatively stable earnings expectations and supporting the view that the market is not pricing in aggressive future growth assumptions.
PEG Ratio (0.41):
The PEG ratio of 0.41 is one of Alibaba’s most attractive valuation metrics. A PEG below 1.0 typically indicates that earnings growth expectations exceed what is currently reflected in the share price, suggesting potential undervaluation relative to projected growth.
Price-to-Sales (1.9x):
Despite generating more than $1 trillion RMB in annual revenue, Alibaba trades at only 1.9 times sales, a level that remains low compared to many global technology and e-commerce peers.
Price-to-Book (1.8x):
With a Price-to-Book ratio of 1.8x, investors are paying less than two times Alibaba’s book value, while benefiting from a balance sheet containing more than $316 billion in cash and short-term investments.
EV/EBITDA (10.2x):
Alibaba’s Enterprise Value to EBITDA ratio of 10.2x reflects a relatively modest valuation for a dominant platform business with strong cash generation, multiple growth segments, and substantial financial flexibility.
Overall Assessment:
The combination of a low PEG ratio, moderate earnings multiple, strong liquidity position, and conservative enterprise valuation suggests that Alibaba continues to trade at a discount to its long-term earnings power and asset base. From a fundamental perspective, valuation remains one of the strongest pillars of the bullish investment thesis and underlines the long-term bullish outlook.
2. Correlations
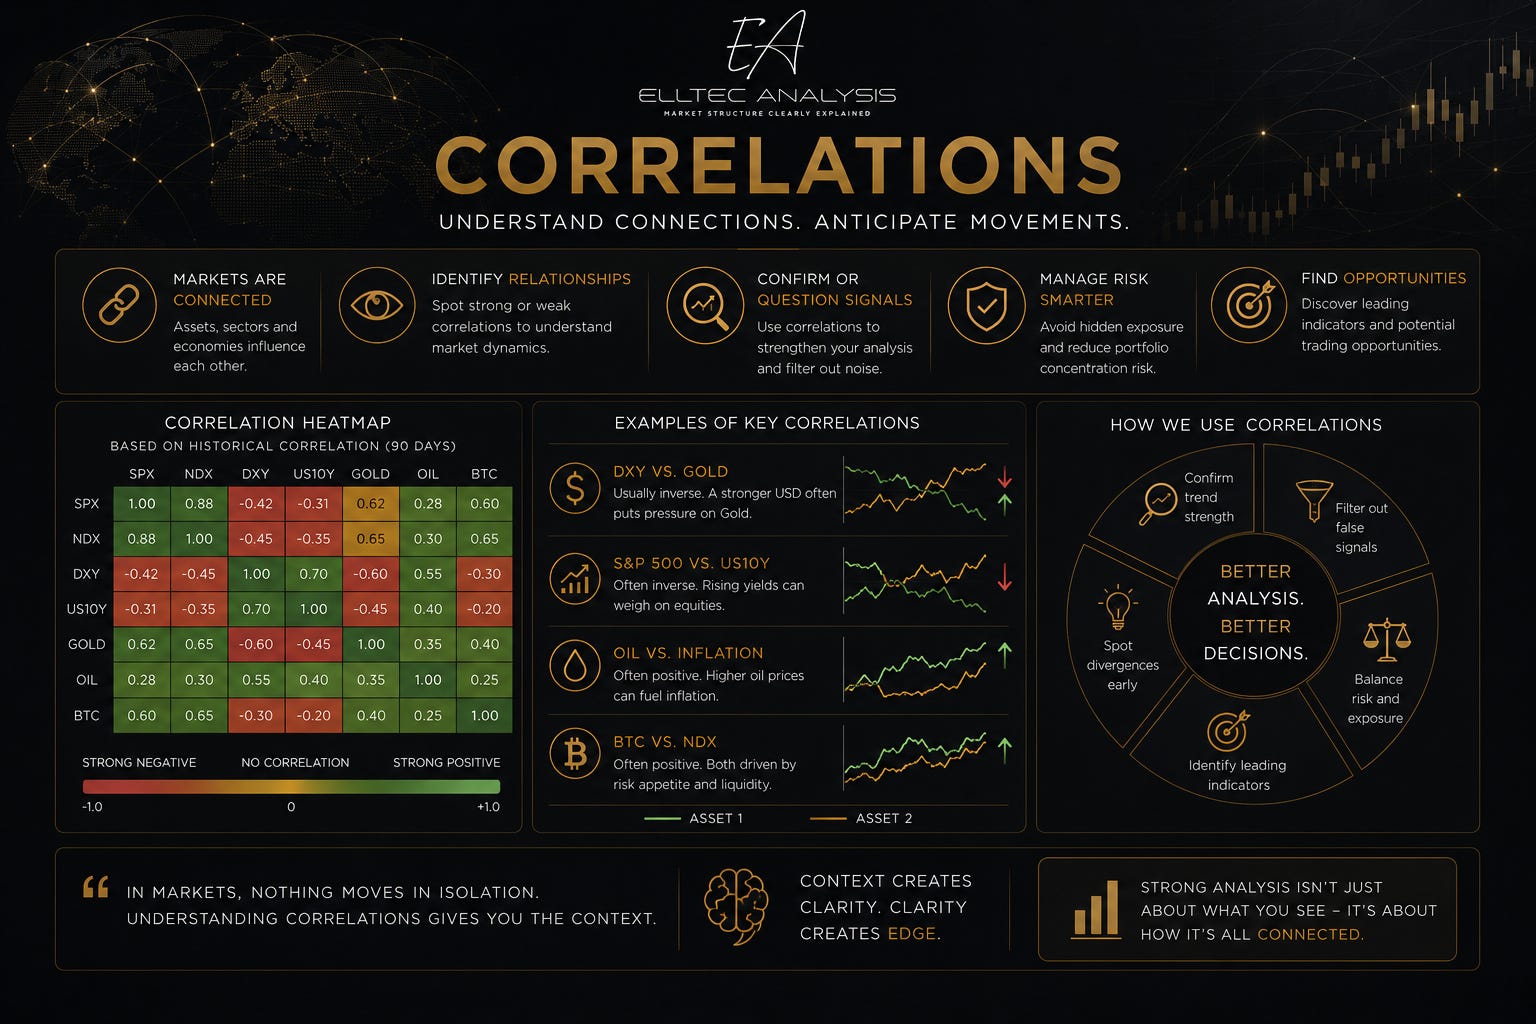
The correlation structure of Alibaba is multi-layered, shaped by its dual identity as both a Chinese domestic consumption proxy and a globally-traded technology asset listed in New York.
Global Risk Sentiment (Risk-On / Risk-Off)
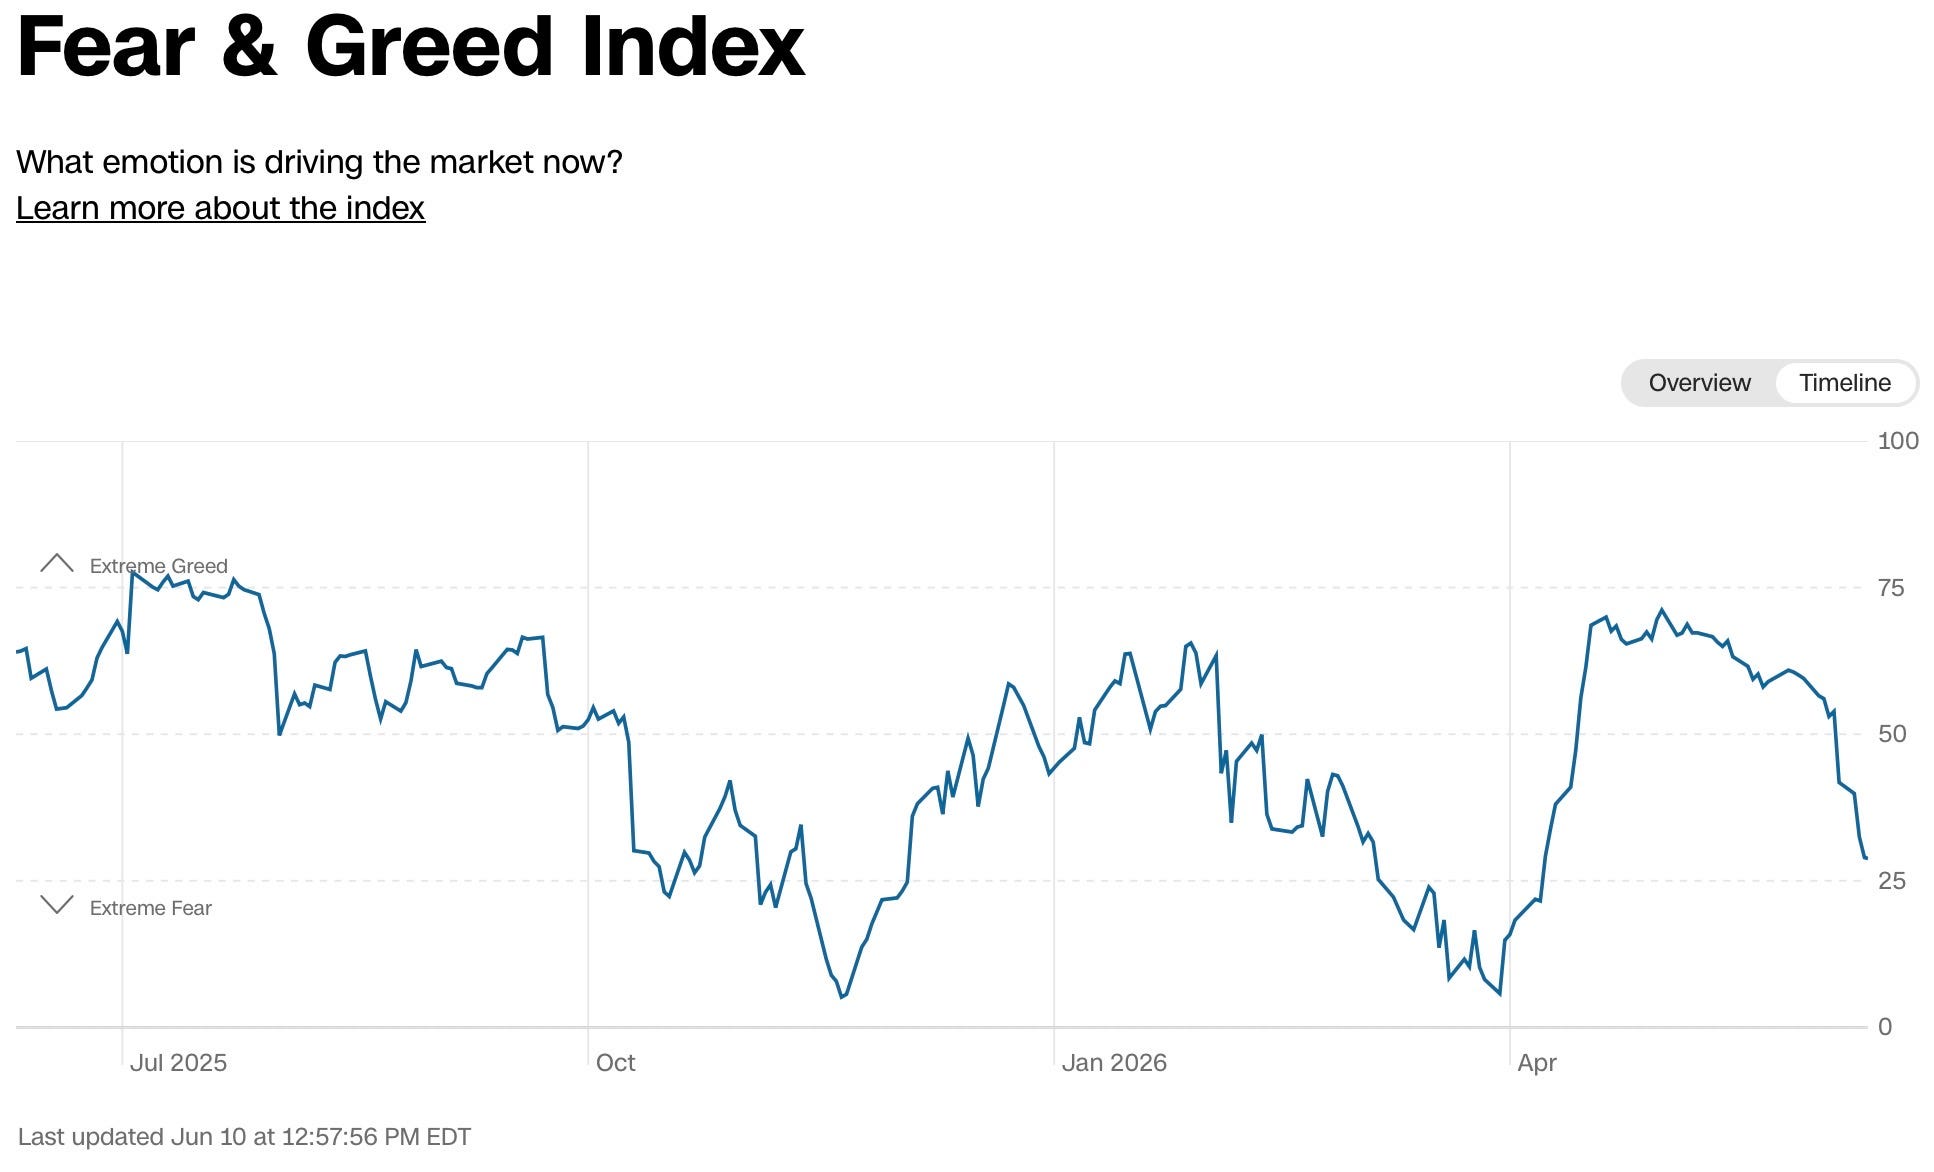
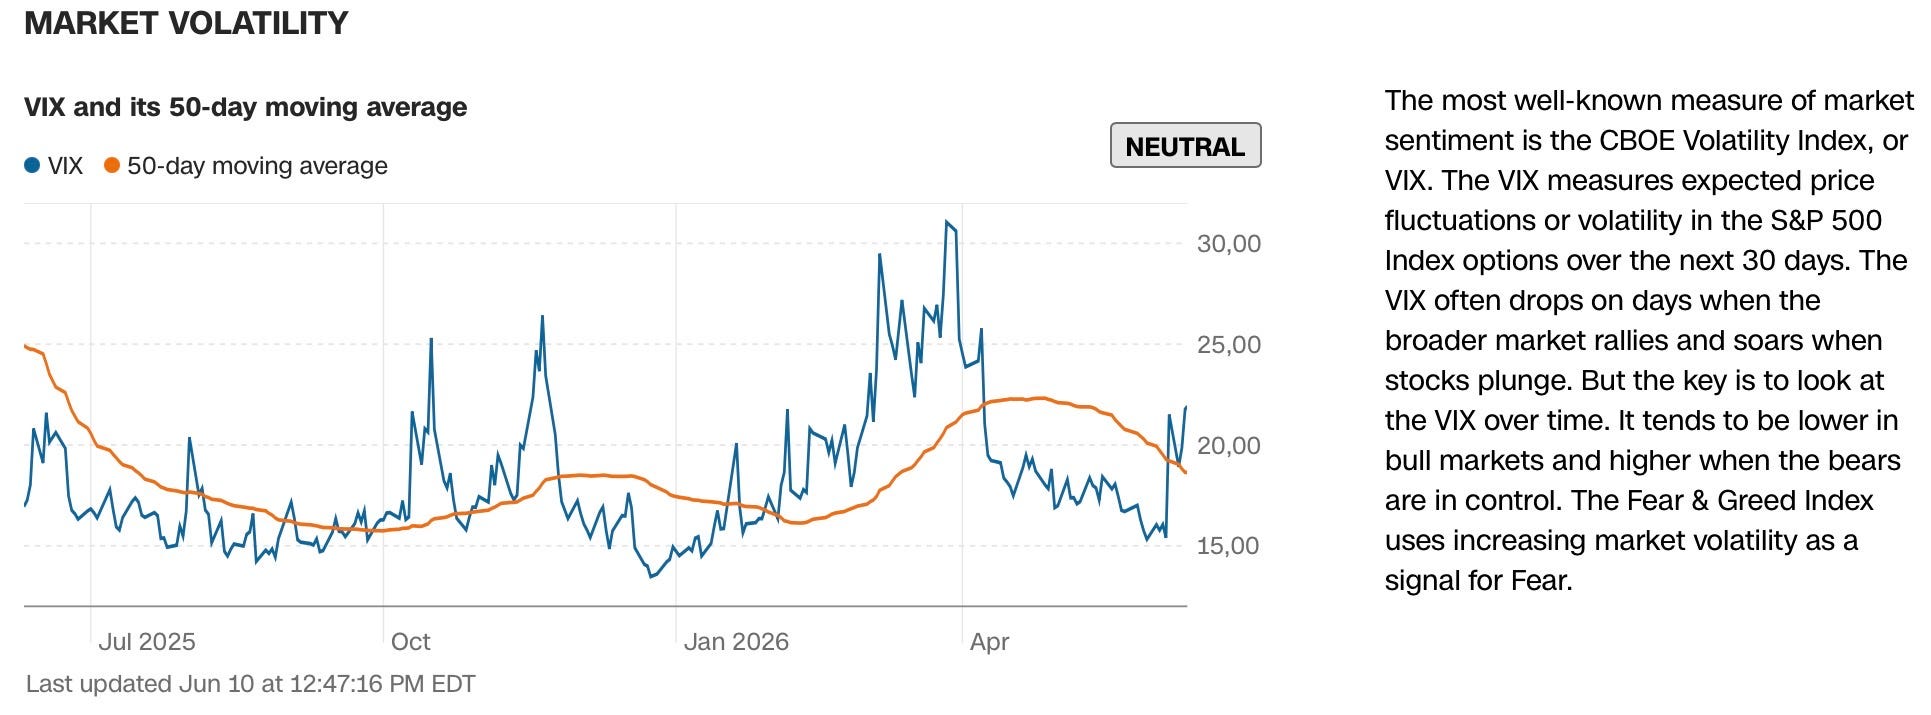
As a high-beta technology name with significant foreign institutional ownership, Alibaba exhibits strong sensitivity to global risk appetite. During risk-off episodes, rising VIX, widening credit spreads, or geopolitical escalation, BABA tends to underperform disproportionately, as foreign investors reduce emerging market technology exposure before domestic equity exposure. In risk-on regimes, the inverse applies, and the stock can move sharply as liquidity chases high-beta growth.
Hang Seng Index (HSI)
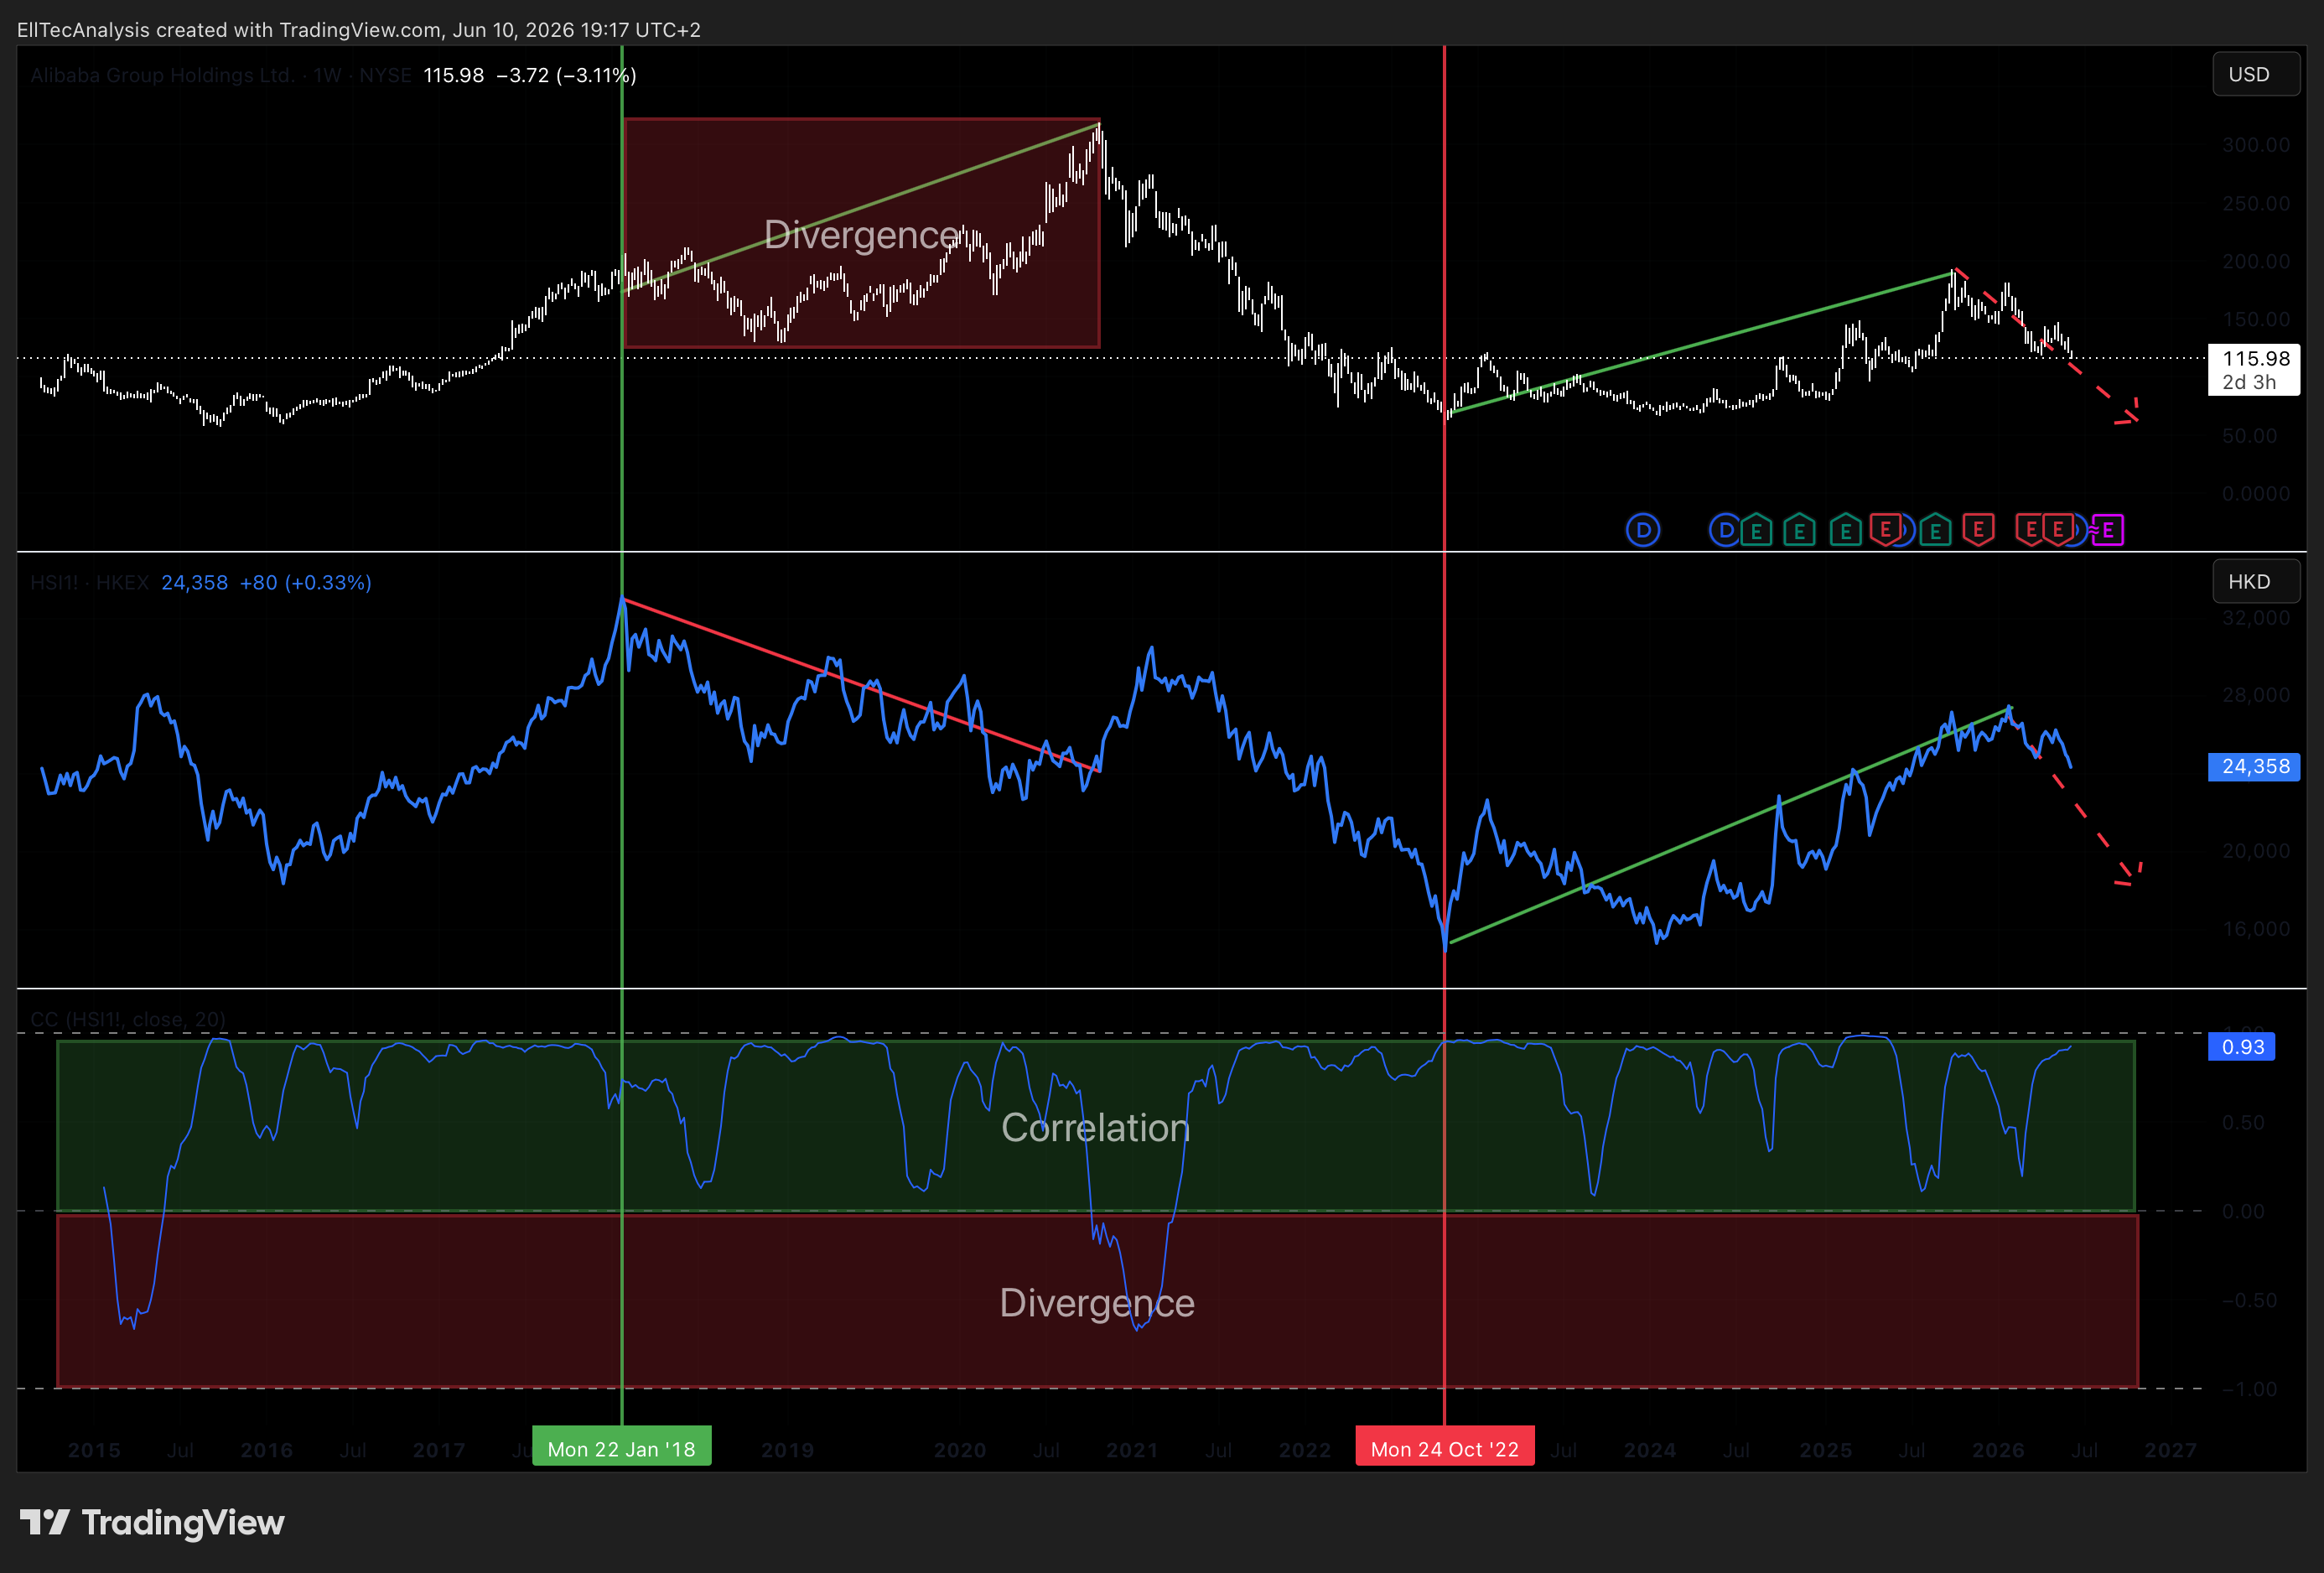
Alibaba maintains a near-structural correlation with the Hang Seng Index, of which it is a major constituent. The relationship is regime-consistent across timeframes, with divergences tending to be short-lived and mean-reverting. Periods of relative underperformance by BABA against HSI have historically corresponded to company-specific headline risk rather than sector-level dynamics, making the index a useful baseline for isolating stock-specific alpha.
In the technical analysis below, the HSI Index has a major influence in which scenario is the most likely one.
More about the HSI:

US Dollar Index (DXY)
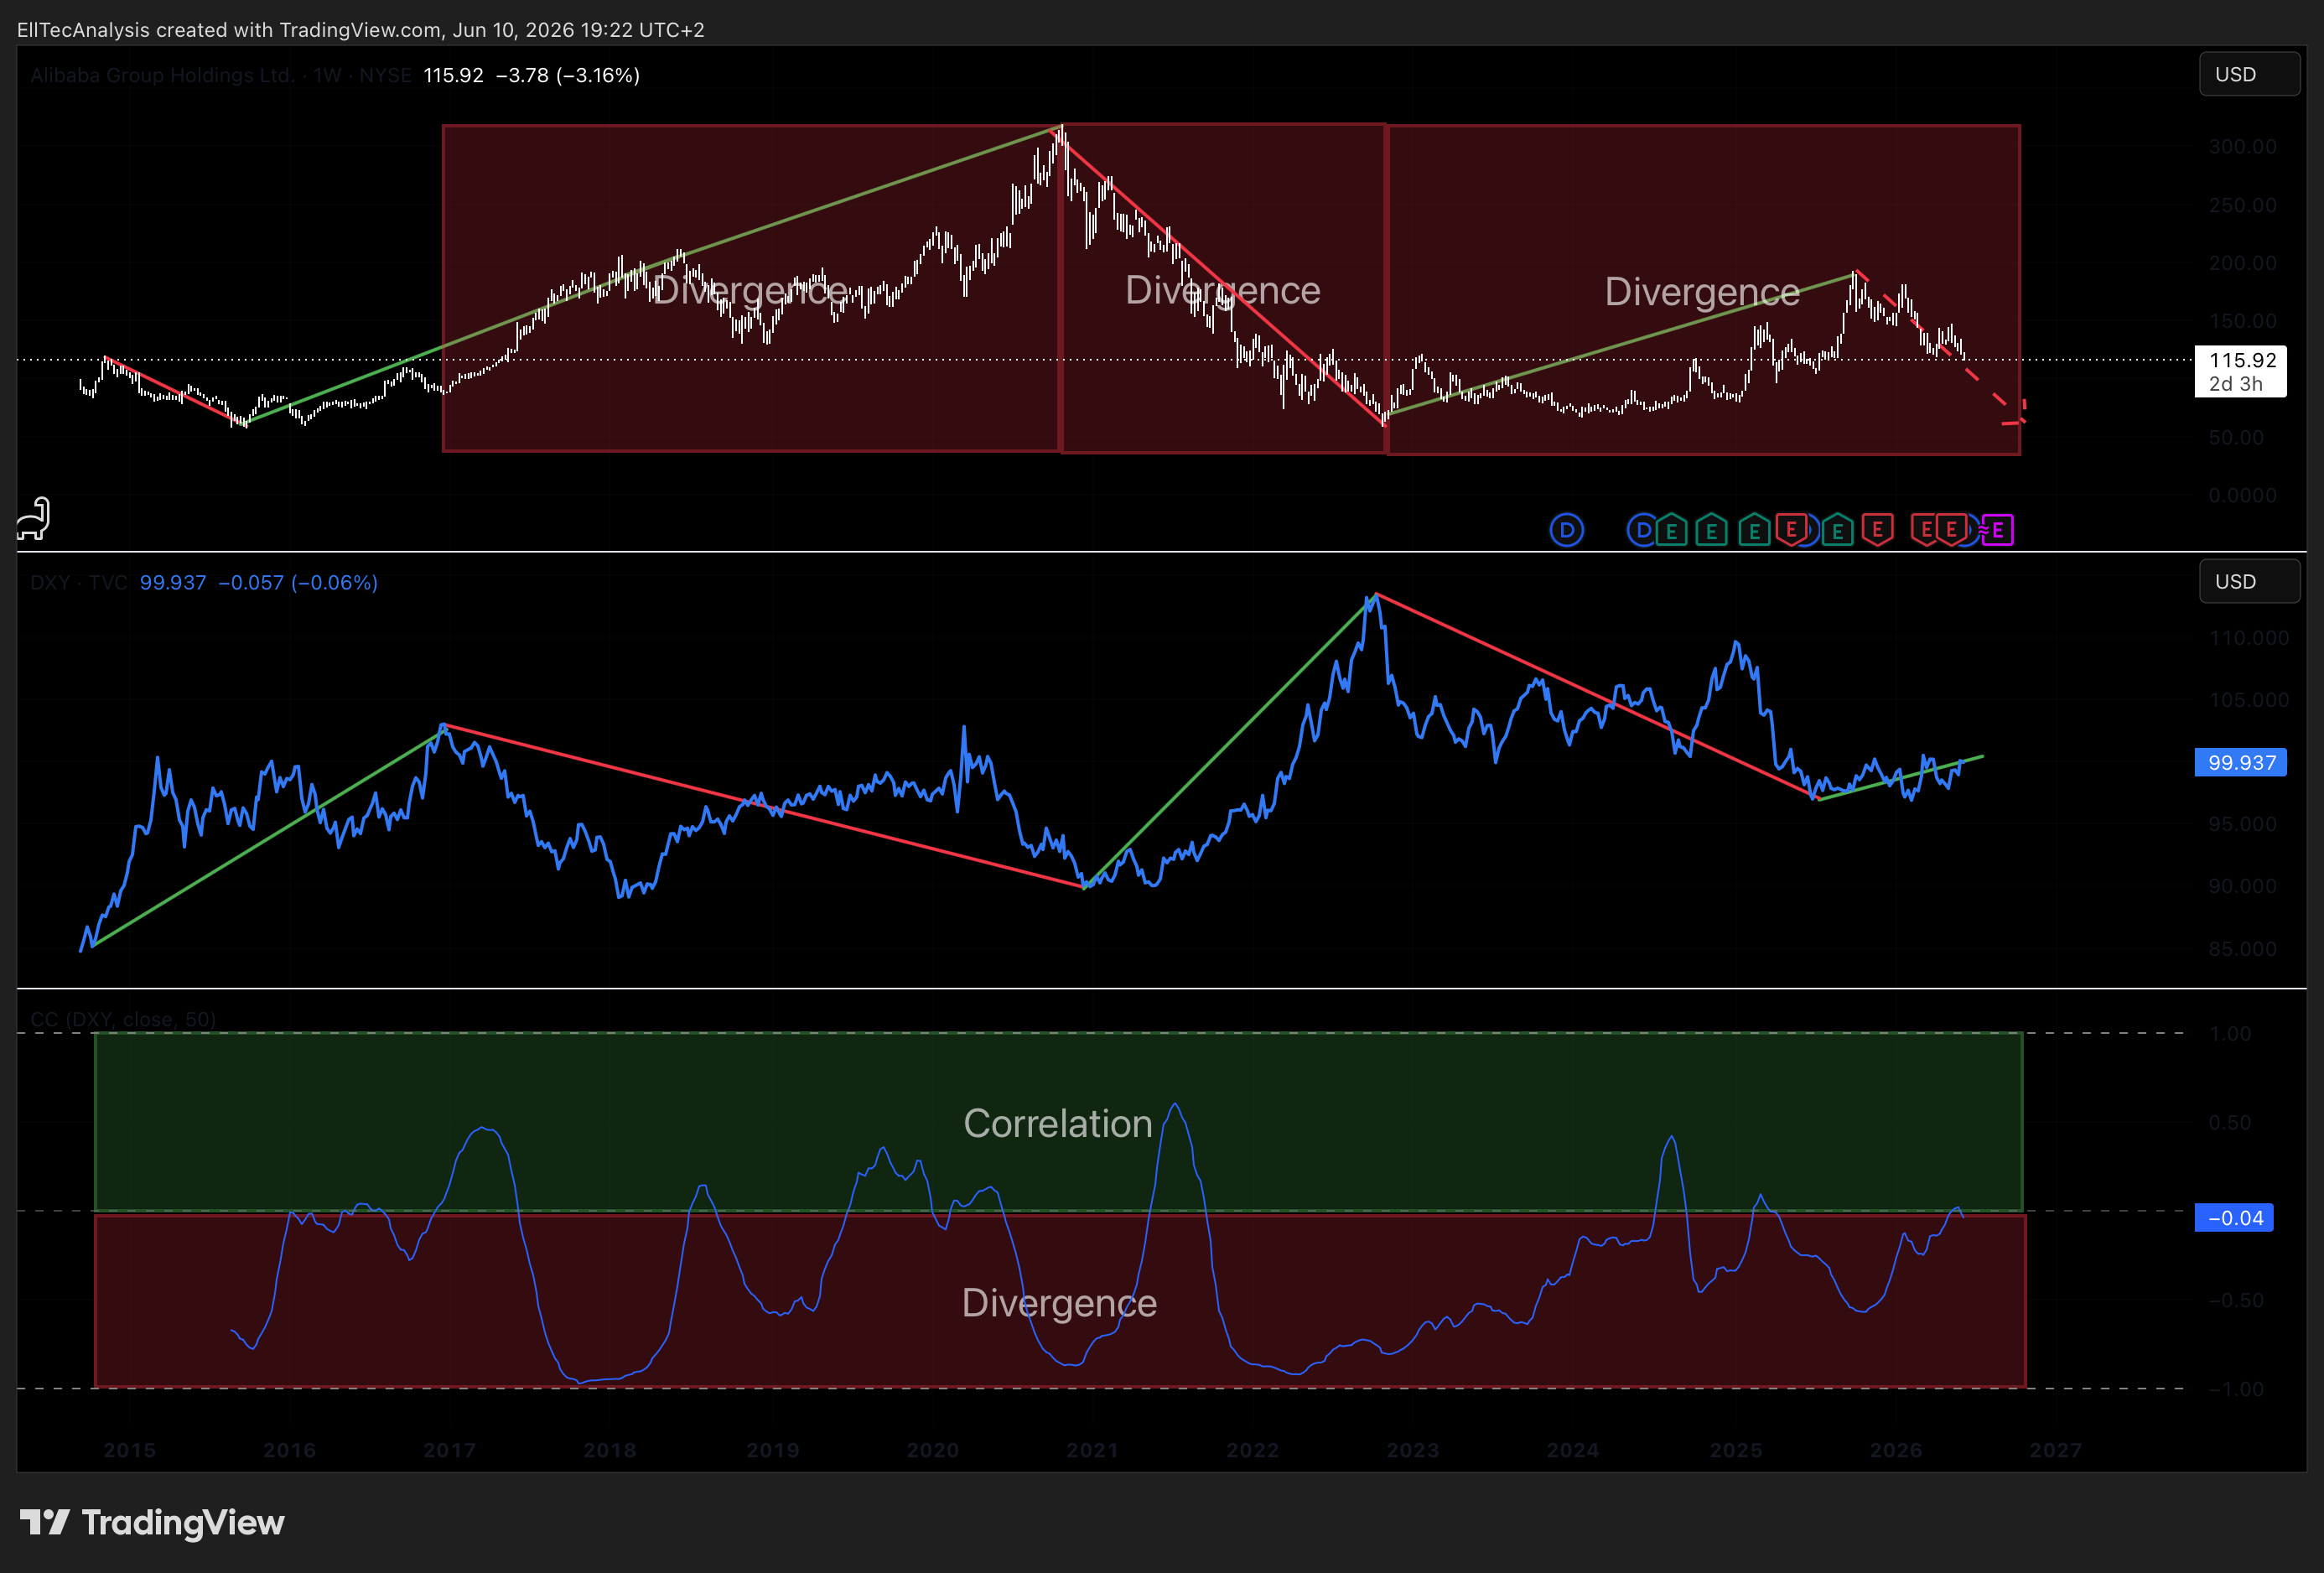
The relationship between BABA and the DXY is consistently inverse over medium and long timeframes. A strengthening dollar tightens global financial conditions, compresses capital flows to emerging markets, and adds pressure on CNY (Chinese Yuan) and HKD (Hong Kong Dollar) denominated earnings when translated to USD for reporting purposes. The dollar’s trajectory therefore functions as a macro transmission mechanism that amplifies or dampens the underlying business performance in the eyes of international investors. Dollar weakness, particularly driven by Fed easing cycles, has historically coincided with strong performance phases for Chinese equities.
Weak USD → risk on for BABA
Strong USD → risk off for BABA
Chinese Money Supply (M2)
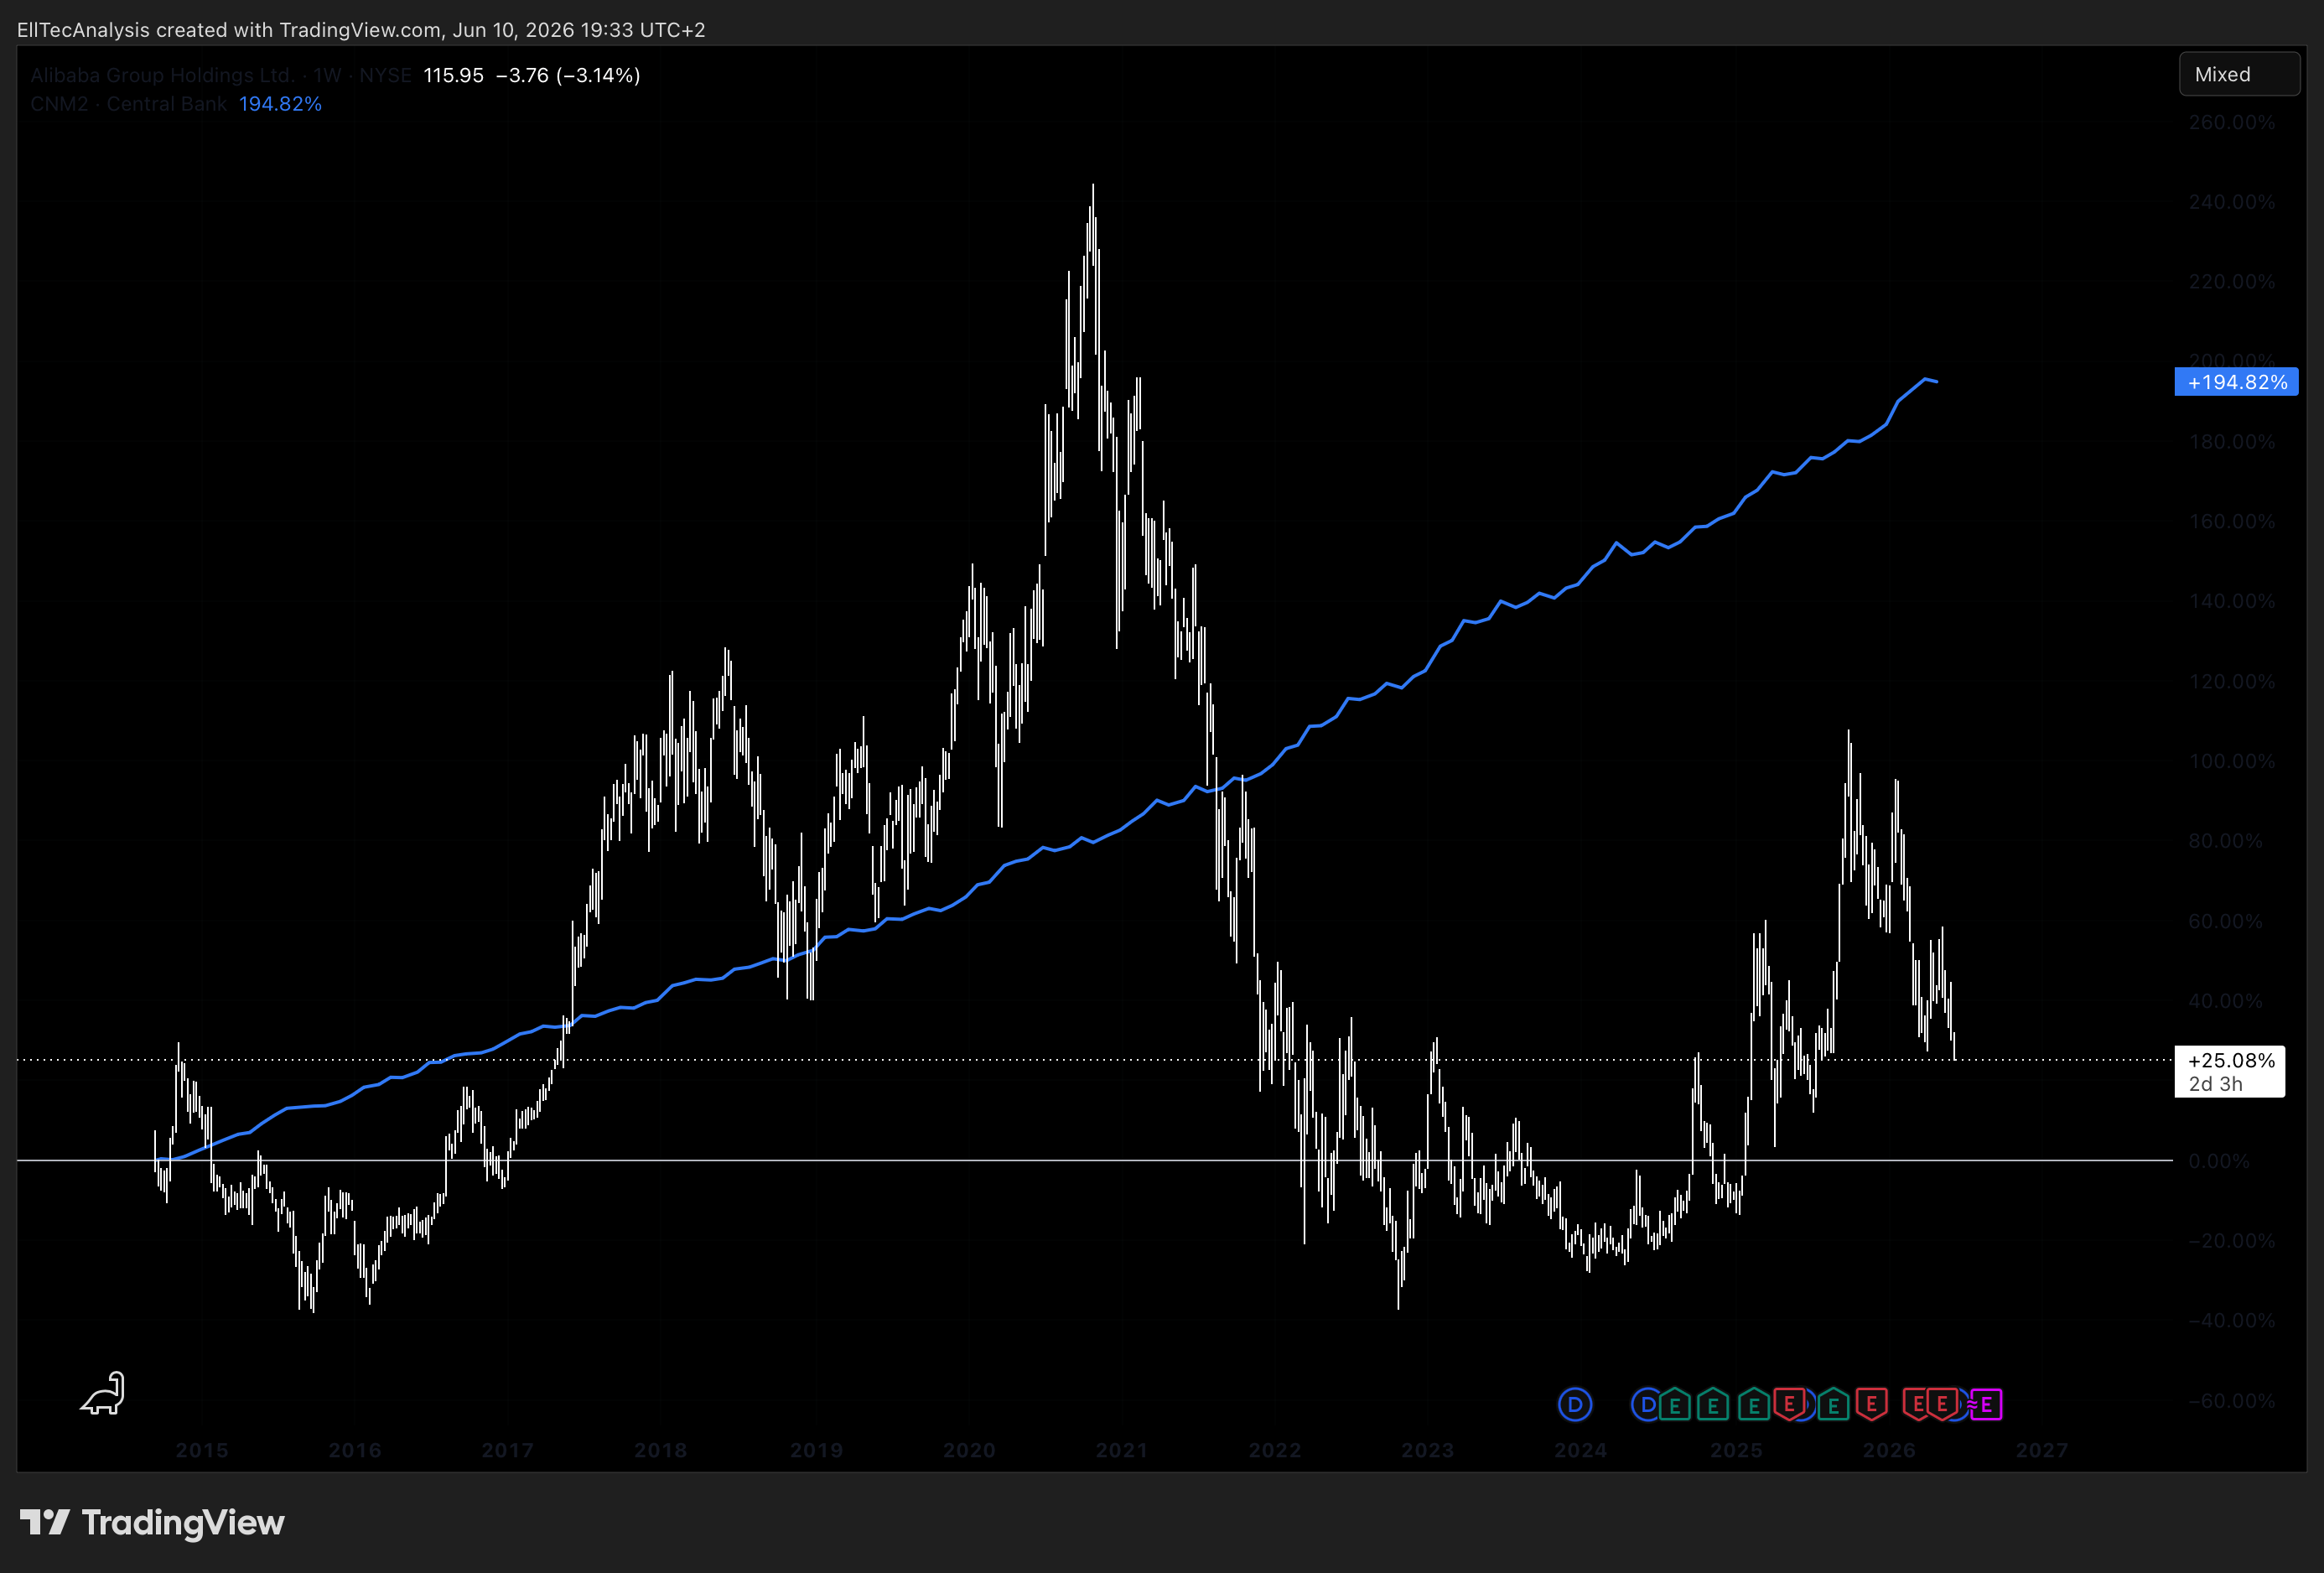
The Chinese money supply (M2) has been rising almost continuously, and this persistent expansion forms the basic liquidity foundation that allows Alibaba’s share price to grow. As M2 increases, more capital enters the financial system, credit becomes easier, and risk assets tend to re-rate higher.
Because Alibaba’s business depends on consumer spending, merchant activity, and overall economic liquidity, it directly benefits from this monetary expansion.
The stronger and more sustained the rise in China’s money supply, the clearer the link to Alibaba’s potential for growth momentum.
CSI 300 Index (Mainland China Equities)
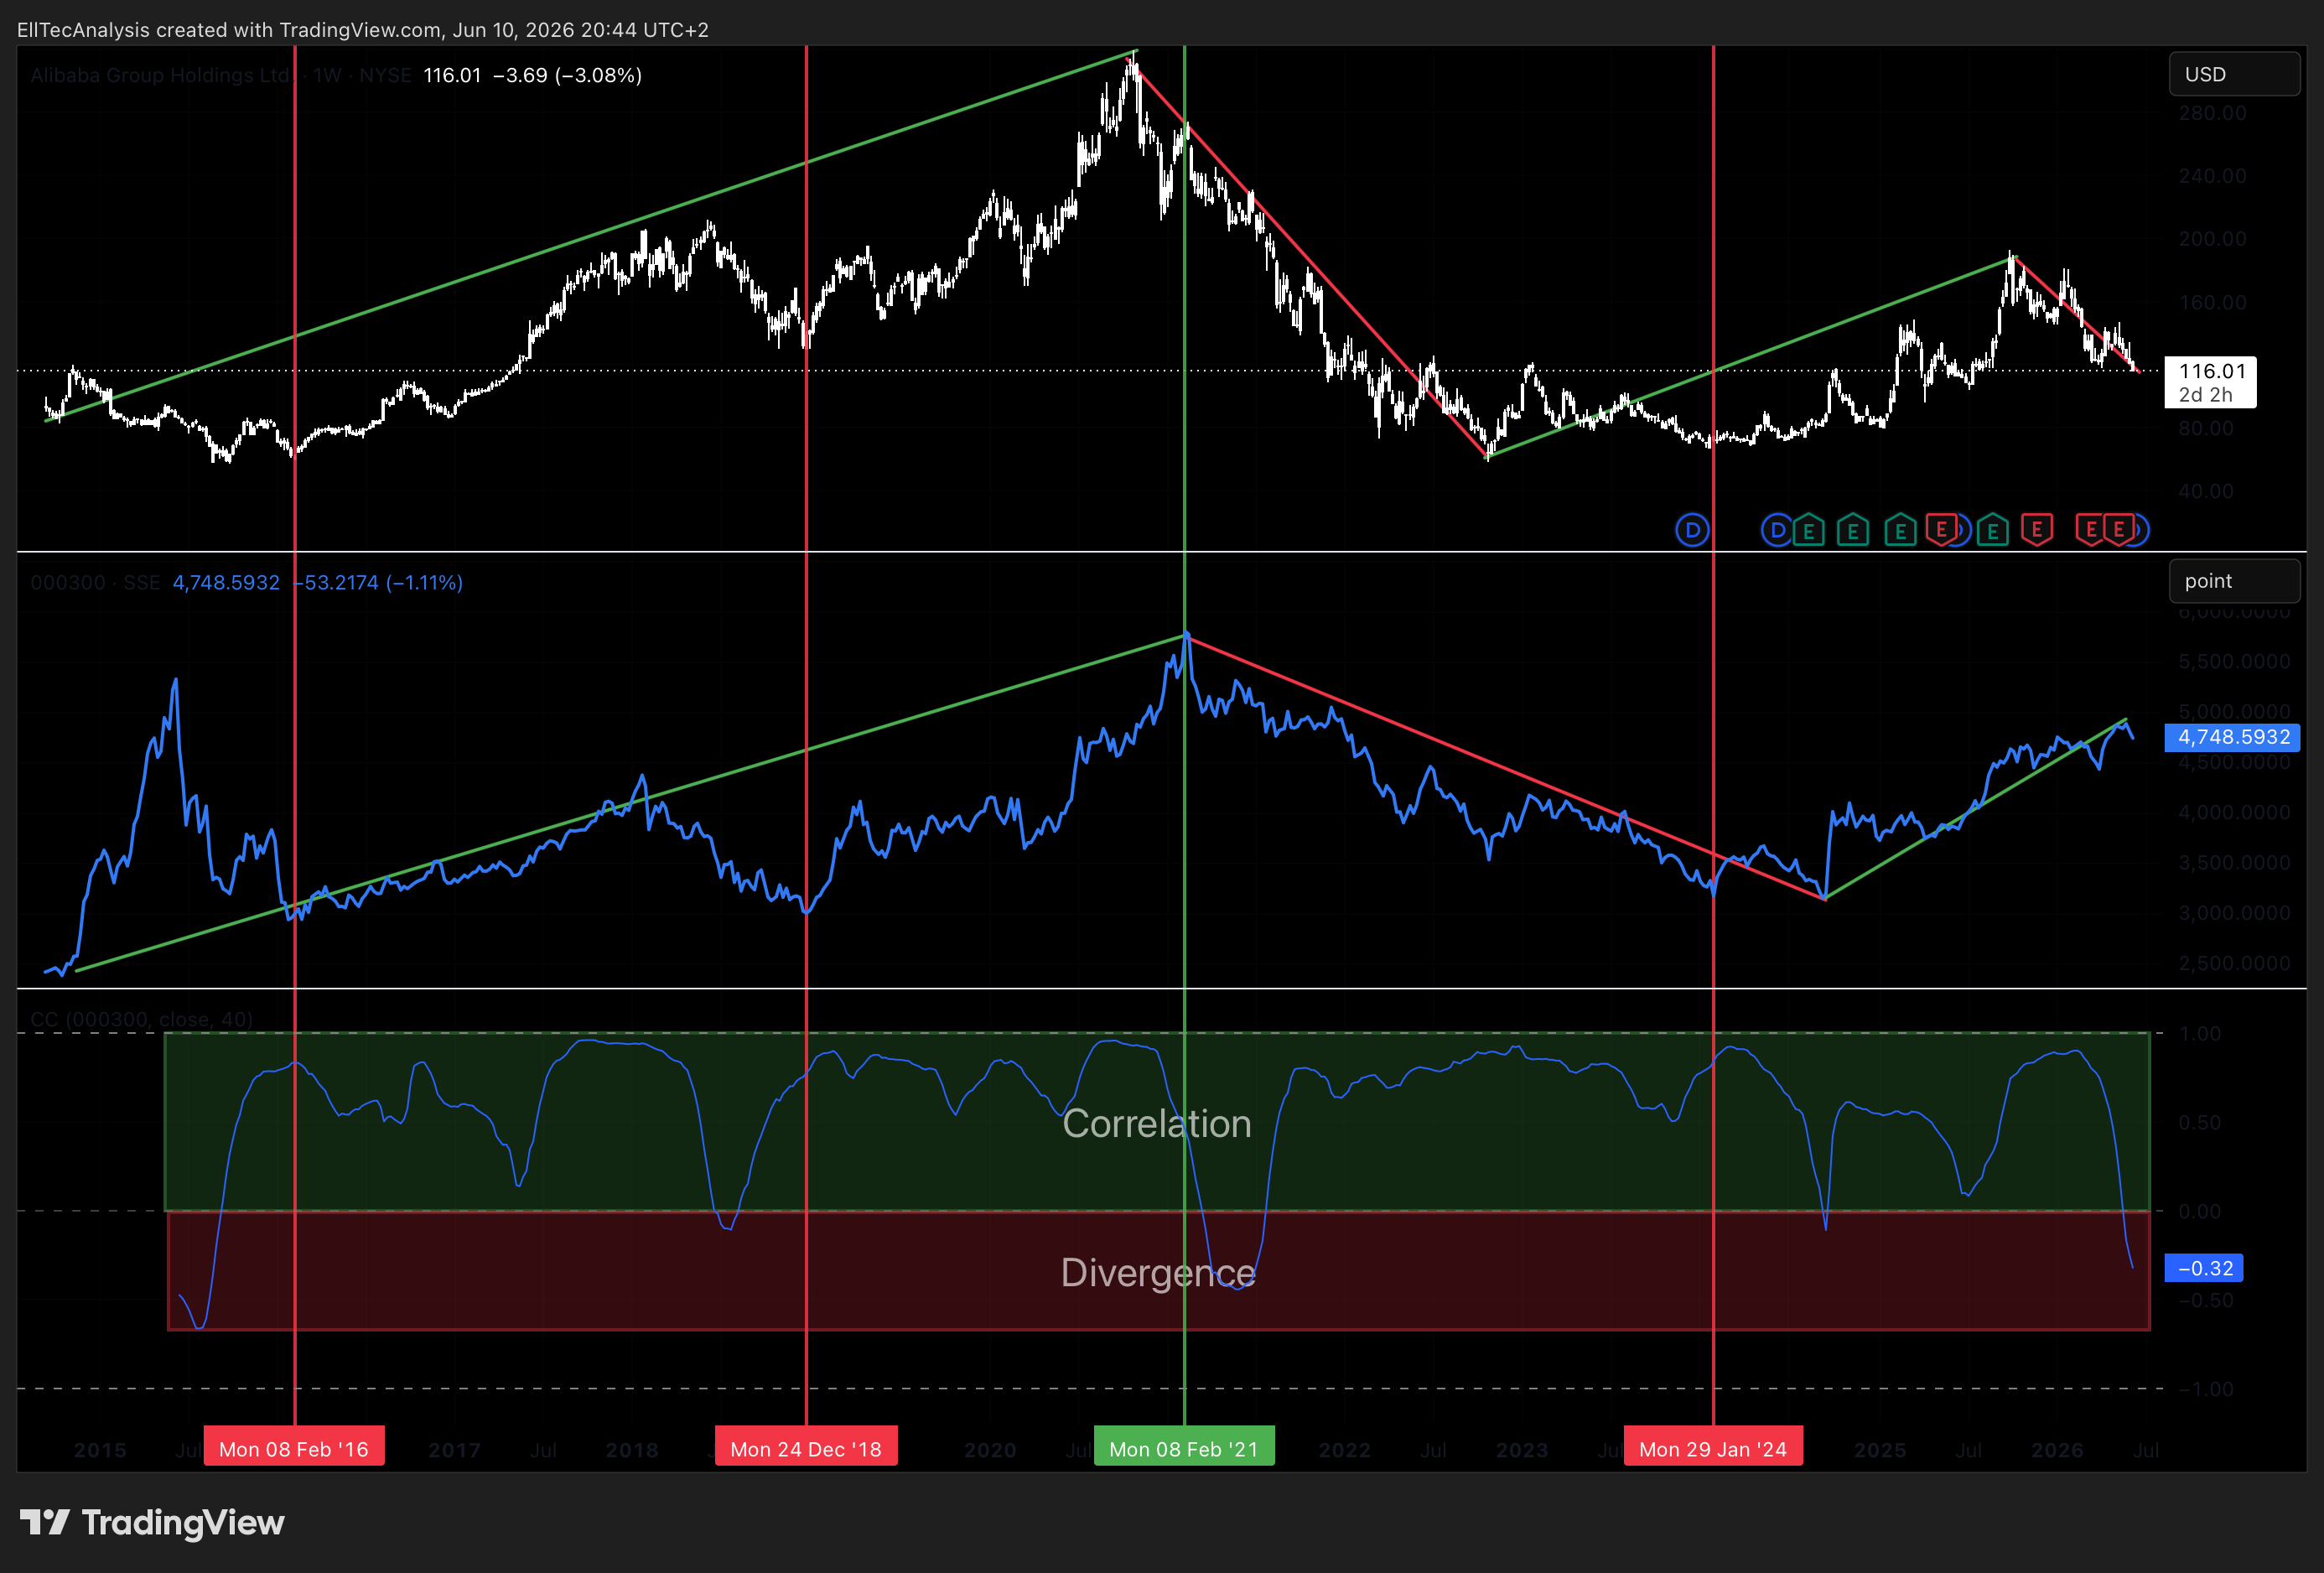
As a proxy for the broader Chinese equity market and domestic institutional sentiment, the CSI 300 provides a structural correlation anchor for BABA that complements the HSI relationship. While the correlation is not always tight on shorter timeframes, Alibaba’s offshore listing structure creates pricing differences driven by southbound flows and offshore risk premiums, the two series tend to converge over quarterly and annual horizons, making the CSI 300 a relevant leading indicator for cycle-level positioning.
3. Seasonality
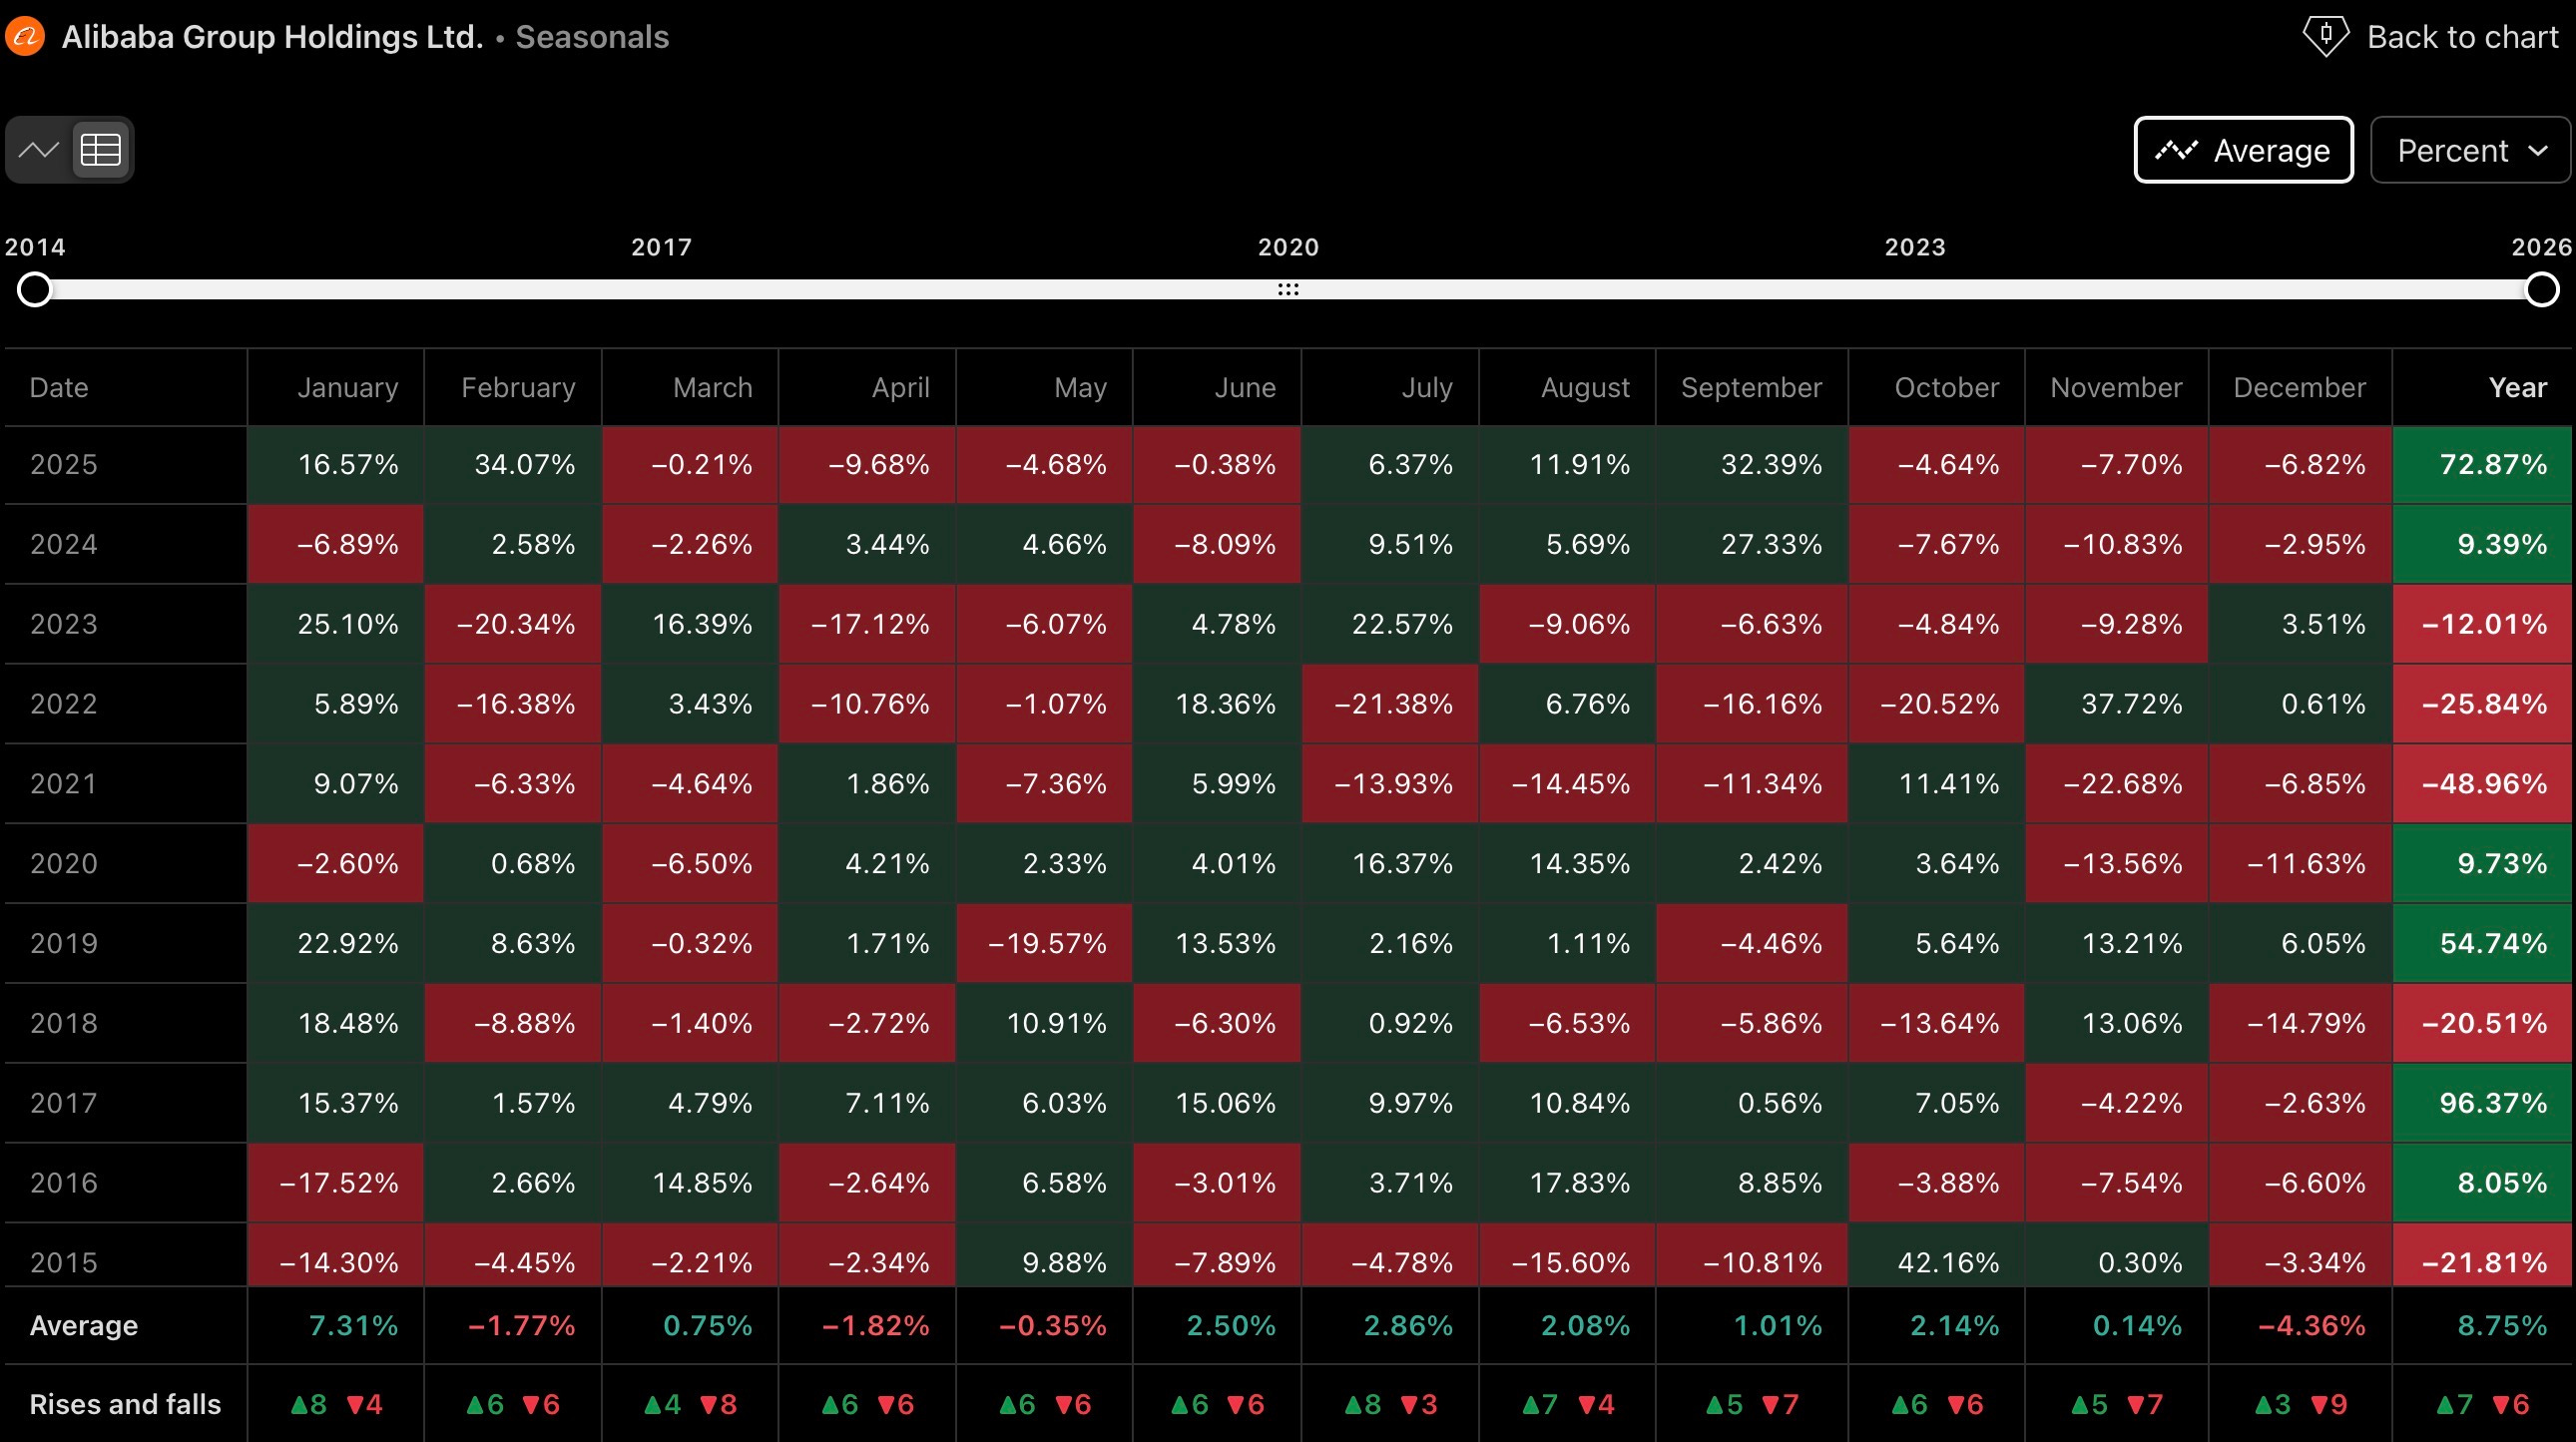
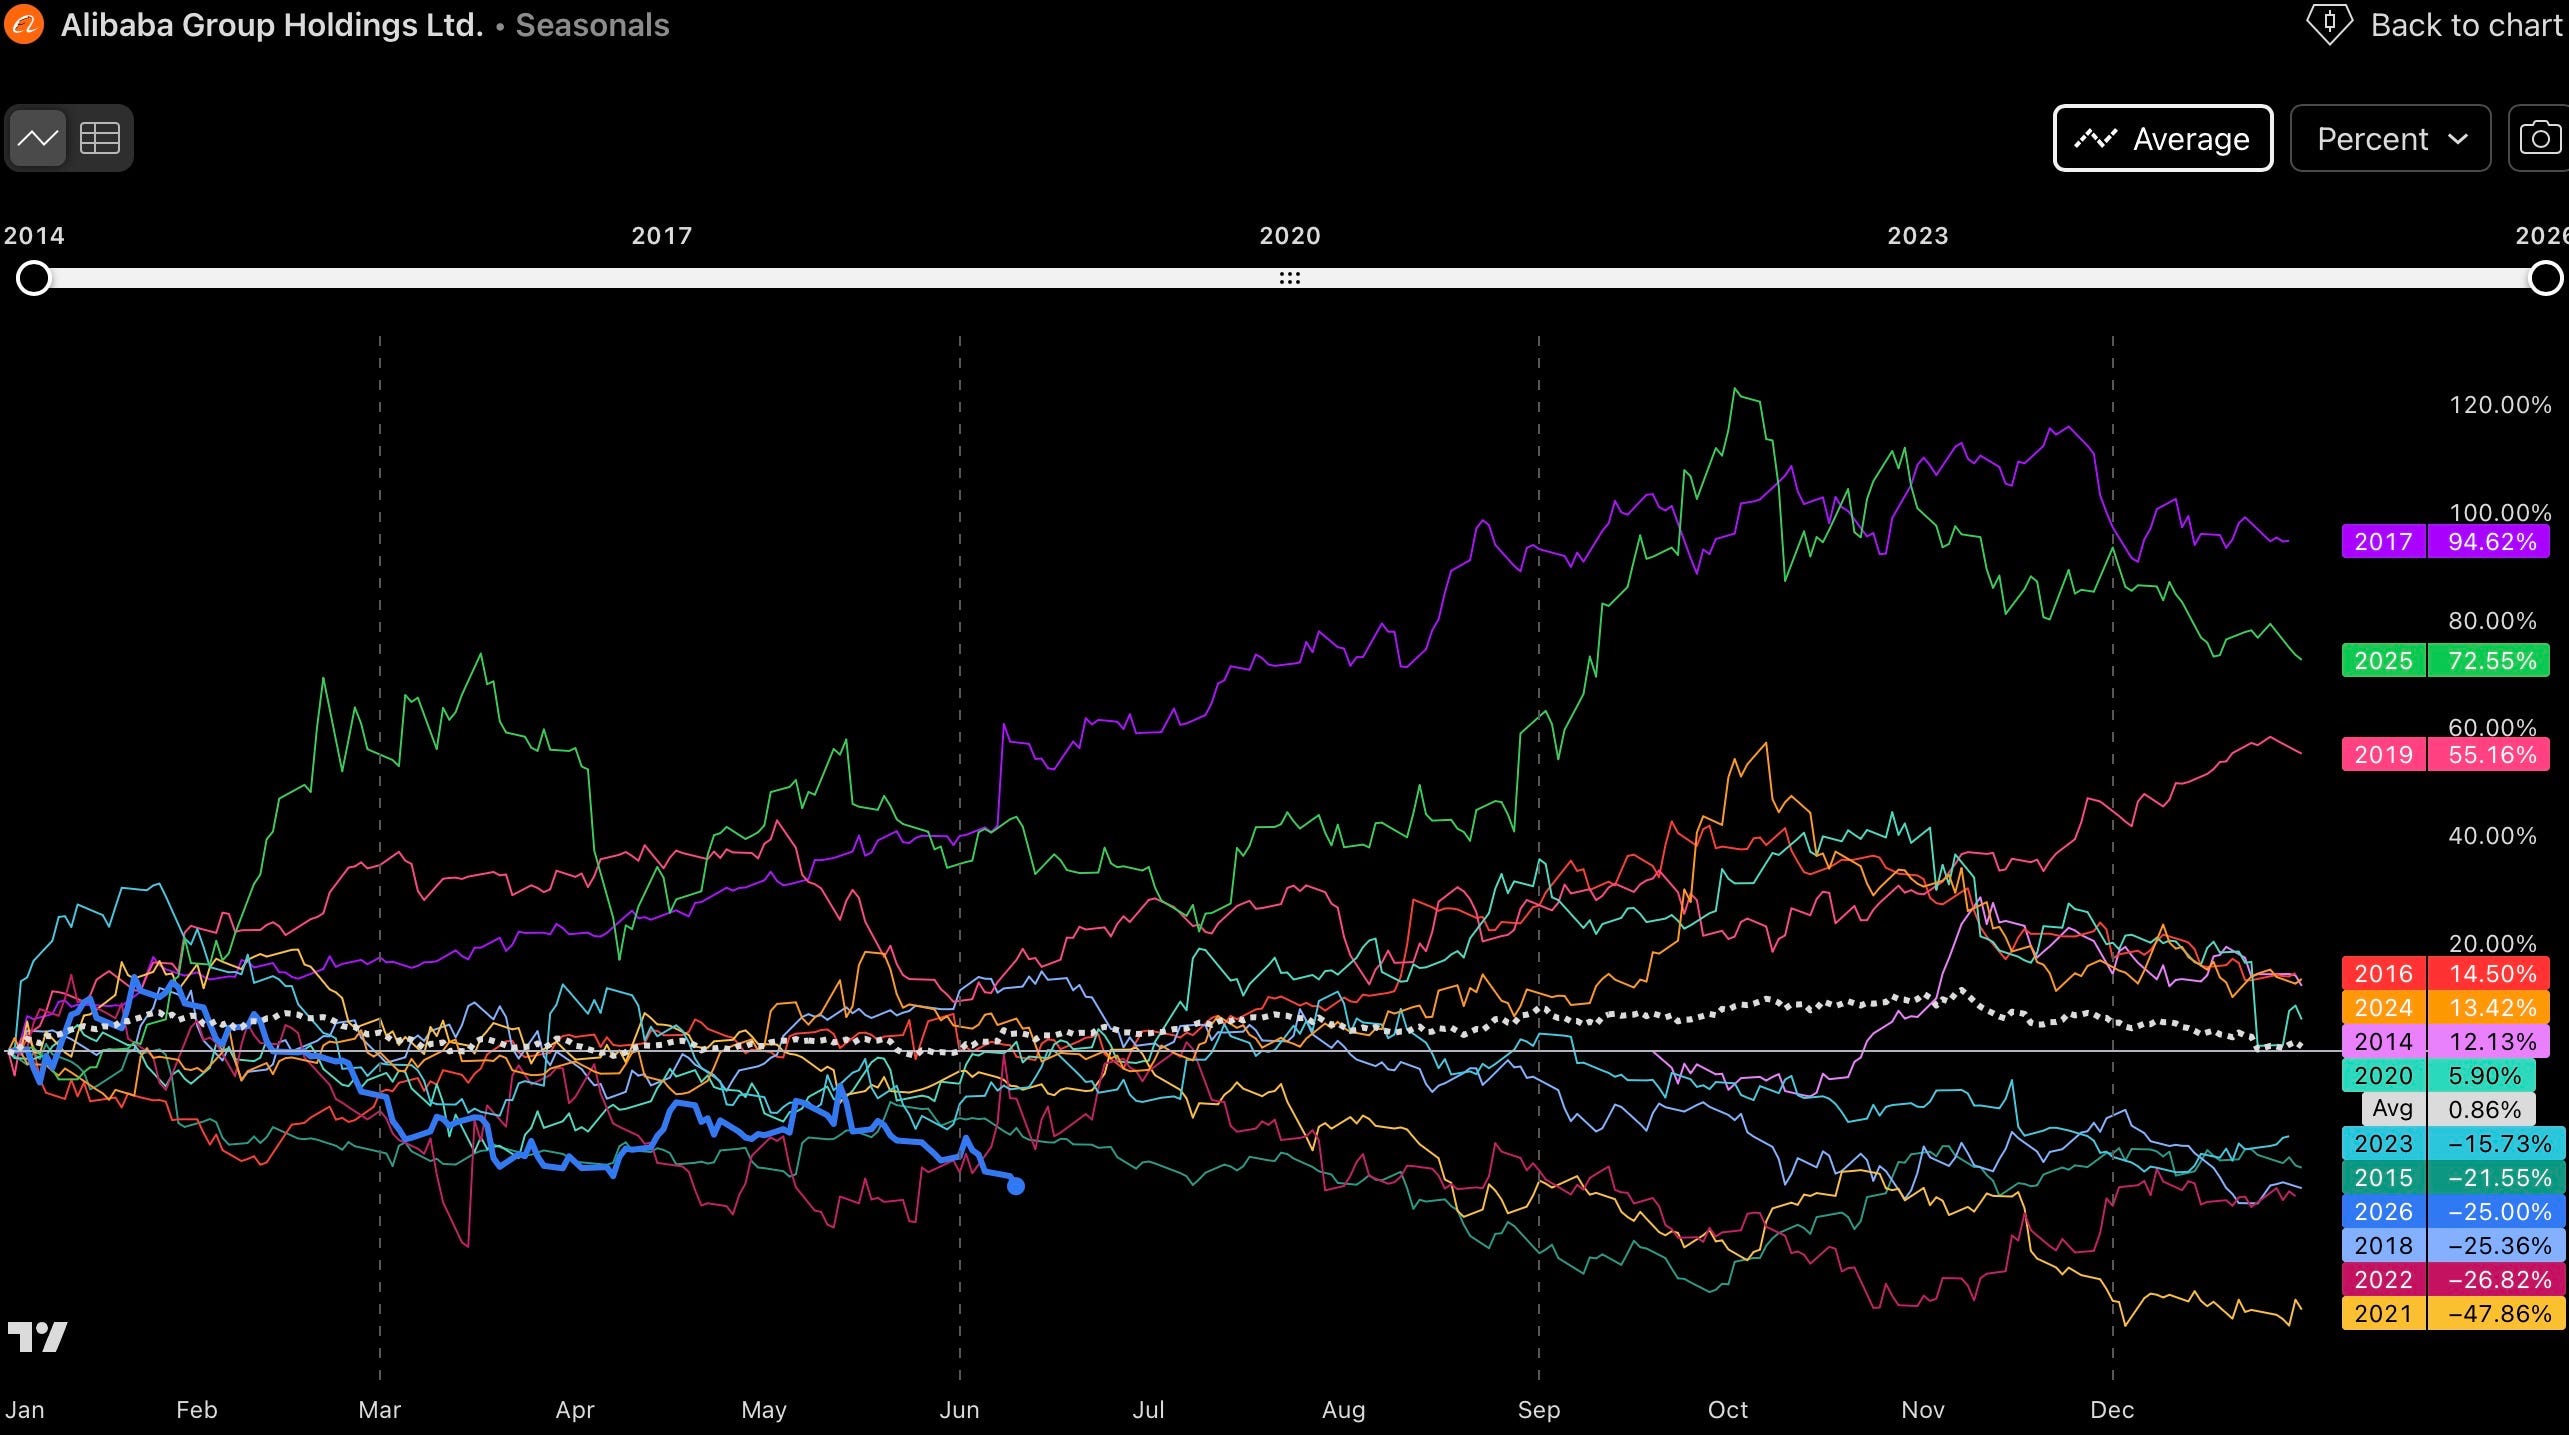
Alibaba’s historical monthly return profile presents a seasonality pattern that carries limited directional authority in the current structural context, but is nonetheless worth noting as a secondary input.
The data reveals a general division between a weaker first-half profile and a stronger performance window running from June through November, where average monthly returns are uniformly positive. December stands out as the single weakest calendar month across the full data history, with an average return of -4.36% and a rise-to-fall ratio of three wins against nine losses, the most unfavourable monthly profile in the dataset. This is then followed by a sharp seasonal reversal in January, which shows an average return of +7.31%*and a rise-to-fall ratio of eight wins against four losses, suggesting that December weakness has historically represented a short-duration capitulation event rather than the beginning of a sustained decline.
Intermediate months with notably weaker average profiles include February, April, and May, which soften the otherwise constructive picture for the first half of the year. The June through November window, by contrast, represents a period of structurally positive seasonal momentum that could, in isolation, be used to argue for the primary bull case already being in motion.
However, as is frequently the case with seasonality analysis applied to individual equities with irregular news flows, regulatory overhangs, and macro dependencies, the pattern here does not carry sufficient statistical weight to meaningfully influence the structural Elliott Wave framework. The June to November strength window does favour Scenario 1 and Scenario 2 over the primary count in a narrow seasonal interpretation, but the wave structure and the Fibonacci architecture of the correction take precedence. What the seasonality data does usefully support is the hypothesis that a December low, consistent with the primary scenario’s corrective target, would represent a seasonally coherent bottoming environment, followed by a January reversal that historically carries strong average upside.
The correlation structure with the broader Chinese index, covered in a separate EllTec Analysis piece linked below, provides additional structural context that reinforces the primary scenario, and that macro-level analysis should be considered in conjunction with the individual wave count presented here.
