

Baidu
The Sleeping Giant of Chinese AI

NASDAQ: BIDU

SECTION 01
Fundamentals
Baidu, Inc. is China’s dominant internet and artificial intelligence company, trading on the NASDAQ under the ticker BIDU and on the Hong Kong Stock Exchange as 9888. Founded in 2000 by Robin Li and Eric Xu, and often called the “Google of China,” Baidu built its empire on search engine dominance across the world’s largest internet population. That foundation, however, is now secondary to what Baidu has become: a full-stack AI infrastructure company with meaningful positions in cloud computing, large language models, and autonomous mobility. The company operates in two reporting segments, Baidu General Business and iQIYI, the latter being its video streaming subsidiary. Within the core business, three growth engines define the investment thesis: mobile ecosystem monetisation through AI-enhanced search, AI Cloud infrastructure, and Apollo Go, the company’s robotaxi and autonomous driving platform.
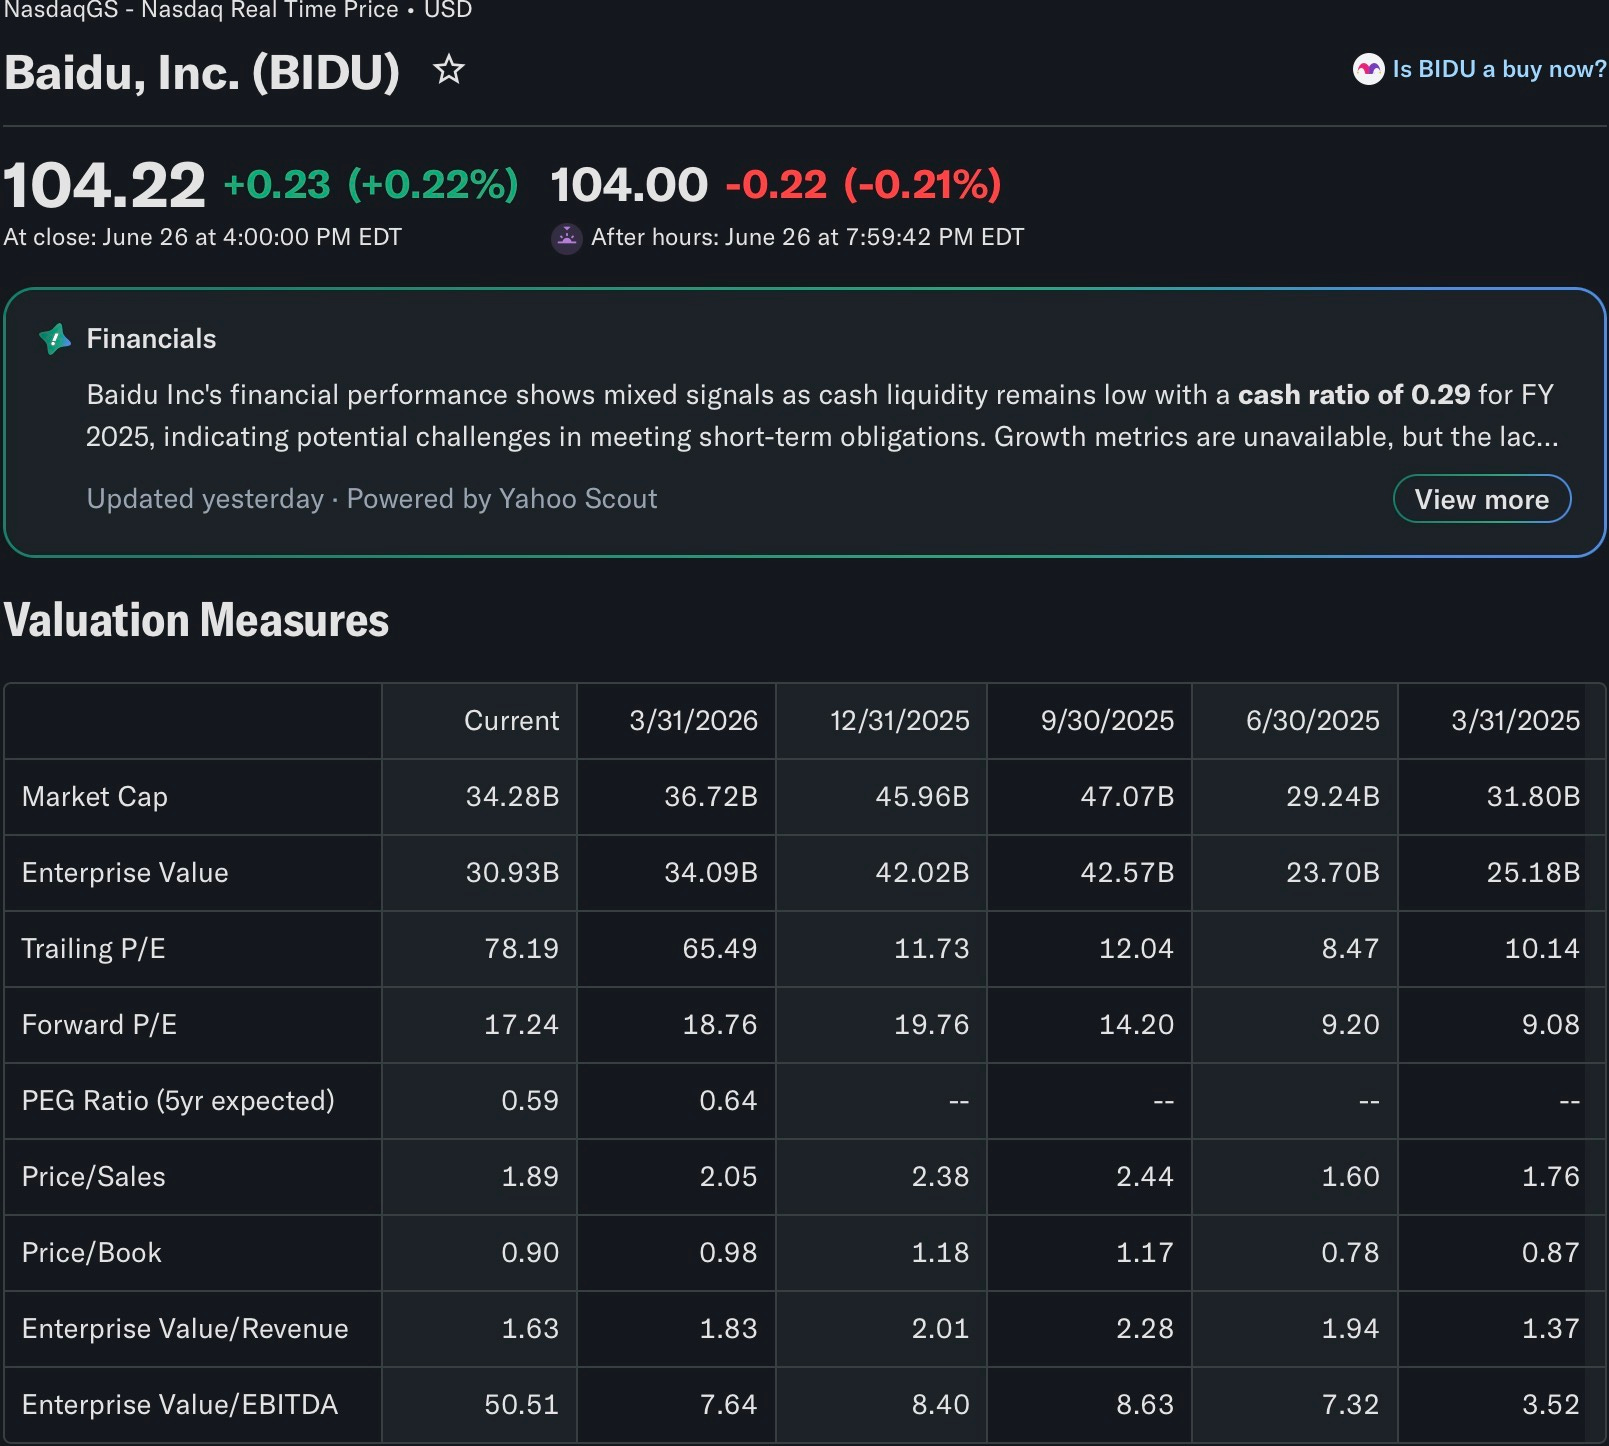
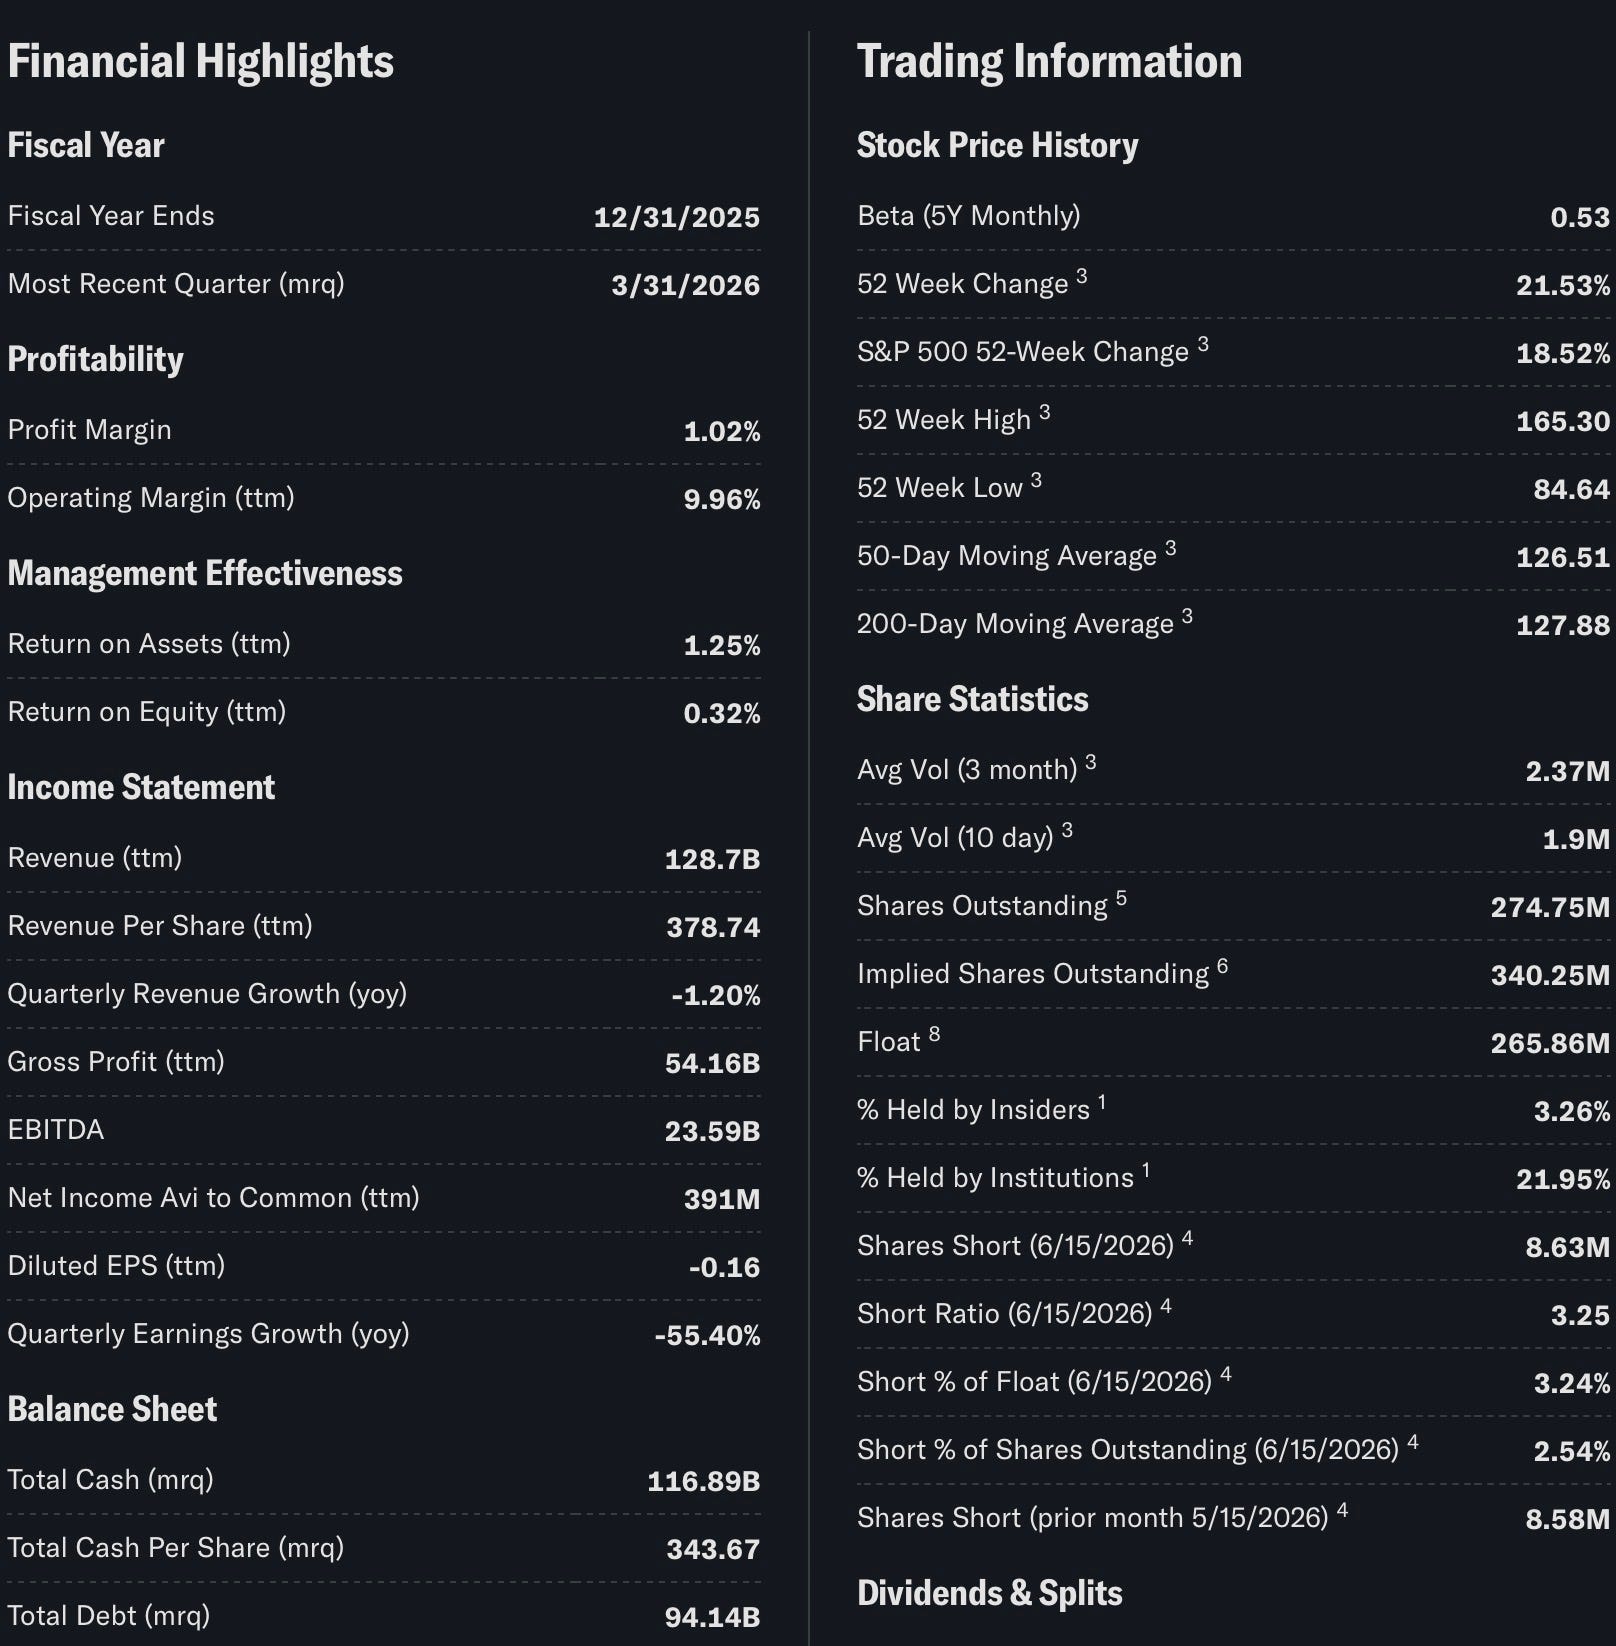
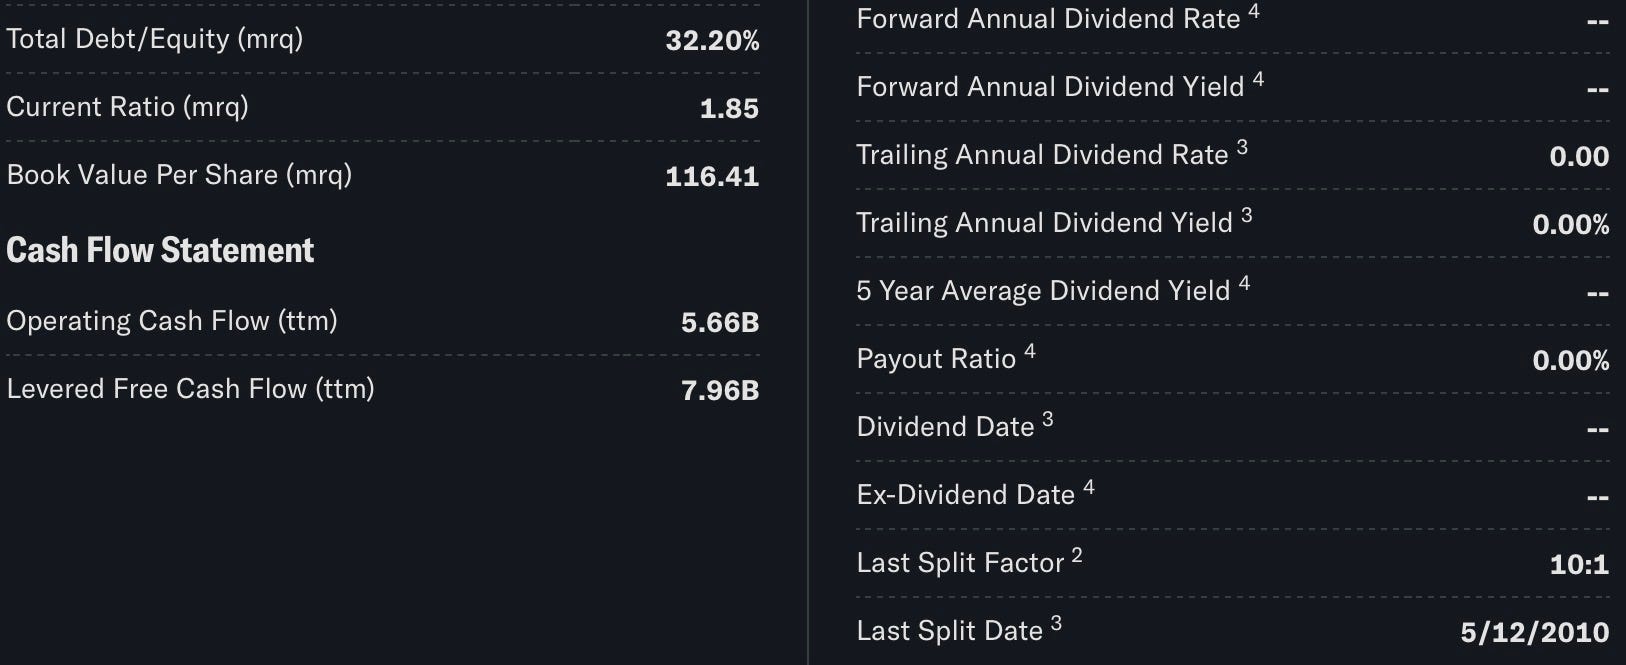
Baidu Core revenue grew 7% year over year in the first quarter of 2025, driven by AI Cloud, which surged 42% over the same period. By the full year, the picture clarified further: AI Cloud infrastructure revenue reached approximately RMB 20 billion in 2025, up 34% year-over-year, outpacing industry growth, with subscription-based revenue from AI accelerator infrastructure growing 143% year-over-year in Q4. AI Cloud infrastructure and AI applications combined reached RMB 30 billion in revenue for the full year, and revenue from AI applications alone exceeded RMB 10 billion. The headline revenue line tells a more complicated story: full year 2025 total revenue was RMB 129.1 billion, decreasing 3% year-over-year, primarily due to contraction in legacy online advertising, partially offset by the rise in AI-powered core revenue. Legacy advertising, once the engine of Baidu’s profitability, is in secular decline, squeezed by a weaker Chinese macro backdrop and competition from short-video platforms. Yet this compression of the old business is occurring precisely as the new business reaches meaningful scale, creating a transitional distortion that tends to suppress valuation multiples even as the underlying quality of the earnings mix improves.
Apollo Go is the wildcard that most models fail to price adequately. The service delivered 3.4 million fully driverless operational rides in Q4 2025 alone, with weekly rides peaking at over 300,000, and total rides increasing by over 200% year-over-year. The international expansion adds a further dimension: from 2025, the strategy shifted toward global deployment through a multi-year partnership with Uber announced in July 2025 to deploy thousands of Apollo Go vehicles on its platform, followed by a specific deployment in Dubai in February 2026 and a partnership with Lyft in August 2025 targeting Germany and the UK for a 2026 launch. As of October 2025, Apollo Go’s global footprint covered 22 cities, and in mainland China, the service achieved 100% fully driverless operations in all cities of operation, with fleets accumulating 240 million autonomous kilometres in total. On the AI model side, Baidu unveiled ERNIE 5.0 at Baidu World 2025, described as a natively omni-modal foundation model handling text, images, audio, and video jointly, with approximately 2.4 trillion parameters designed for advanced multimodal understanding, creative generation, and complex reasoning tasks.
The macro context for BIDU is bifurcated. Domestically, China’s AI buildout is accelerating under state guidance, and Baidu’s full-stack position spanning chips, models, cloud infrastructure, and applications makes it one of the primary beneficiaries of that capital allocation. The company has also announced a new USD 5 billion share repurchase program and a maiden dividend policy, both signals of management’s confidence in the balance sheet and long-term trajectory. Internationally, geopolitical headwinds remain a persistent discount factor. With relations between the U.S. and China becoming increasingly adversarial, BIDU faces risks related to unfavourable geopolitical trends, including the risk of ADR delisting from the NASDAQ. Baidu, like other U.S.-listed Chinese companies, operates through a VIE structure, which relies on contractual arrangements rather than direct equity ownership, leaving foreign investors without the rights to residual profits or direct management control that direct equity stakes would otherwise provide. These structural and geopolitical frictions explain why BIDU trades at a deep discount to Western peers of comparable technological scale and why the current price level presents the kind of asymmetric opportunity that only emerges when sentiment and structure diverge sharply.
SECTION 02
Correlations
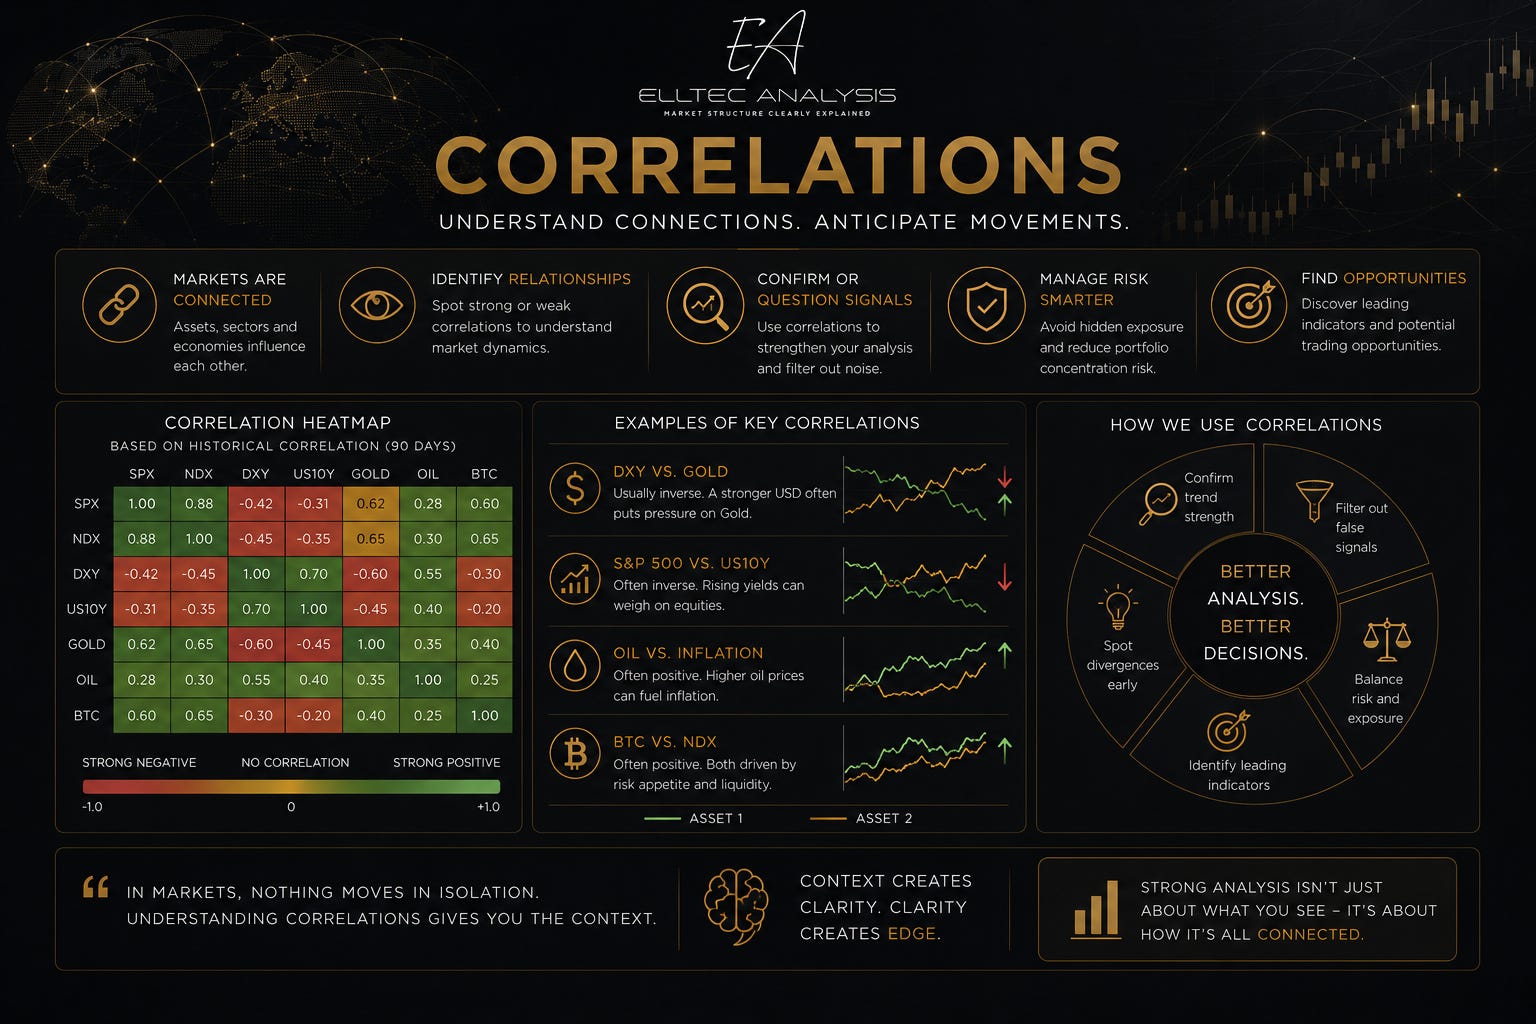
The correlation structure of BIDU is multi-layered and regime-dependent. As a U.S.-listed Chinese ADR operating at the intersection of technology, artificial intelligence, and geopolitics, Baidu responds to a broader and more complex set of macro inputs than most single-country technology names. Understanding which driver dominates at any given moment is essential to contextualising price action.
Global Risk Sentiment (Risk-On / Risk-Off)
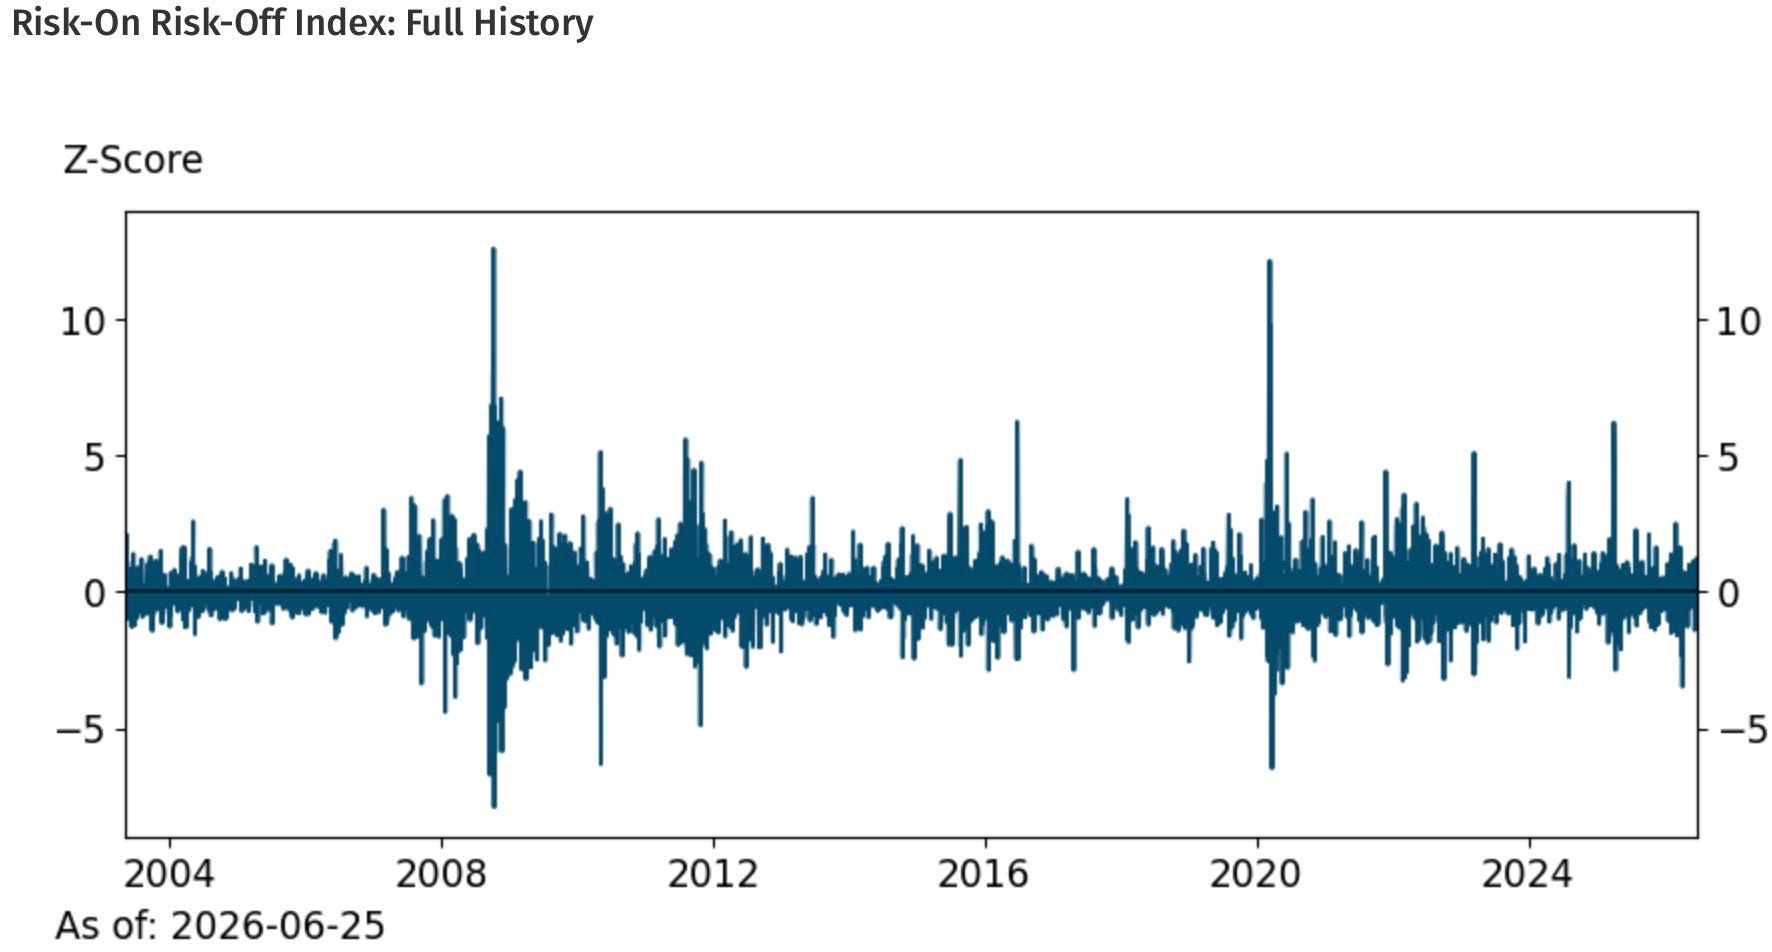
BIDU is deeply embedded in the global risk-on/risk-off cycle. During periods of broad risk appetite, capital flows into high-beta technology and emerging market names, and Baidu benefits disproportionately given its combination of discounted valuation, high growth potential, and speculative interest. Conversely, risk-off episodes triggered by recession fears, credit stress, or geopolitical escalation compress BIDU sharply, often to a degree that exceeds the moves seen in U.S.-listed technology peers. The stock’s beta to global risk sentiment is asymmetric: drawdowns can be severe and fast, while recoveries tend to be gradual and news-driven.
Hang Seng Technology Index (HSTECH) and China Tech Sector
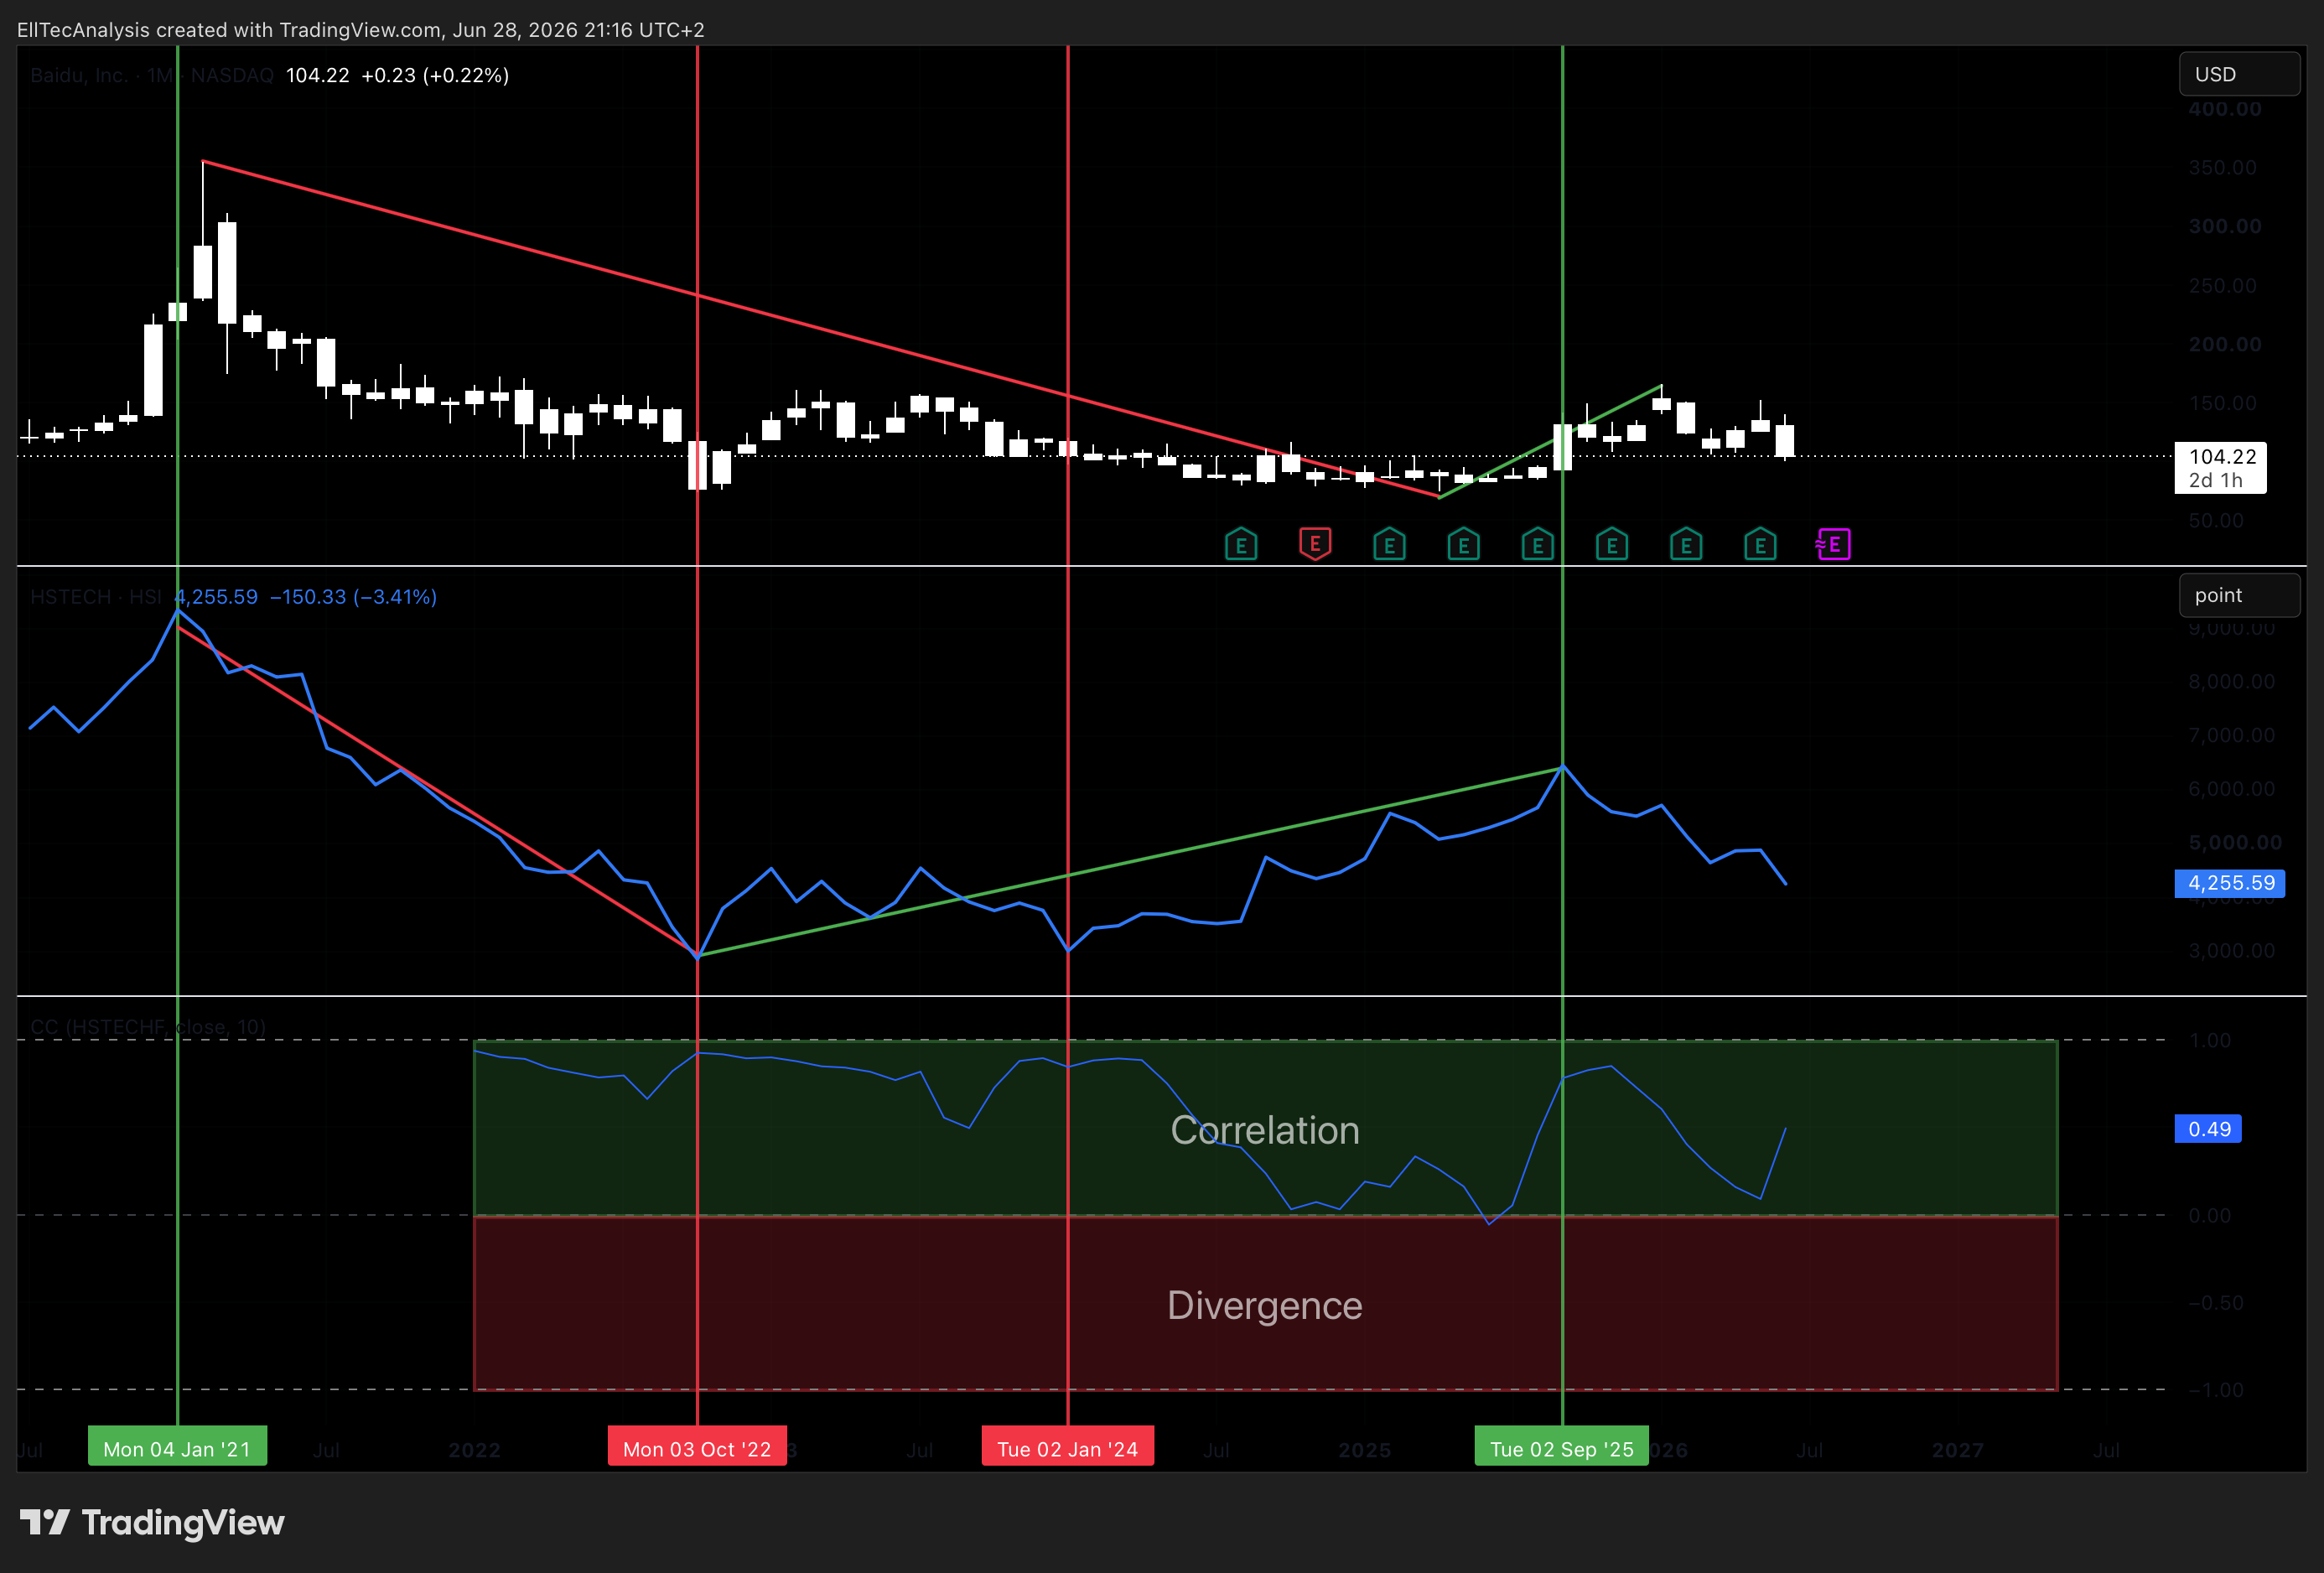
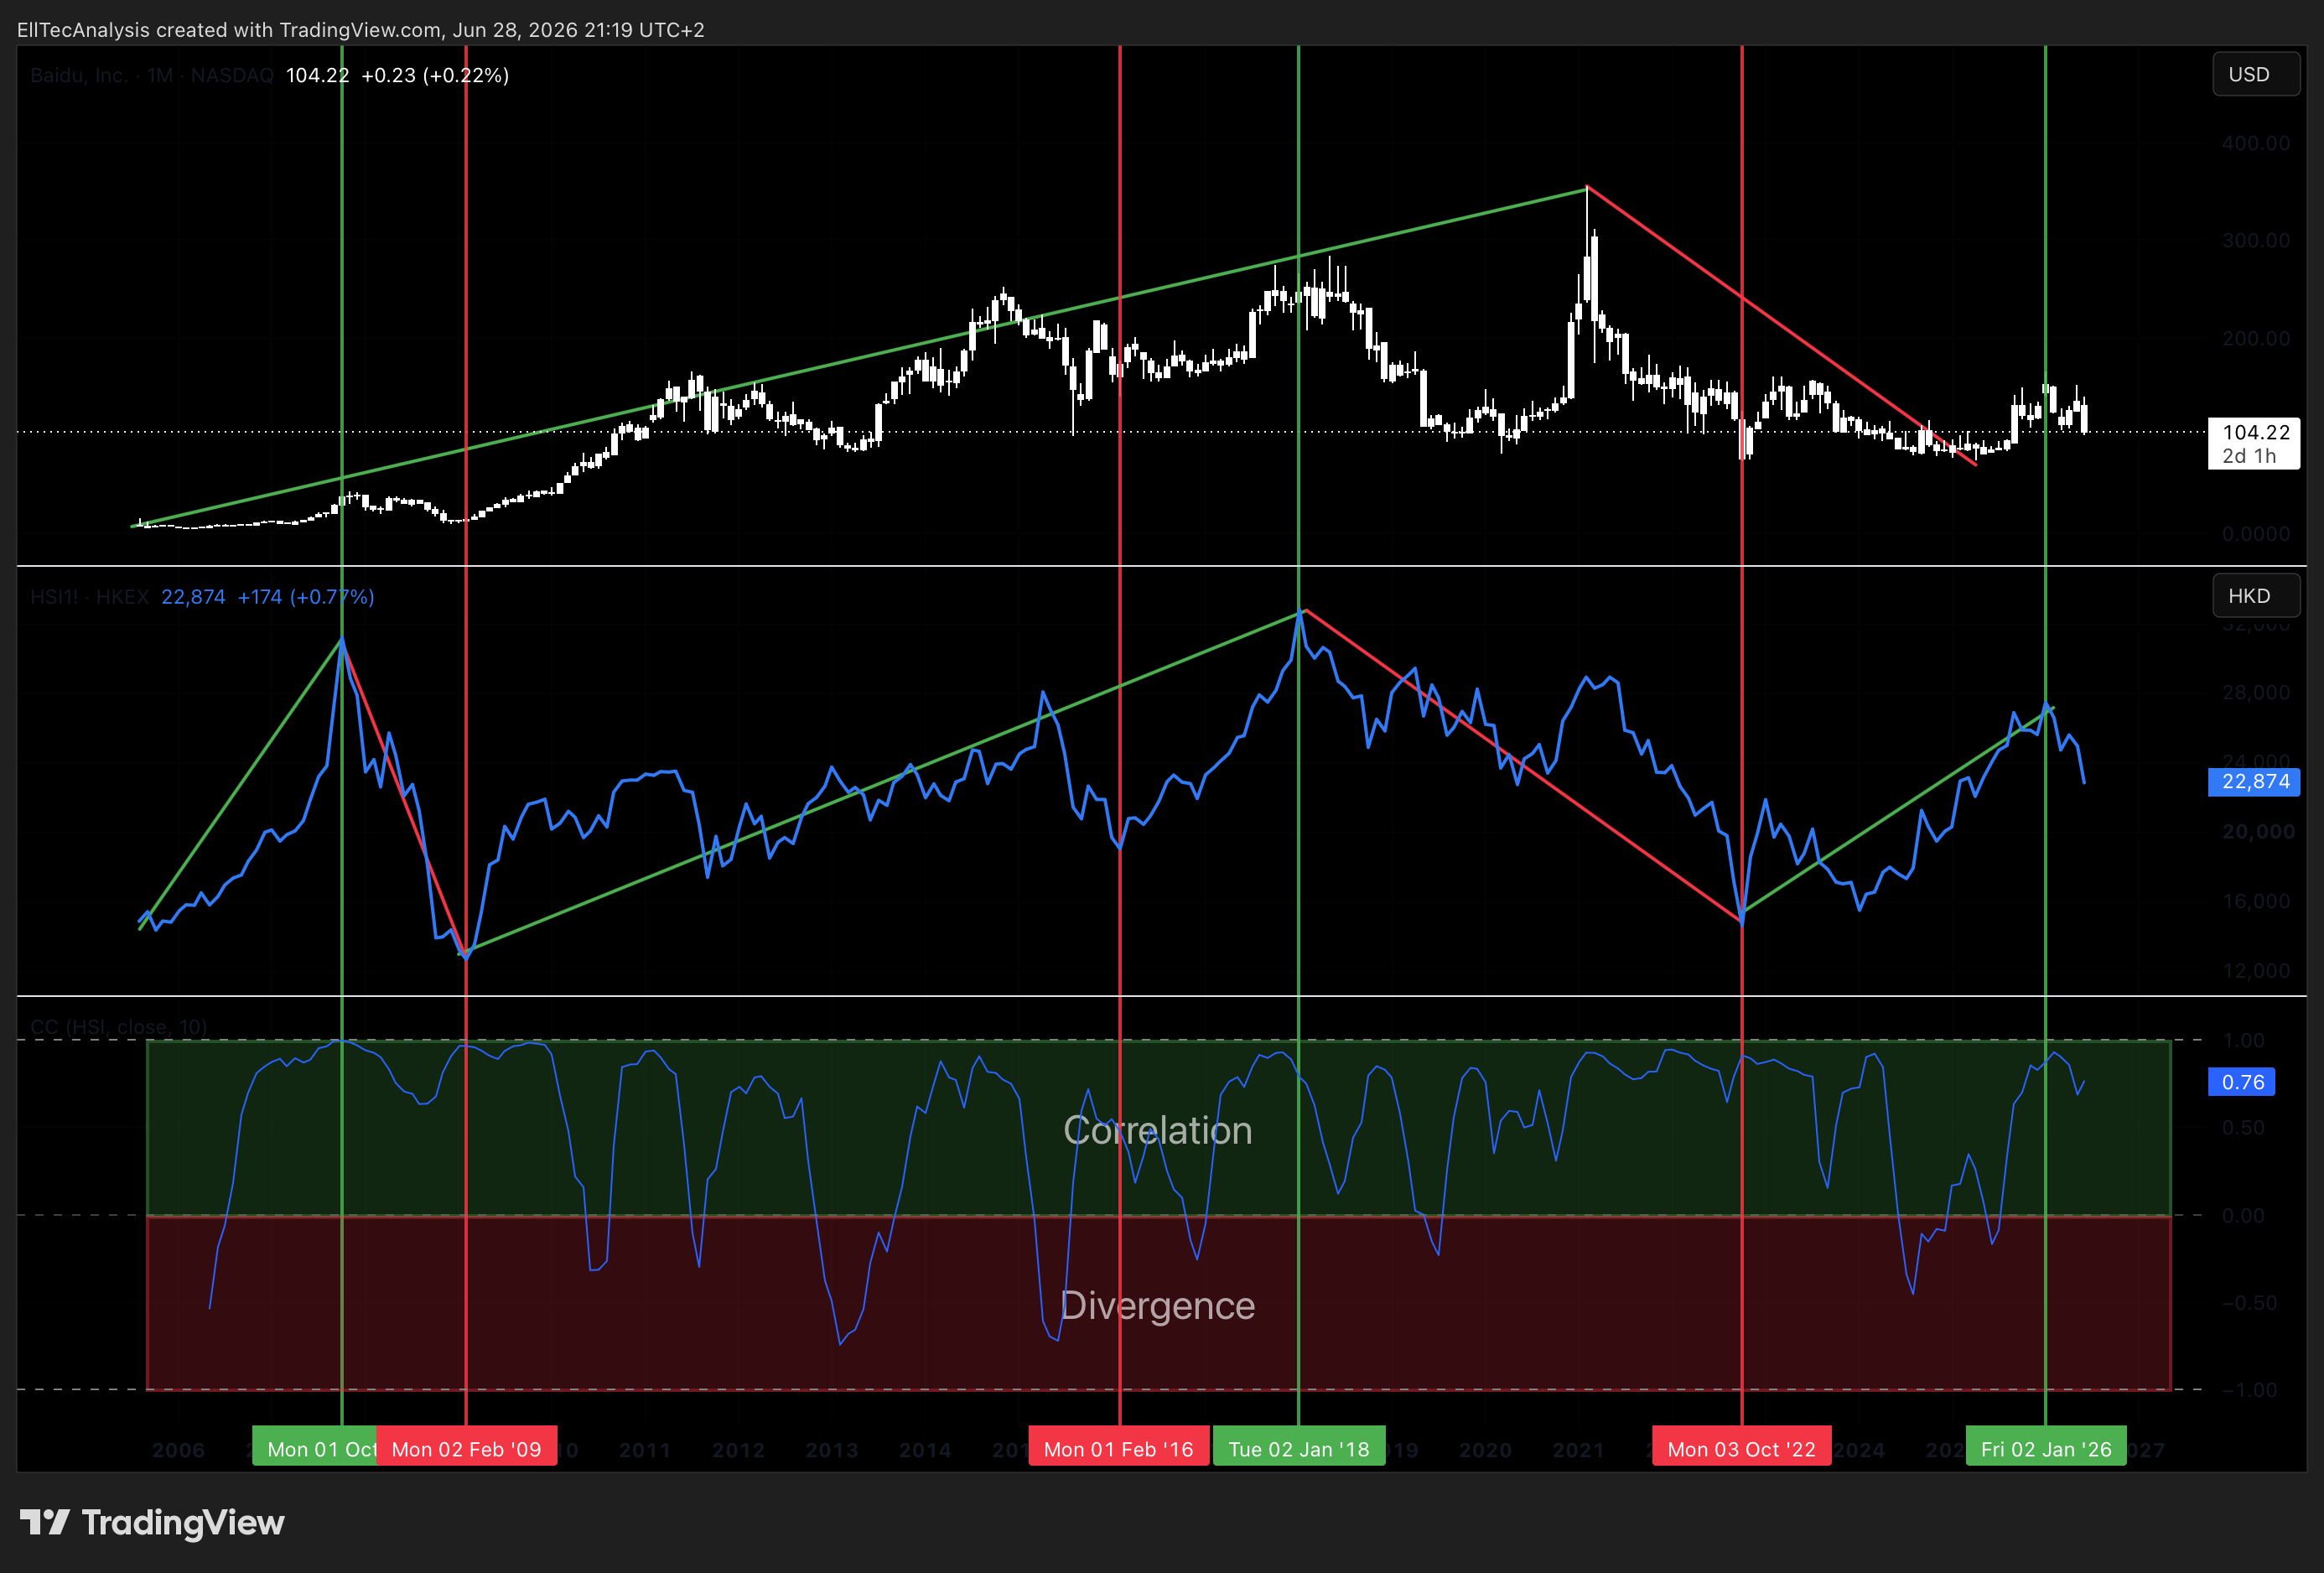
BIDU maintains one of its tightest correlations with the Hang Seng Technology Index, which serves as the primary benchmark for large-cap Chinese technology listed in Hong Kong. This correlation is particularly strong during institutional rebalancing periods and in response to macro policy shifts from Beijing. When regulatory conditions ease, the sector re-rates collectively and BIDU participates fully. When regulatory pressure returns or geopolitical tensions spike, the correlation tightens further on the downside, with Baidu, Tencent, and other major technology names frequently retreating in tandem during acute stress episodes. The correlation with the Hang Seng Index also shows the the regulatory conditions and risk-appetite.
More about the HSI:

US Dollar Index (DXY)
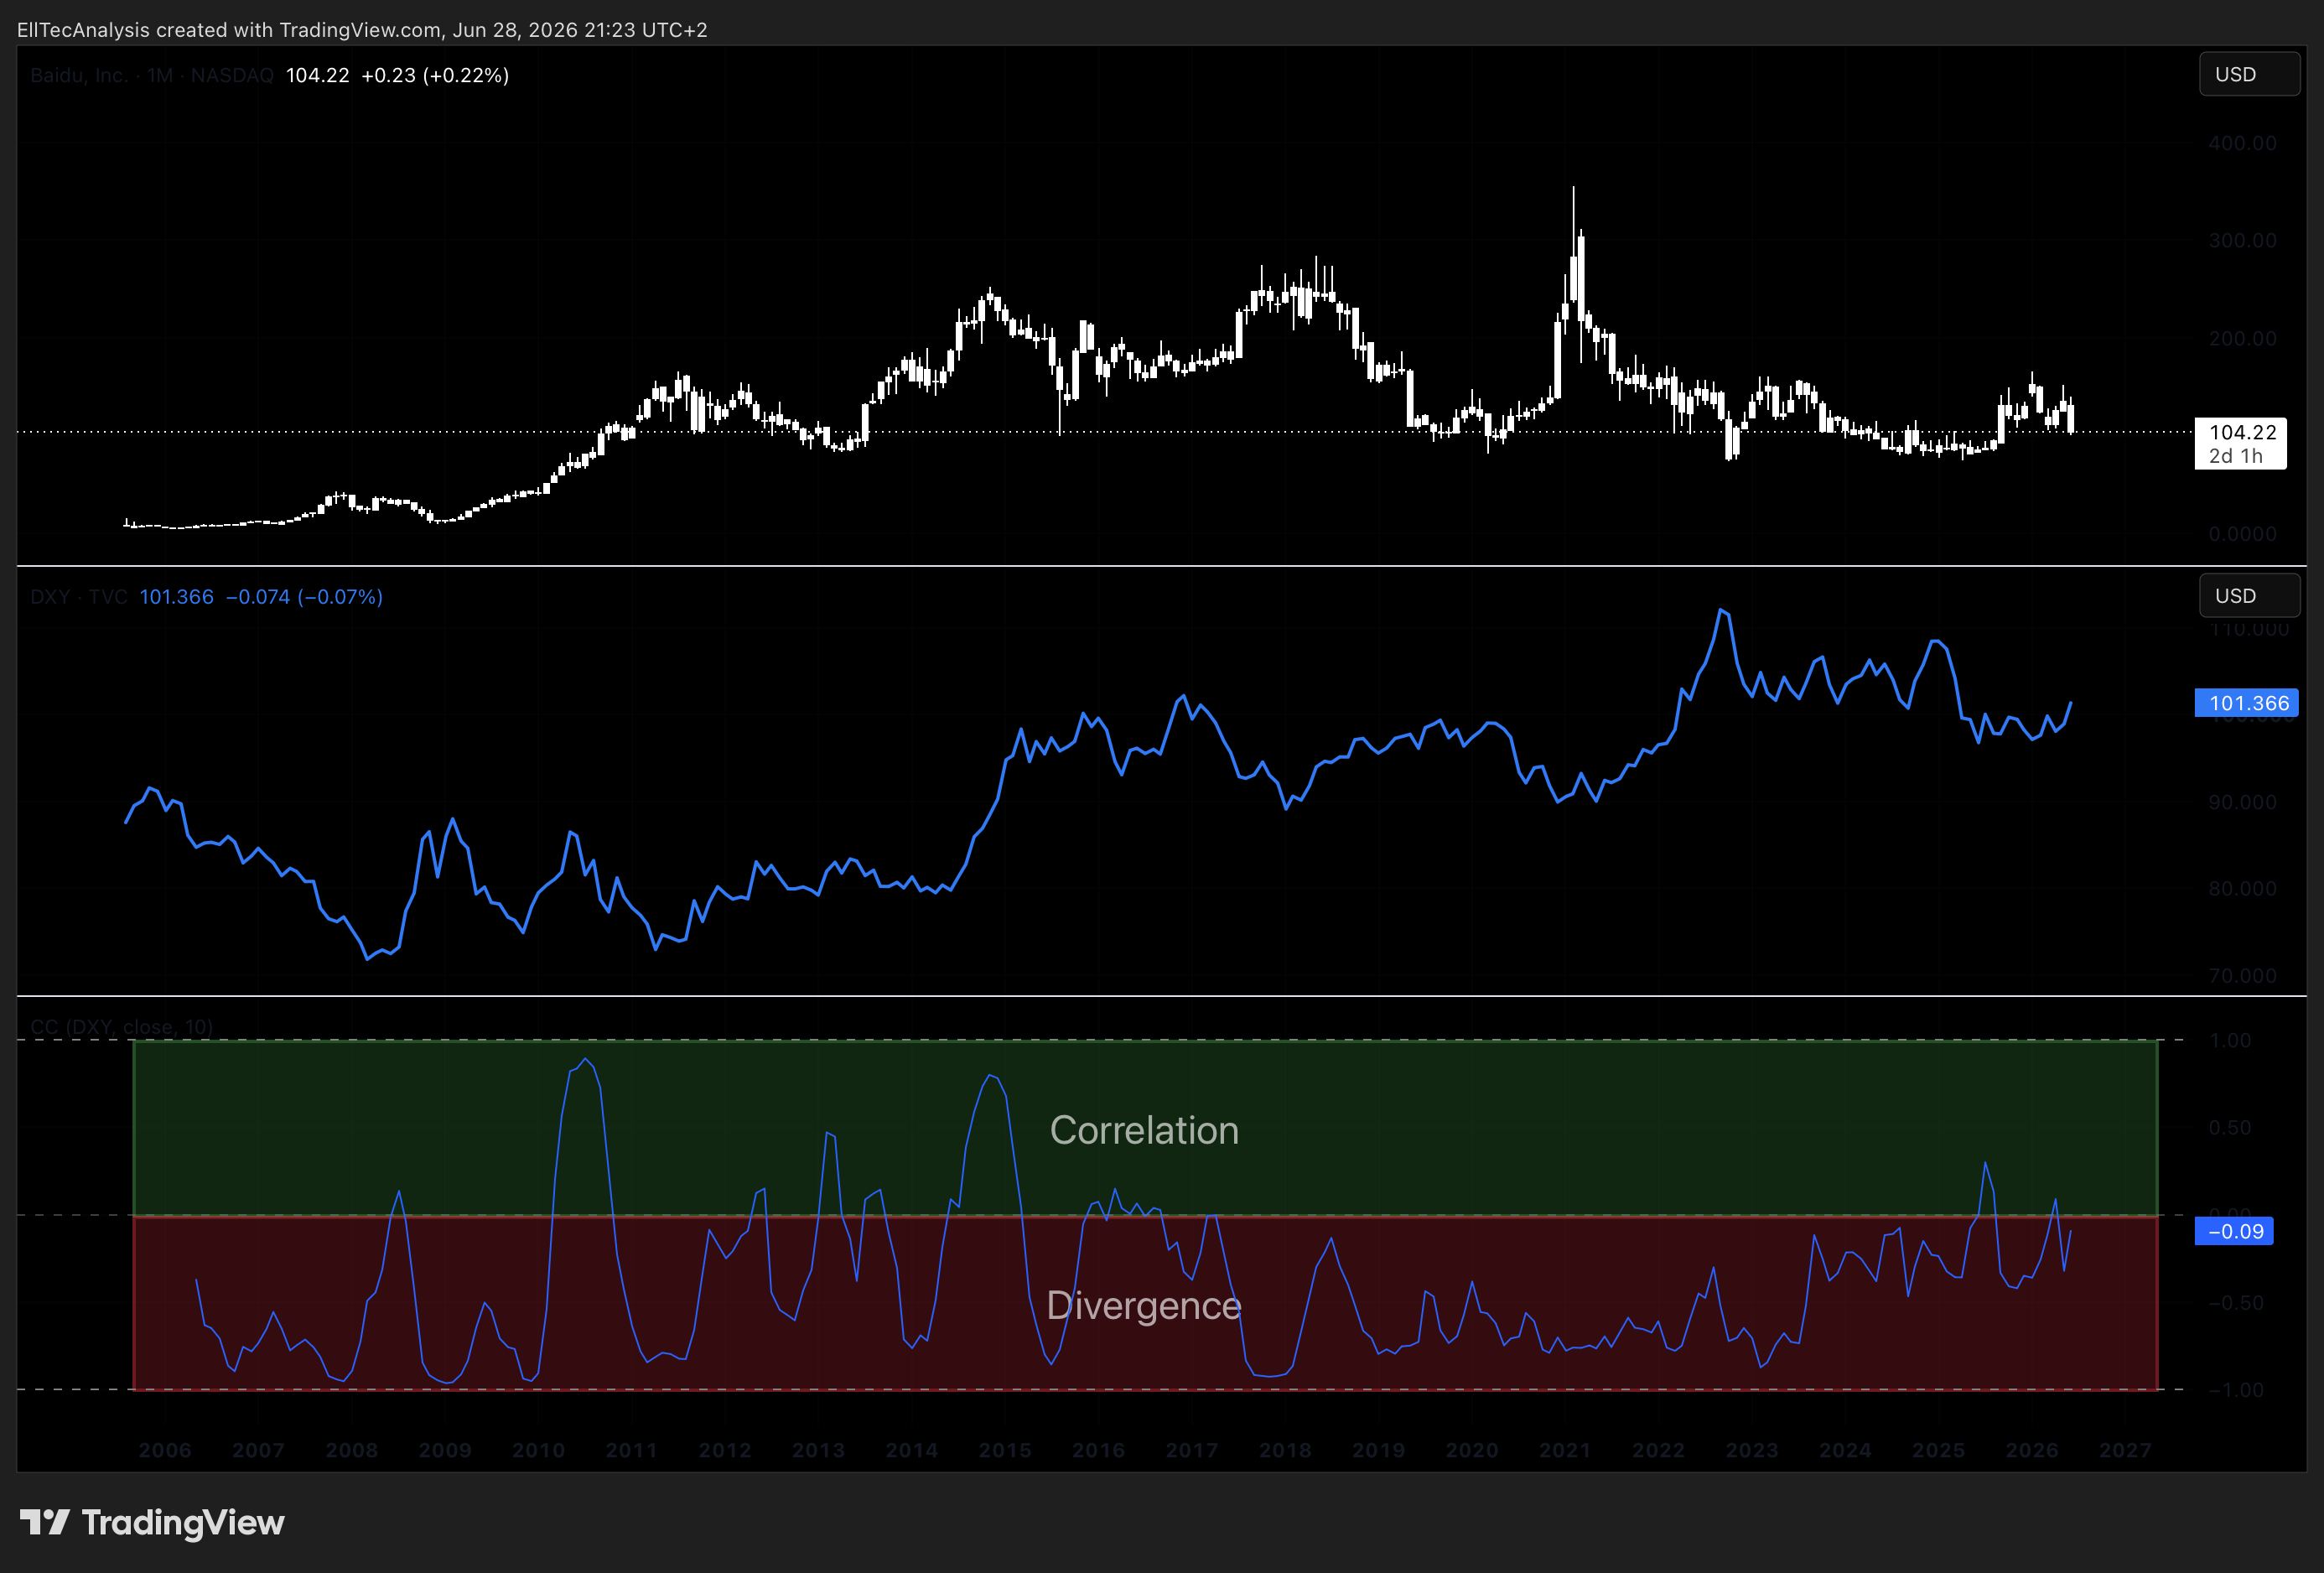
BIDU carries a broadly inverse relationship with the US Dollar Index, consistent with the dynamics observed across emerging market and ADR-listed assets. A stronger dollar tightens global liquidity conditions, reduces the attractiveness of offshore-denominated assets for international investors, and places additional pressure on the CNY/USD exchange rate, which affects the dollar-translated earnings of Chinese companies. When the DXY weakens, capital tends to rotate toward higher-beta international assets, and BIDU tends to respond positively. The waning dominance of the U.S. dollar, evidenced by the yuan’s growing role in regional trade and BRICS-led financial mechanisms, adds a longer-term structural dimension to this relationship. The DXY correlation is not mechanical and can break down during episodes of acute Chinese-specific risk, but over medium and longer timeframes it remains a reliable directional guide.
NASDAQ-100 (US Technology Index)
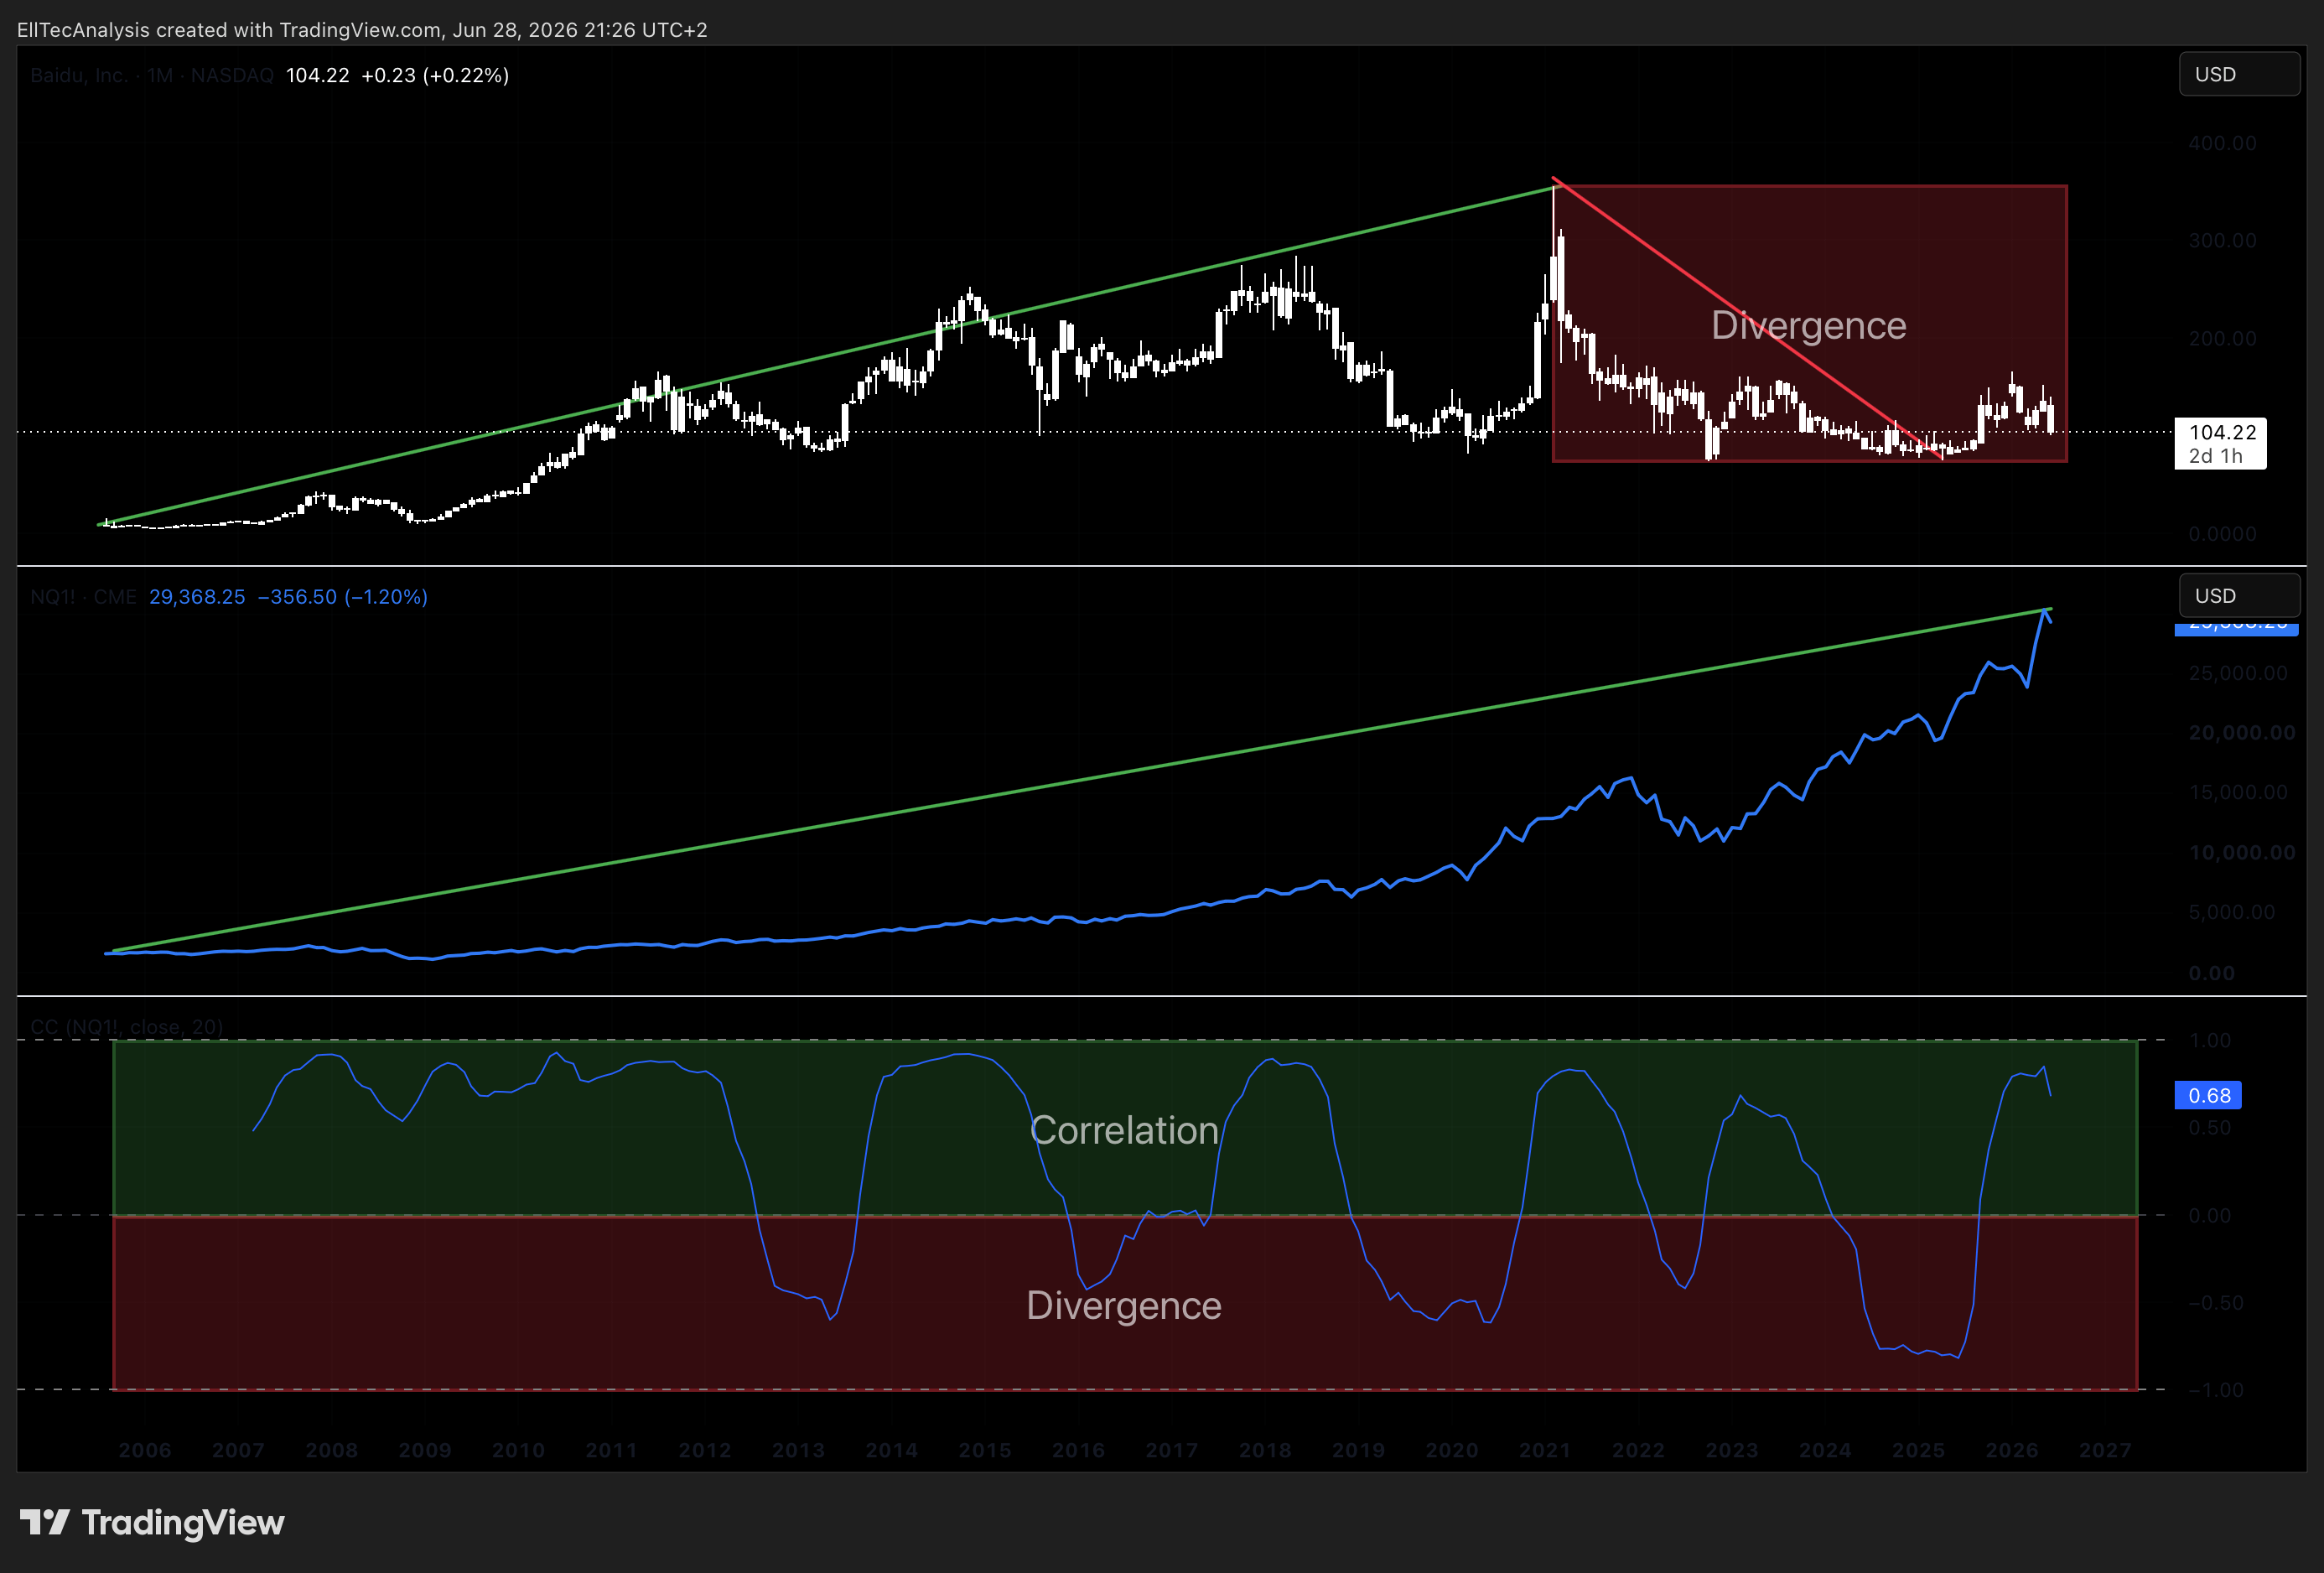
BIDU maintains a secondary correlation with the NASDAQ-100, which reflects its dual listing as a U.S.-traded technology ADR. During periods when global technology sentiment is the dominant driver, BIDU can move in loose sympathy with U.S. megacap tech. This relationship is, however, regime-dependent and frequently interrupted. When Chinese-specific risk factors, whether regulatory, geopolitical, or macroeconomic, dominate the narrative, the BIDU/NDX correlation breaks down materially and BIDU trades on its own information set. The correlation is most relevant during macro calm, when sector rotations in U.S. technology markets create ripple effects into the broader tech investment universe. The divergence since 2021 can indicate a trend reversal, where BIDU starts performing good again, this would add up to the primary Elliot Wave scenario.
More about the NASDAQ 100:

SECTION 03
Seasonality
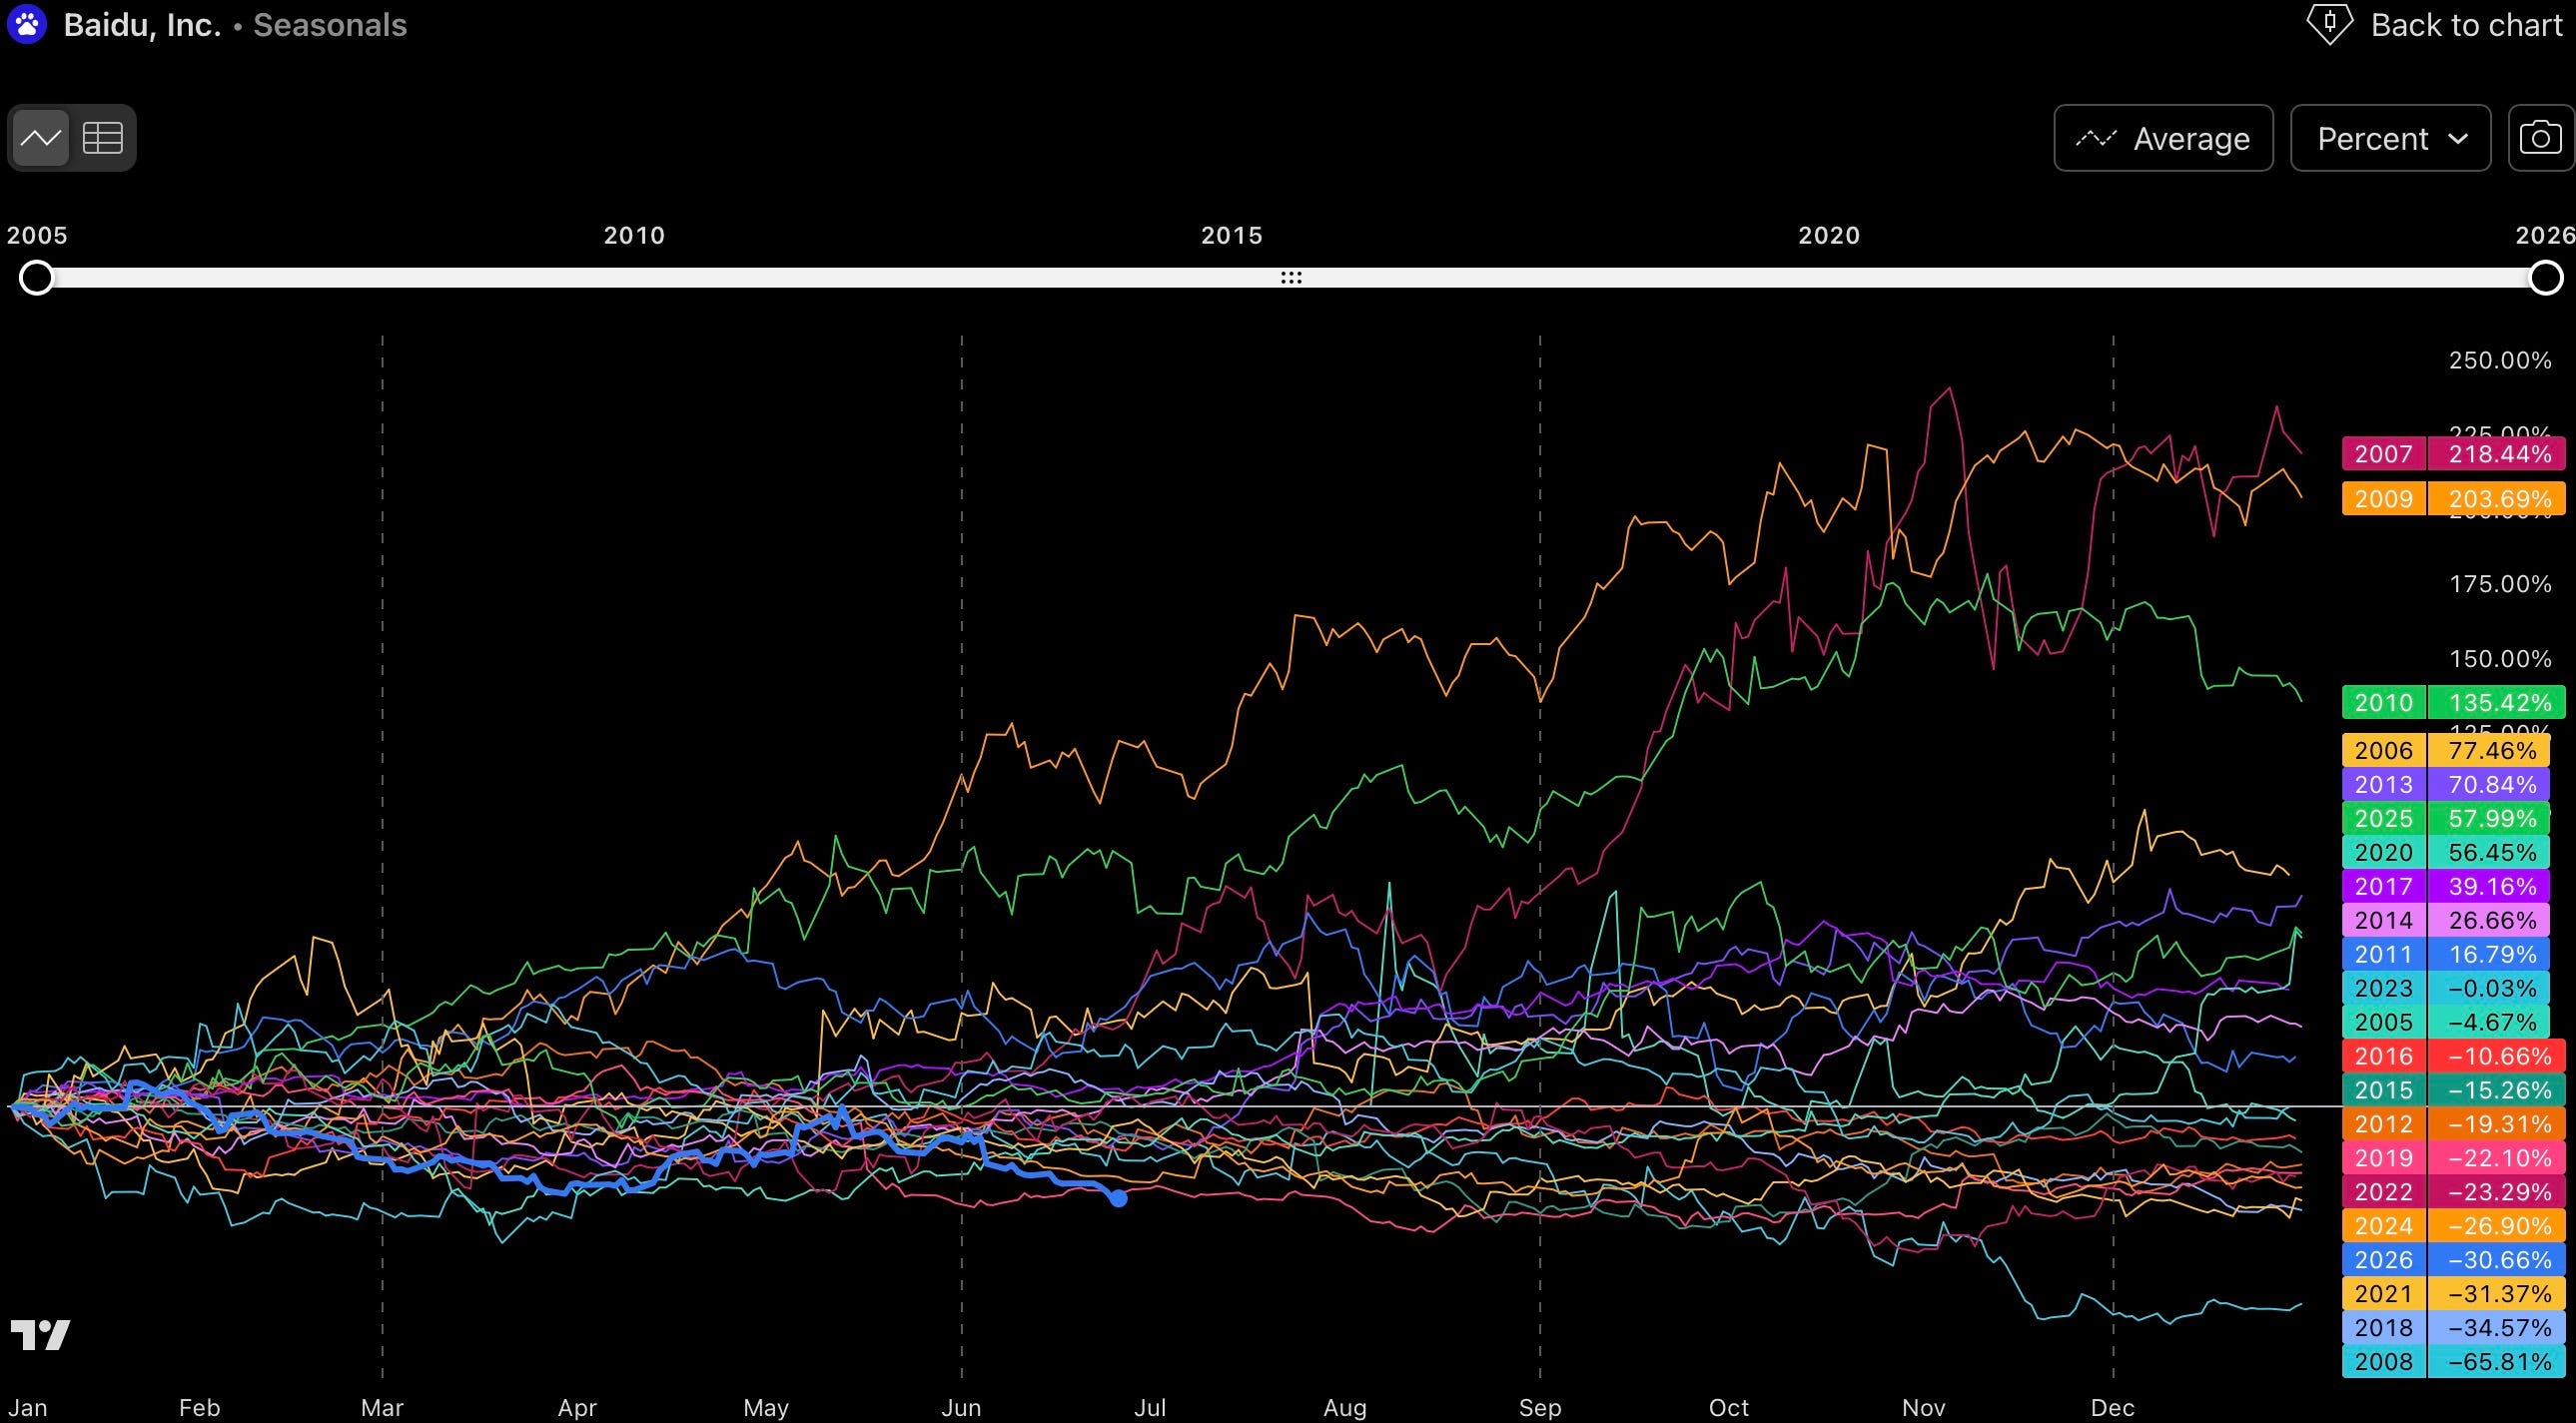
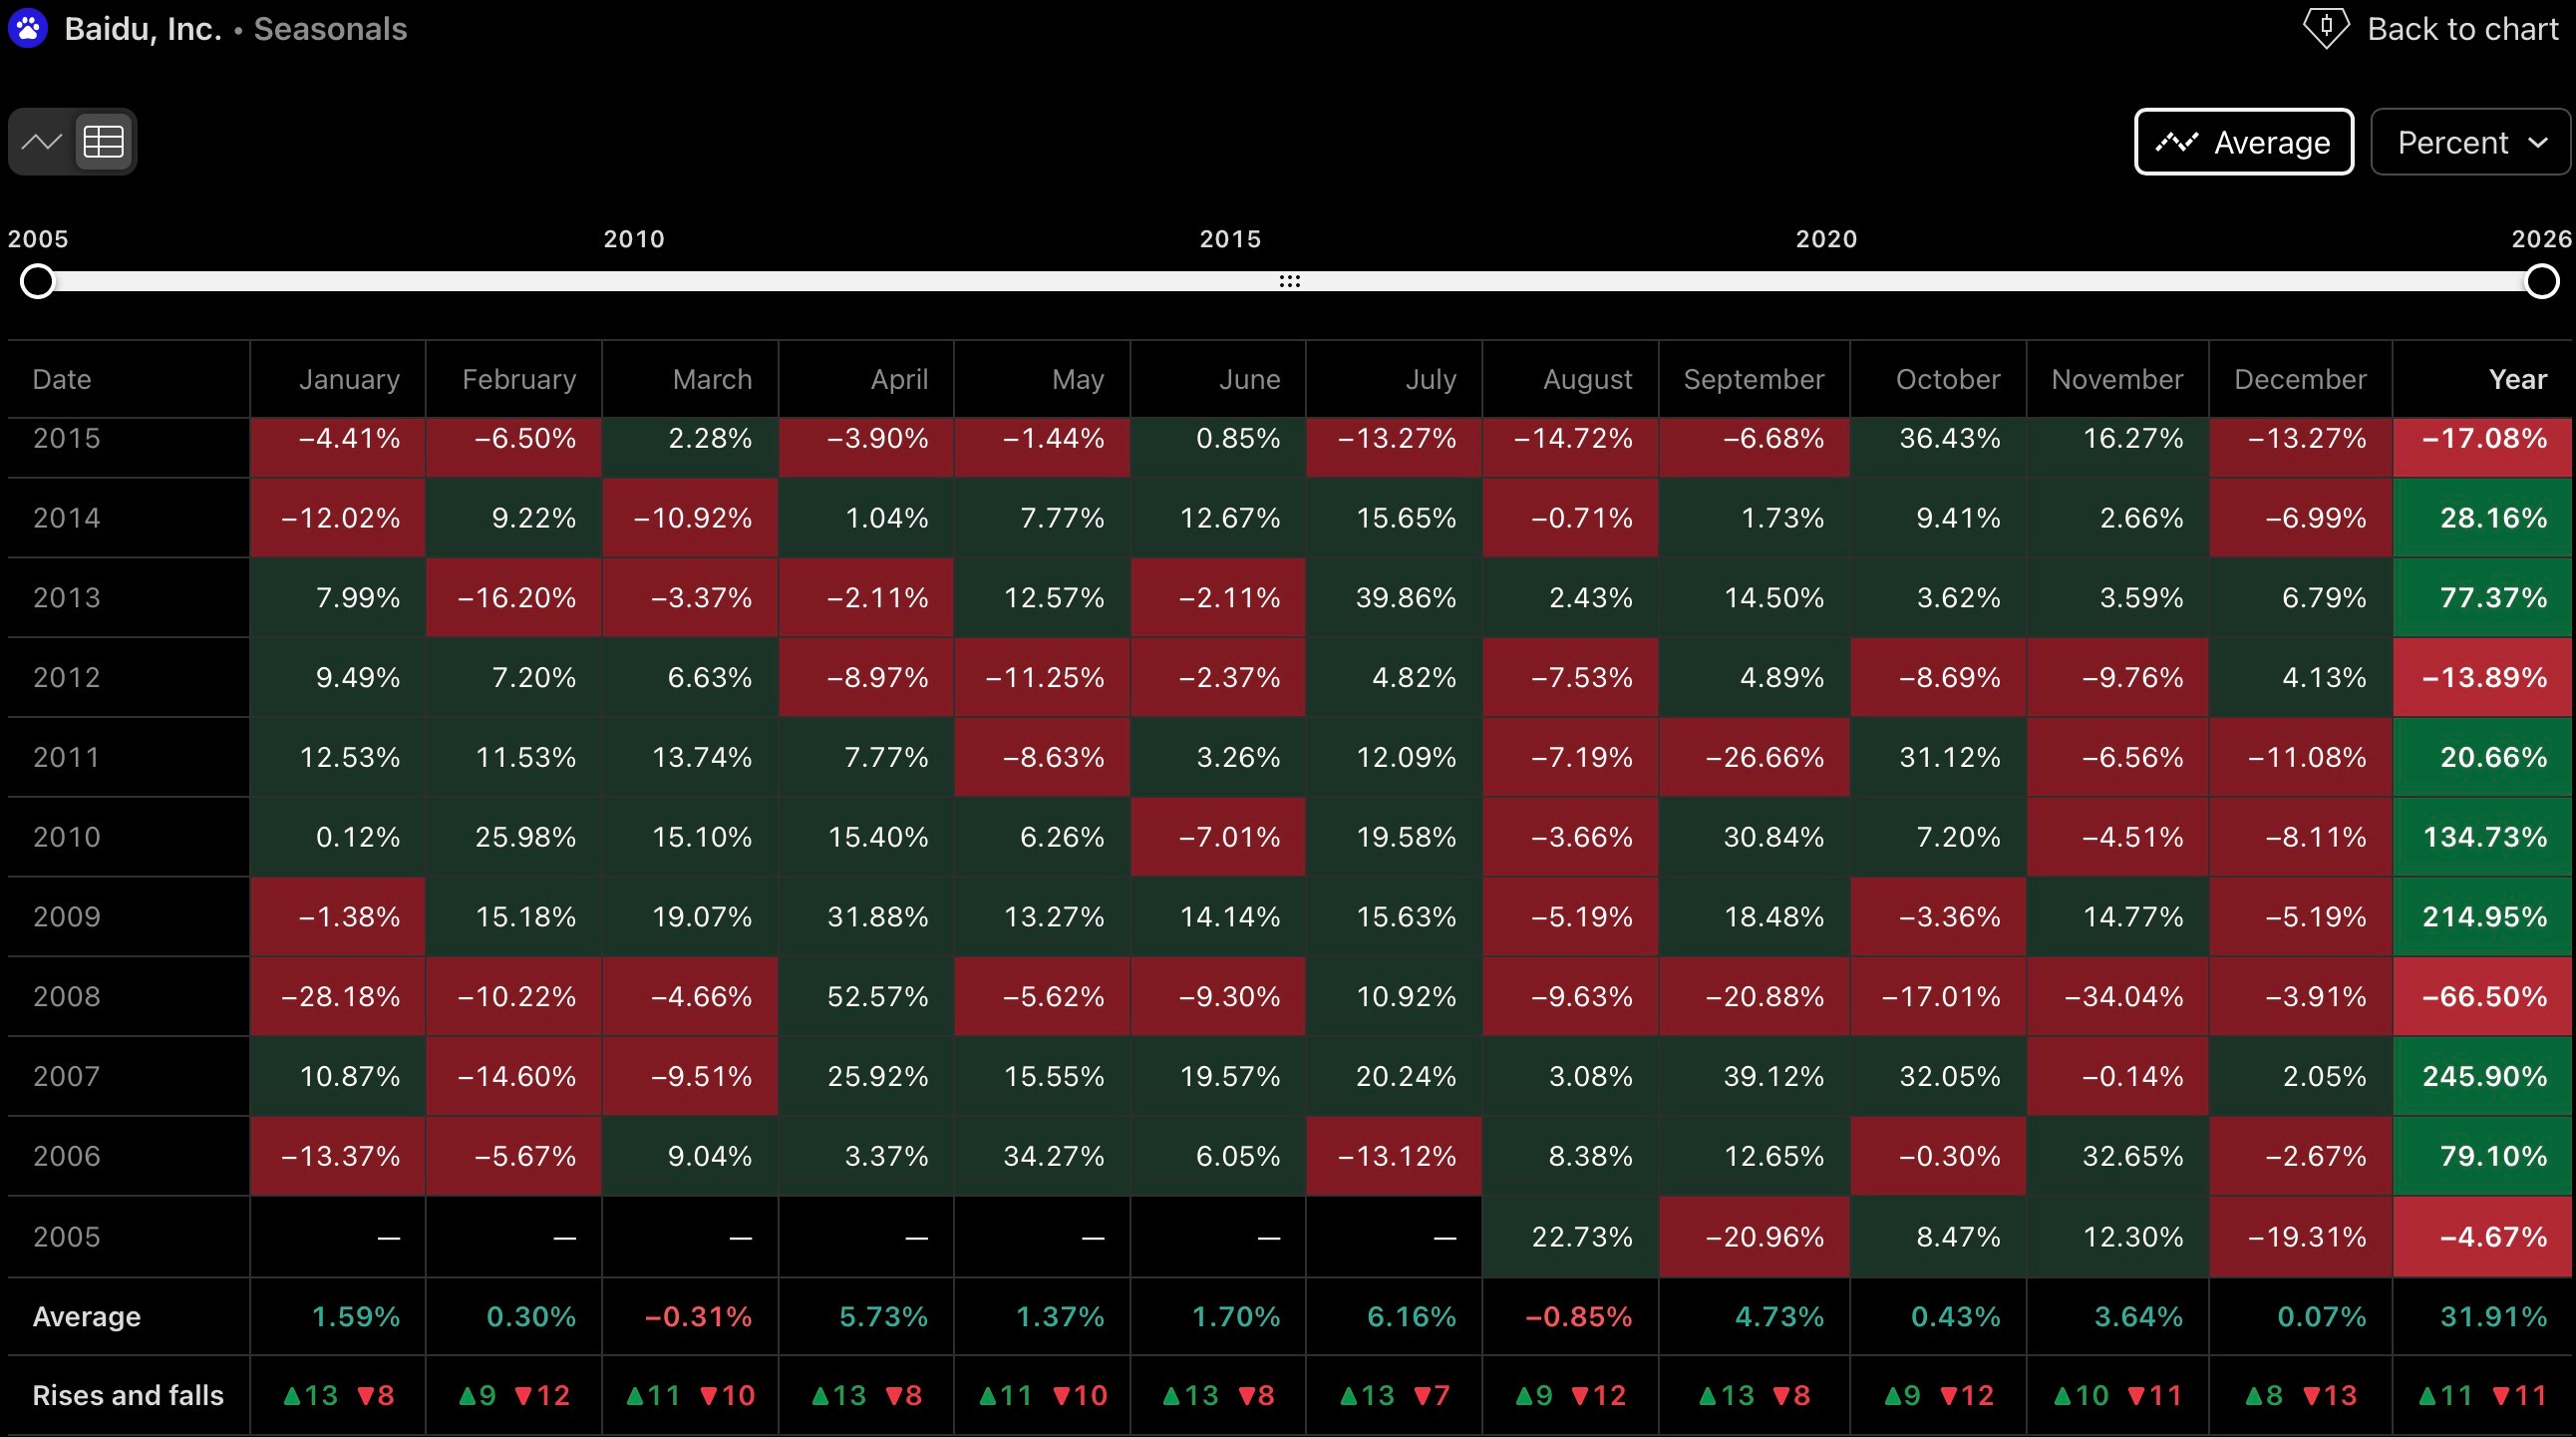
The historical seasonality of BIDU is broadly positive across the calendar year, though it carries enough noise to warrant careful interpretation. The standout months by average performance have been July, September, and November, each of which has historically delivered above-average returns on a mean basis. August and March have been the relative underperformers, with negative average returns that tend to reflect broader summer liquidity thinning and first-quarter re-rating dynamics in Chinese internet names. Historical data indicates that roughly 62% of the previous 20 Septembers have closed higher than August, confirming the seasonal tendency for an autumn recovery after summer weakness.
In the context of the current Elliott Wave framework, the timing implication is straightforward: if the primary scenario’s Wave C continues to develop through the summer months, it could find its termination point in August when seasonal weakness is most pronounced, and then align a reversal with the historically stronger September entry window. A positioning initiated from September onward would historically coincide with two of the strongest seasonal months in the calendar. However, the analytical weight placed on seasonality for BIDU should remain limited. The stock’s dominant drivers are structural, geopolitical, and momentum-based rather than calendar-systematic, and the seasonal data does not carry the predictive consistency it might in more liquidity-stable markets. The seasonal setup supports the trade timing thesis but does not define it.
SECTION 04
