

NASDAQ 100
A High-Growth Index Entering a Potential Cycle Transition


1. Fundamental & Macro Context
NASDAQ 100 E-Mini Futures represent one of the most liquid and institutionally traded equity index derivatives globally, tracking the performance of the largest U.S. technology and growth companies.
From a macro perspective, the Nasdaq 100 is heavily influenced by:
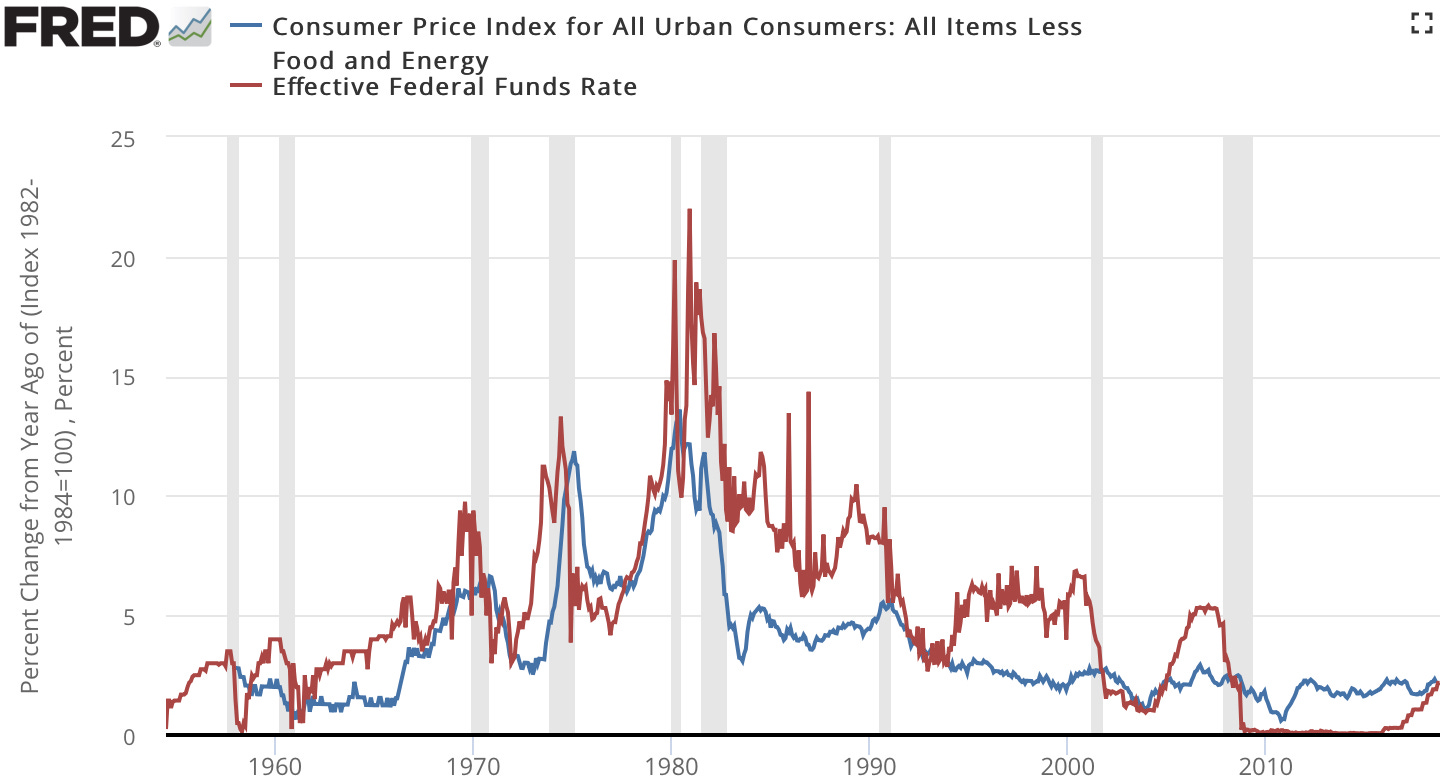
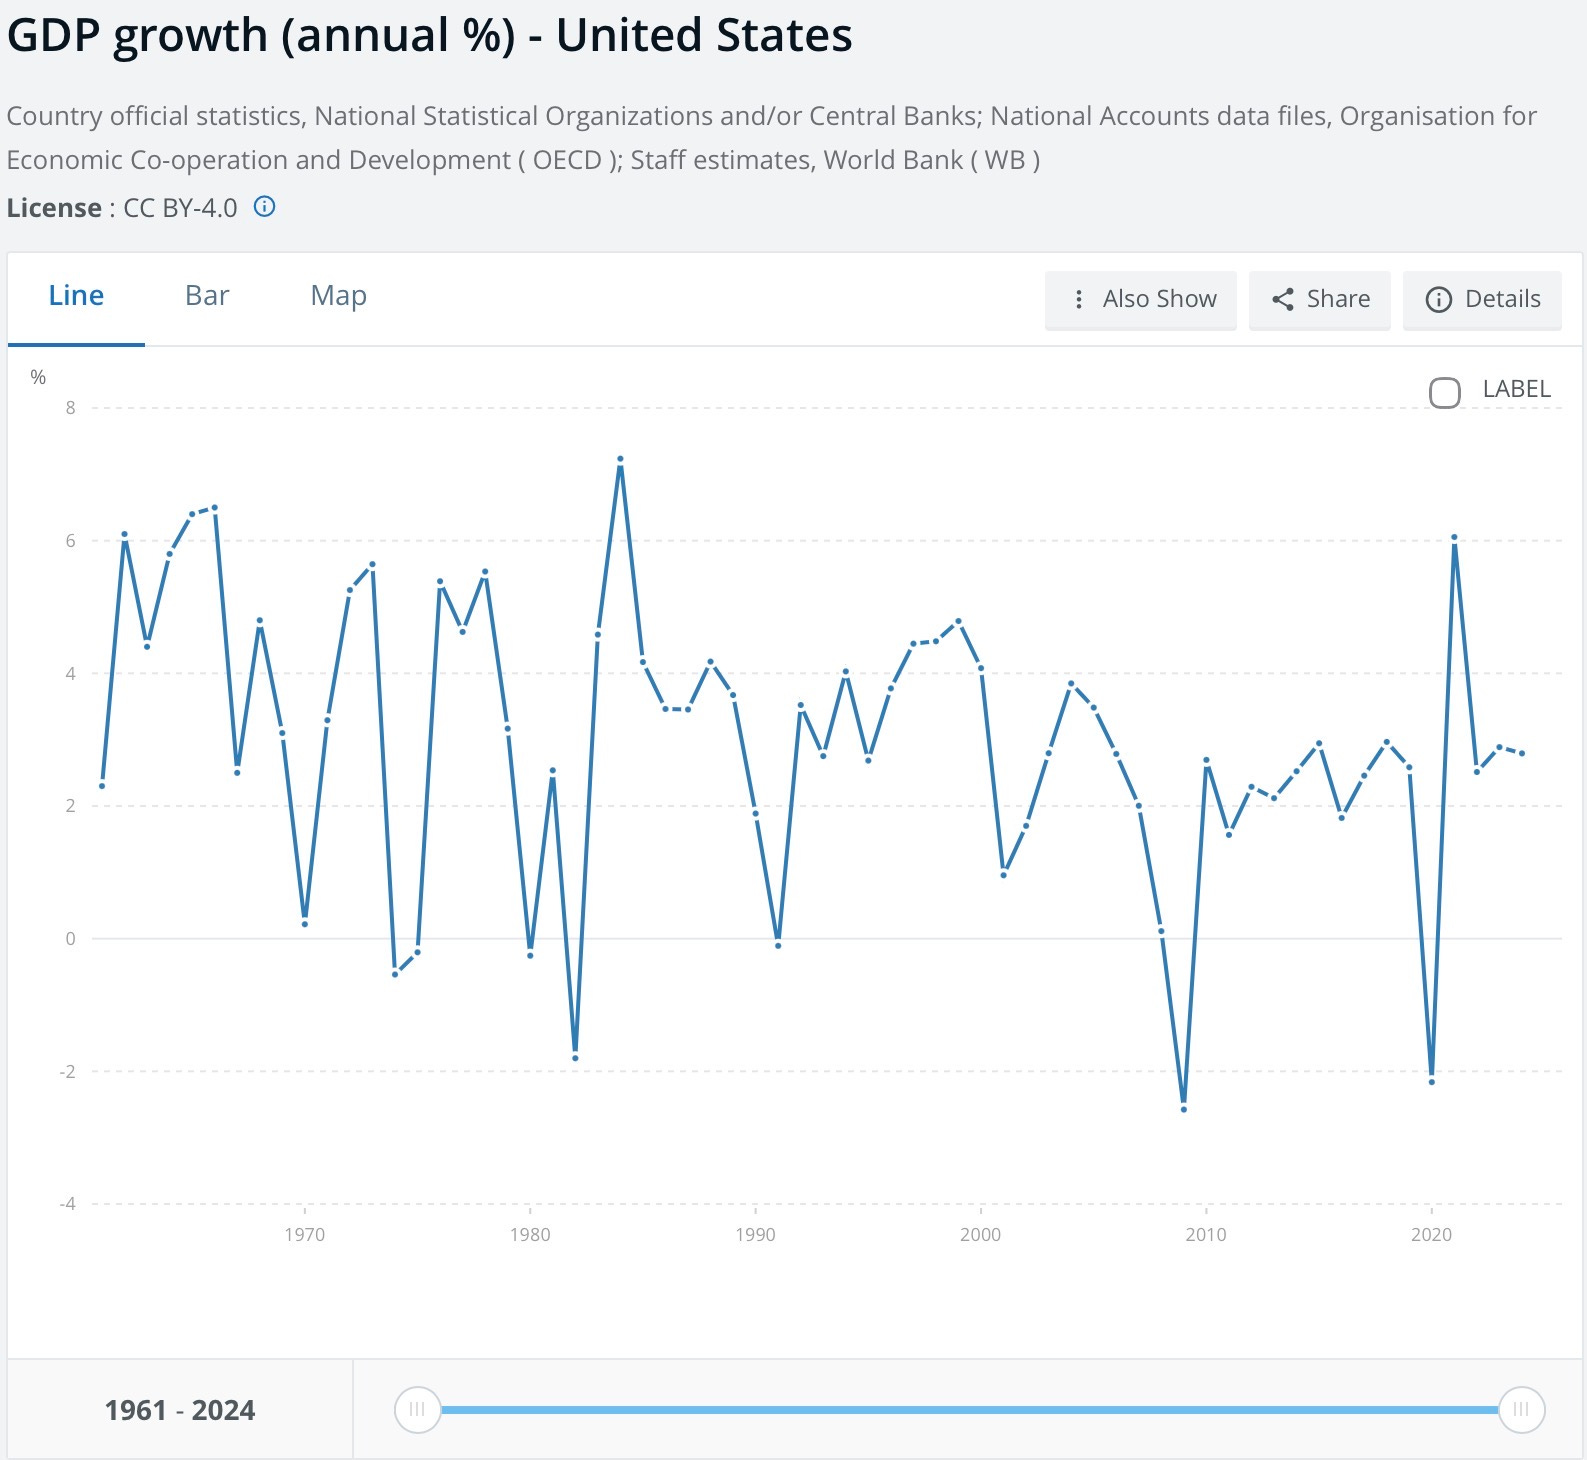
U.S. interest rate policy (Fed liquidity cycles)
Corporate earnings growth in mega-cap tech
AI and semiconductor investment cycles
Global risk sentiment and geopolitical stability
Geopolitical Context
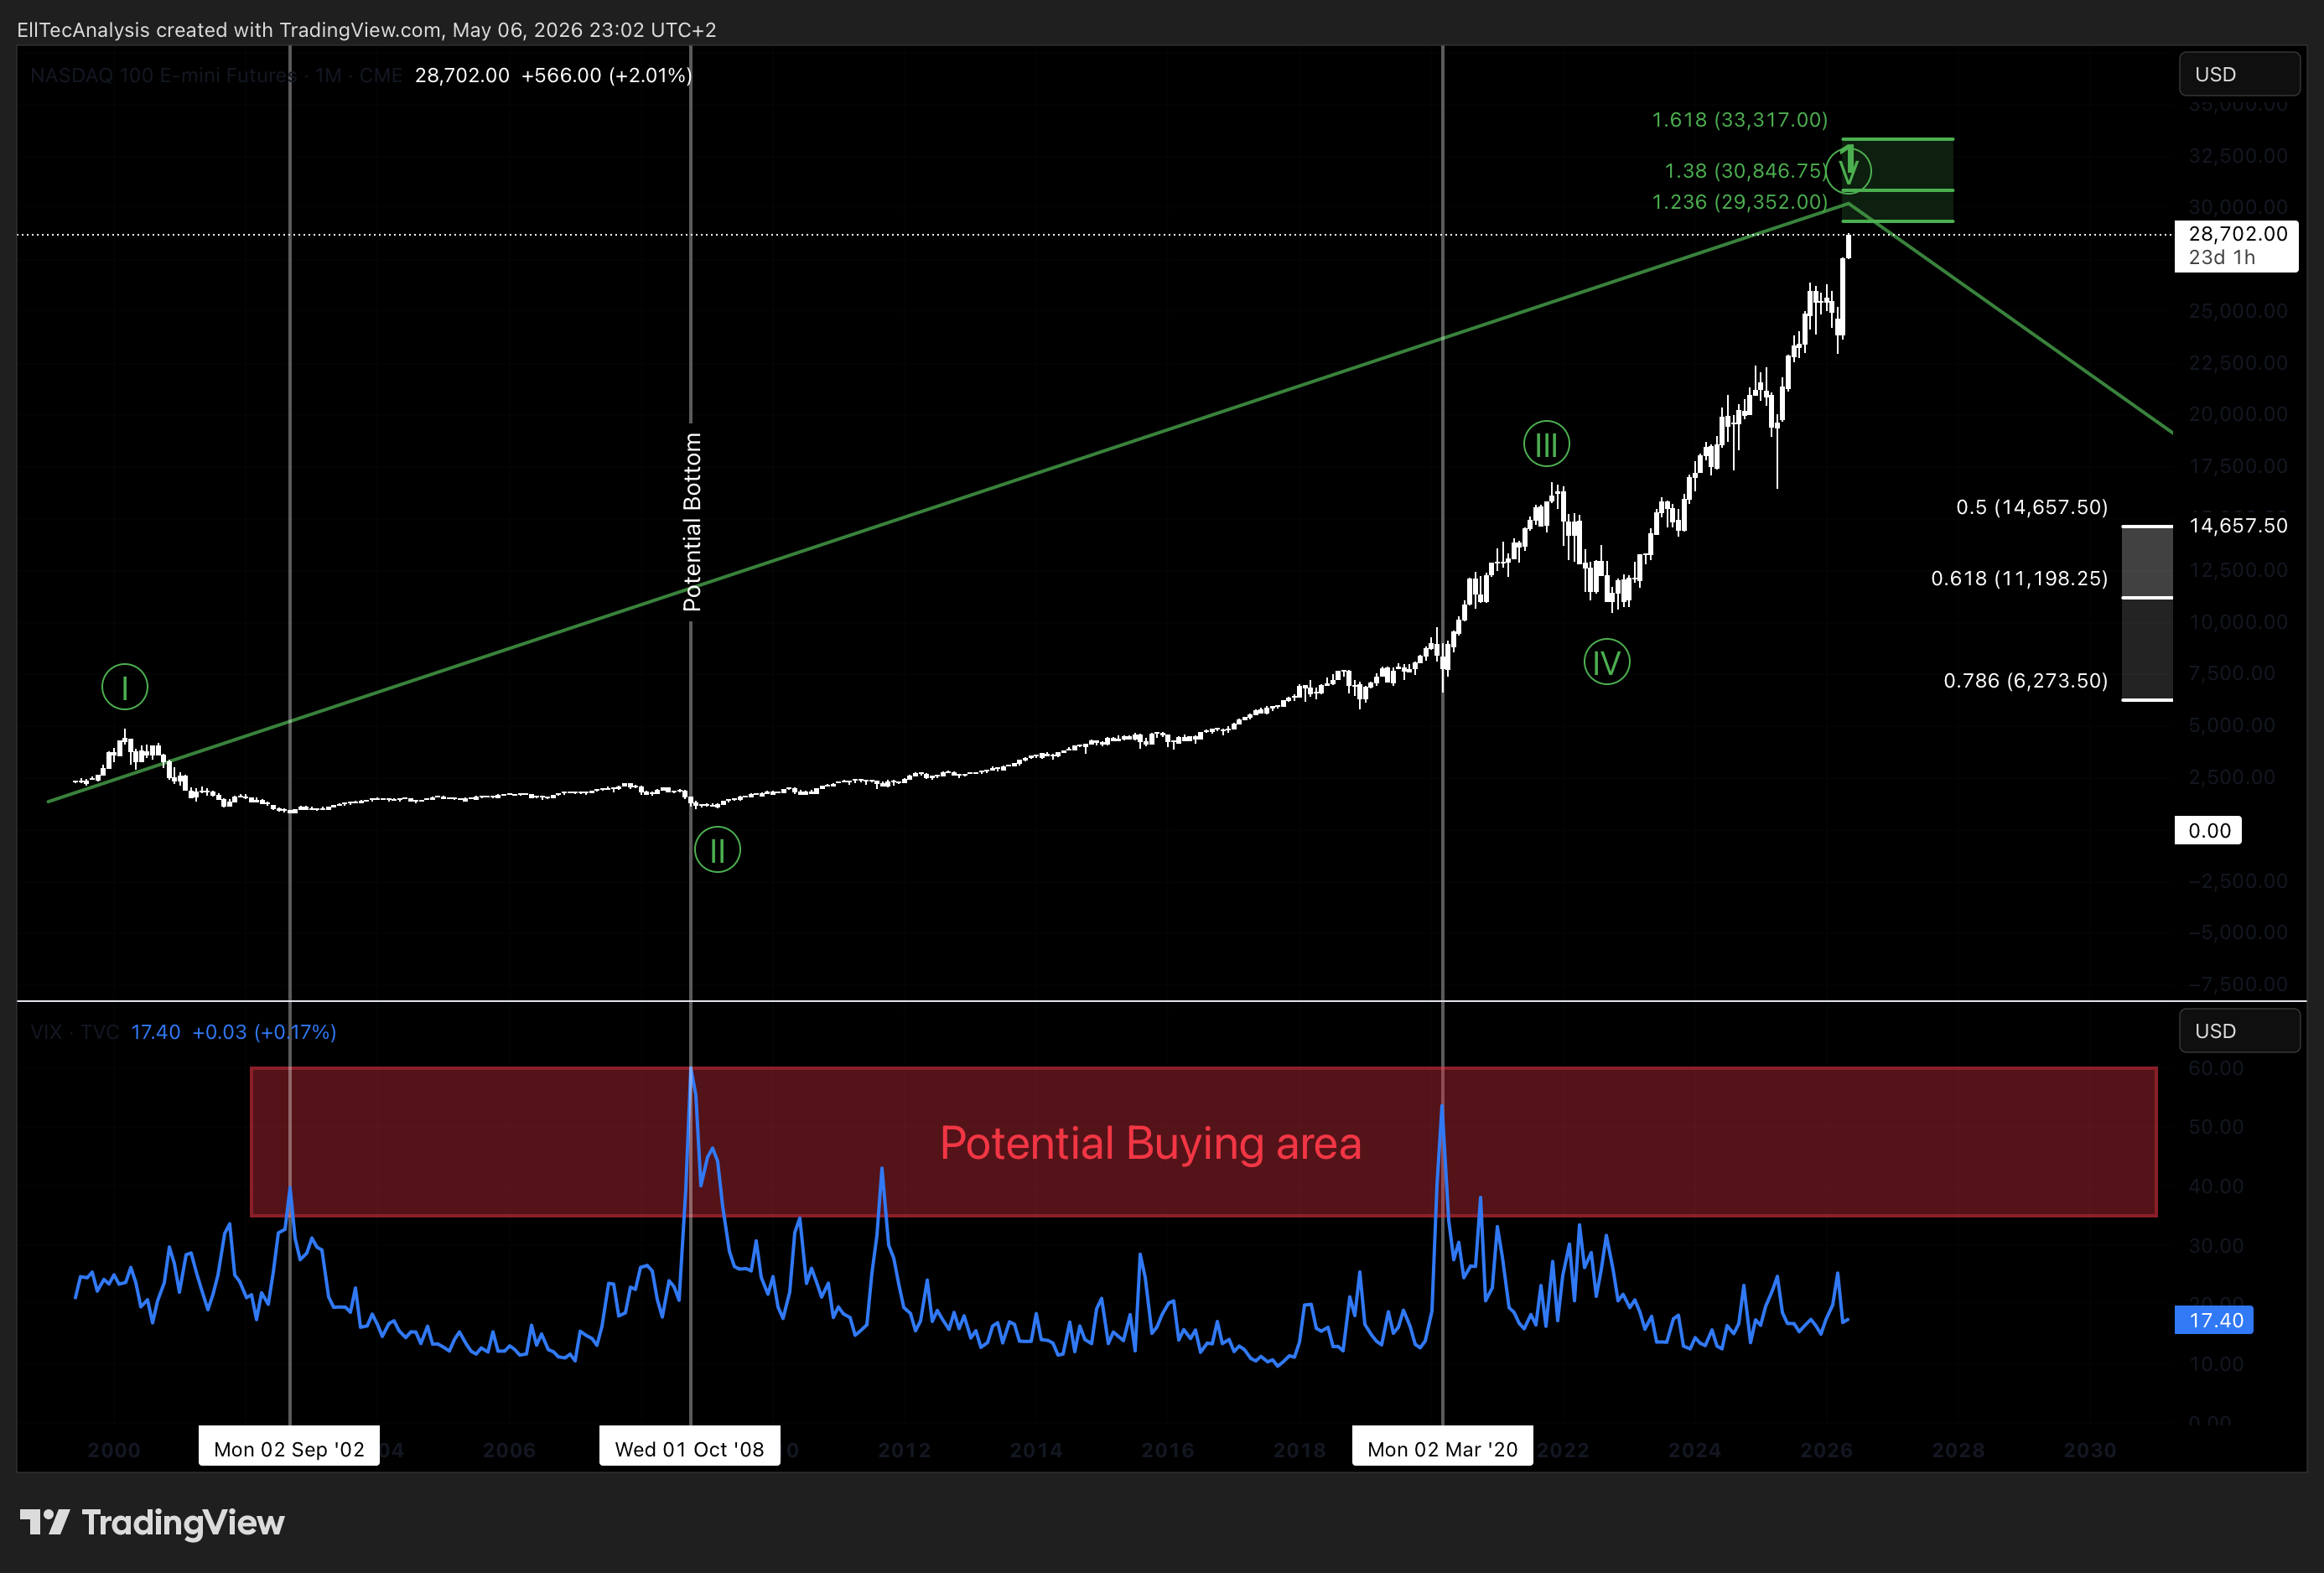
1M-Chart, upper part: Nasdaq 100, bottom part: S&P 500 Volatility Index
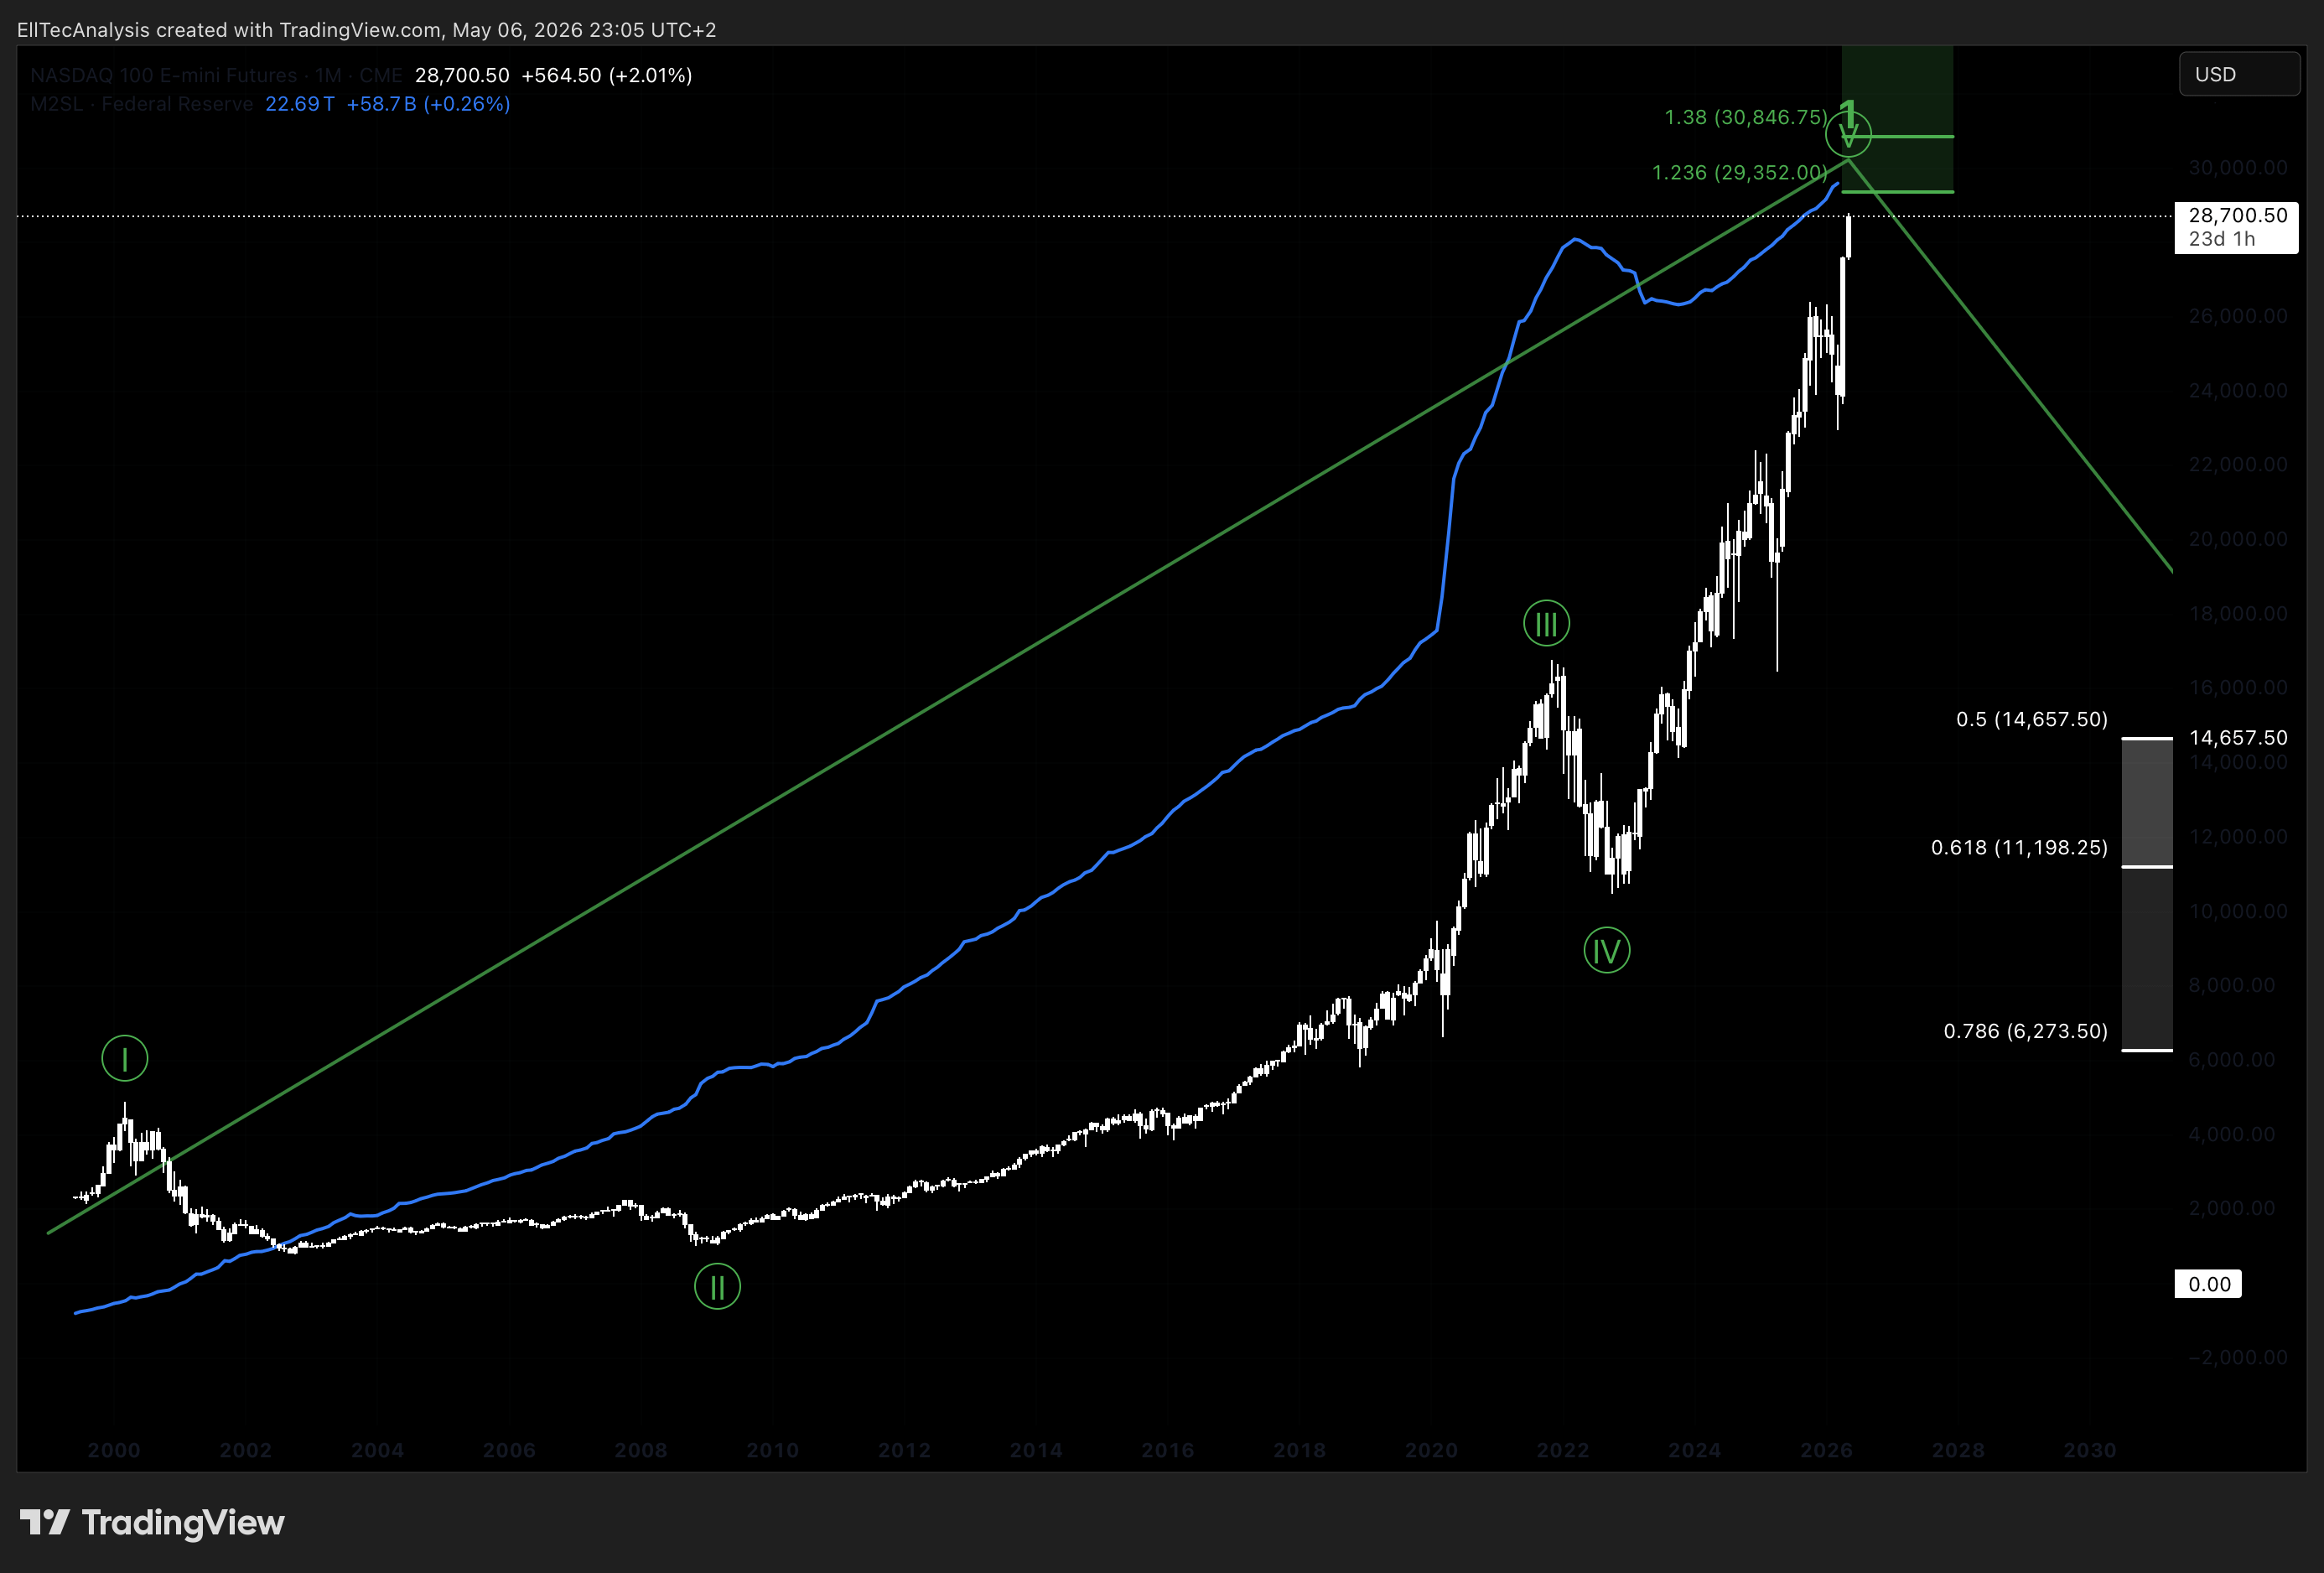
1M Chart, Graph in white: Nasdaq 100, Grapgh in blue: M2 Money stock (meassures liquidity)
Current global conditions, including ongoing regional conflicts, trade tensions, and geopolitical fragmentation, play a significant role in shaping risk appetite. Historically, heightened geopolitical uncertainty tends to:
increase volatility in growth equities
temporarily pressure risk assets
but also accelerate liquidity-driven rebounds in large-cap tech
The Nasdaq 100 remains structurally resilient due to its concentration in global technology leaders, which often benefit disproportionately from innovation cycles even in unstable macro environments.
2.Technical Analysis (Elliot Wave structure)
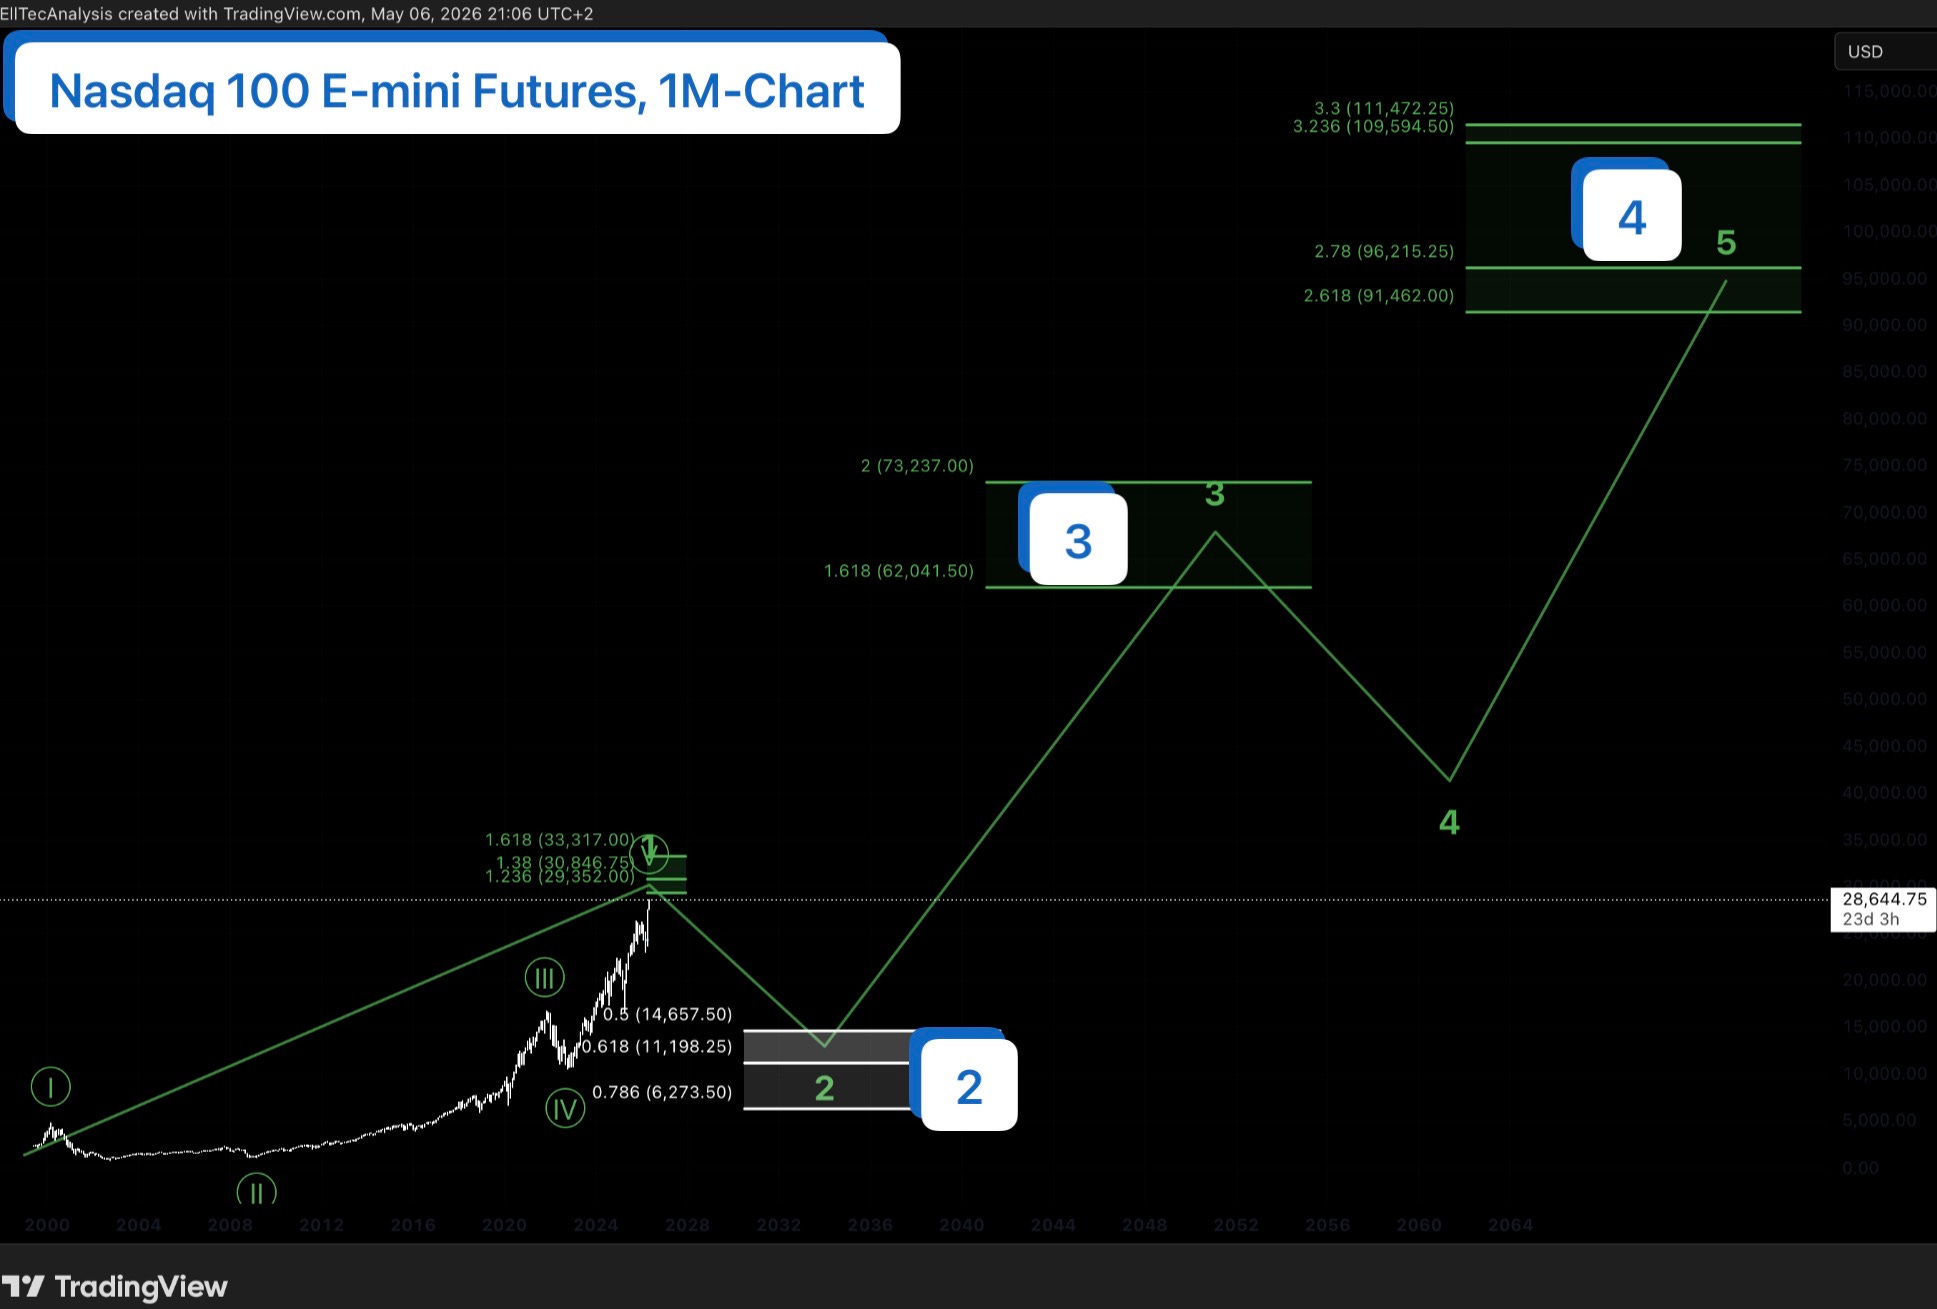
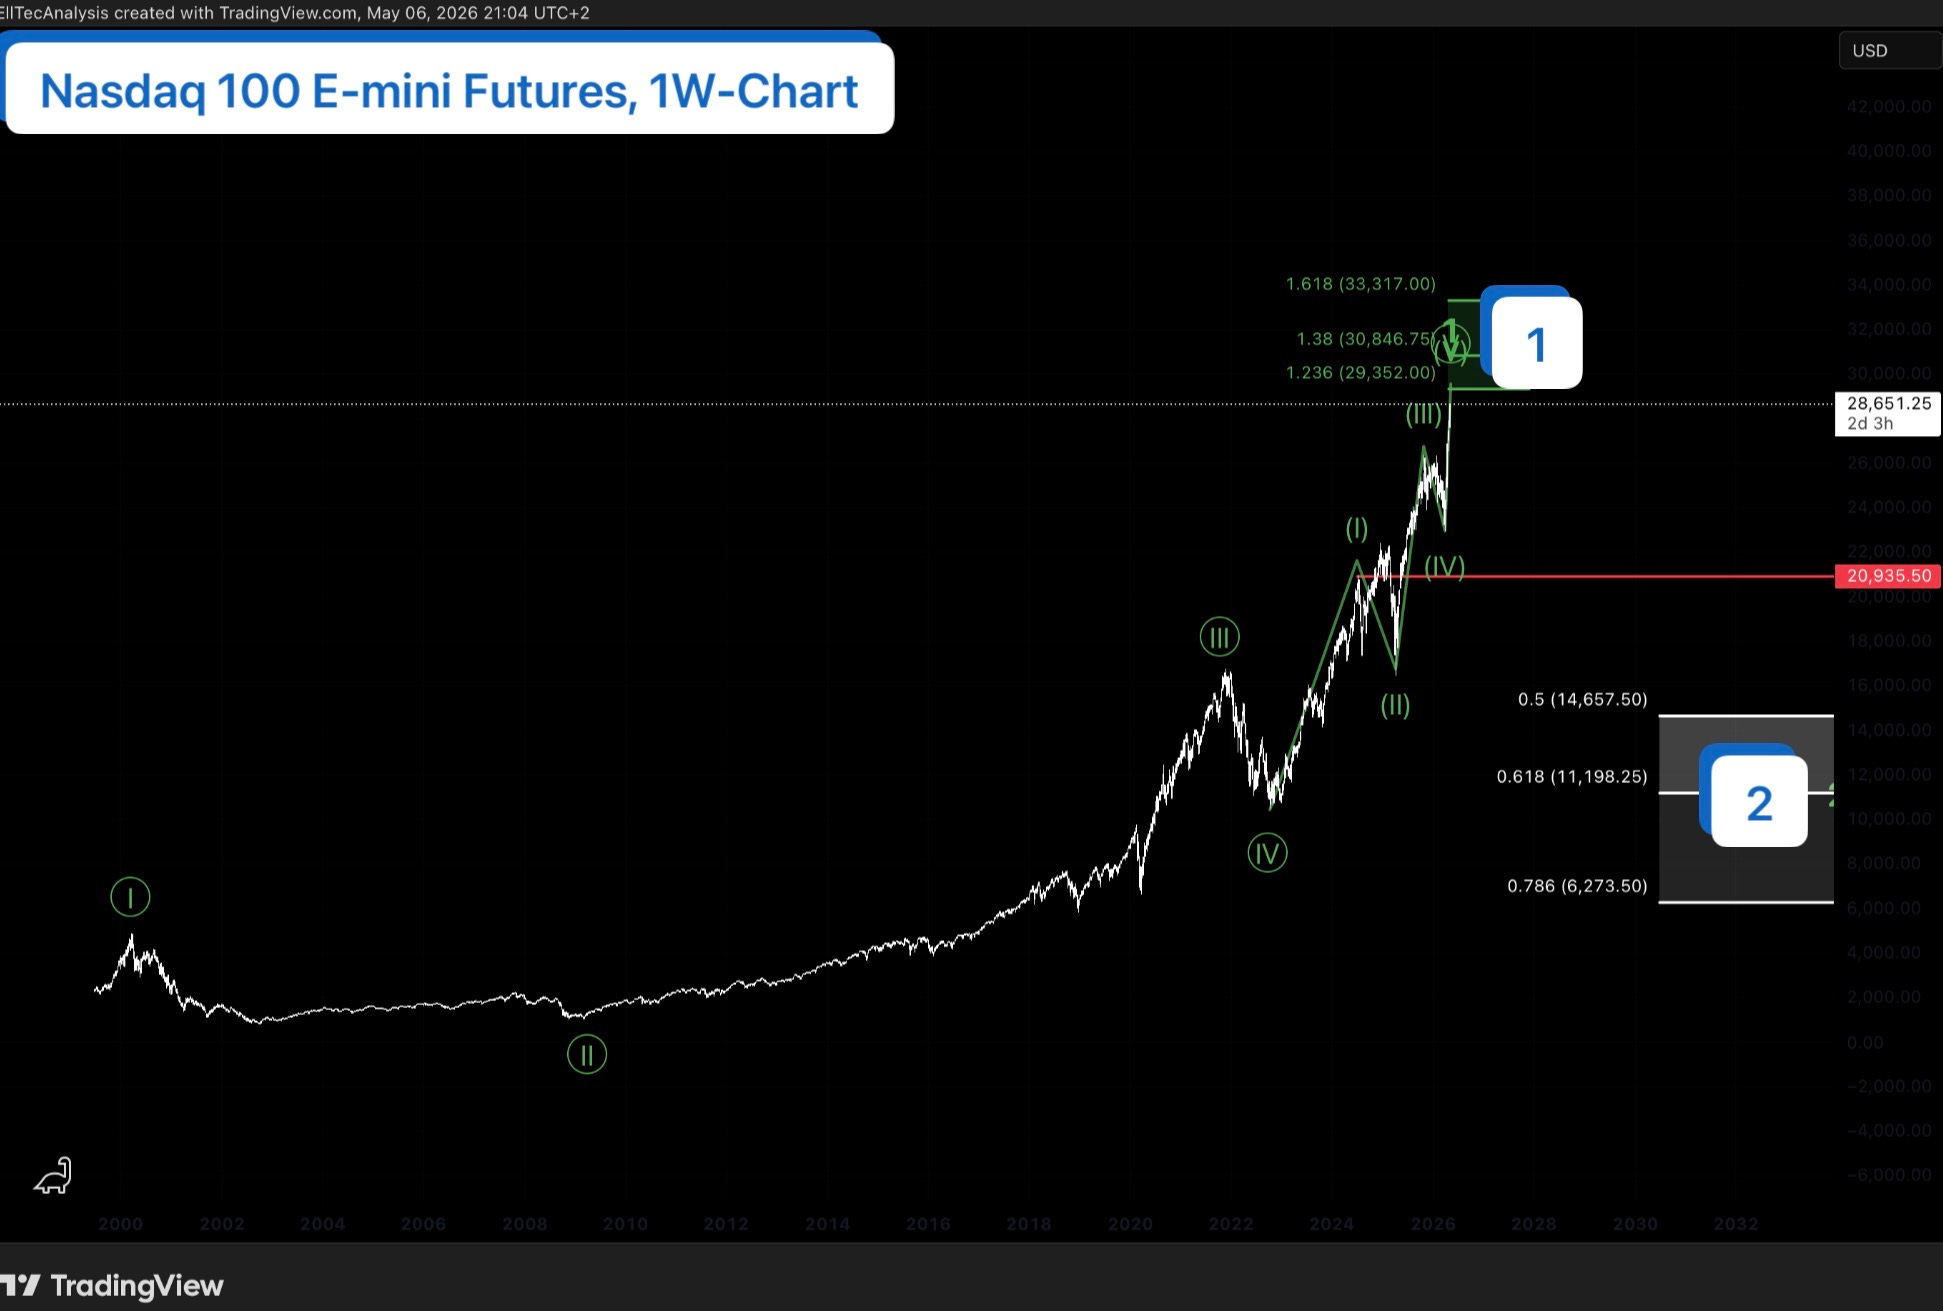
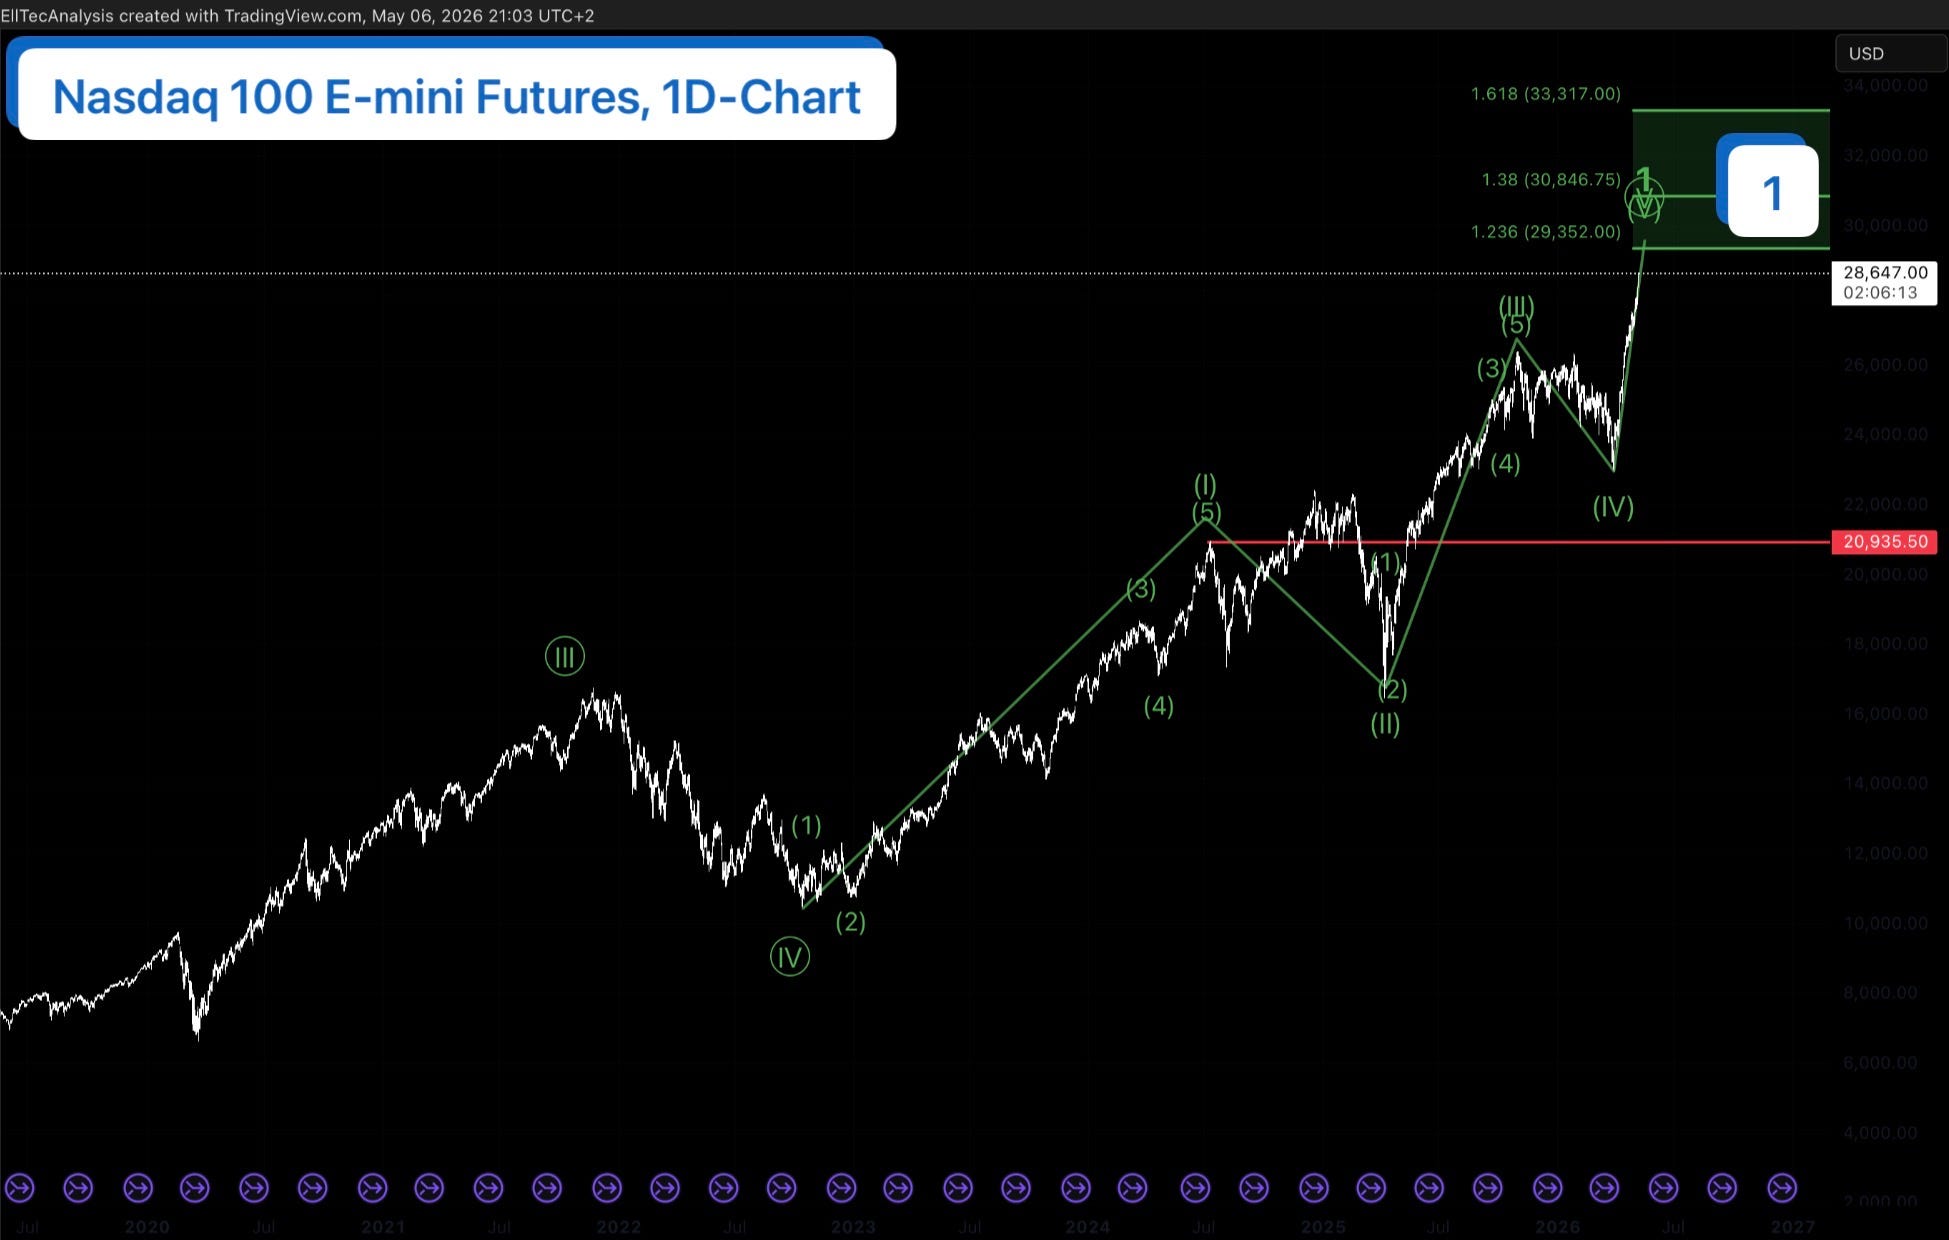
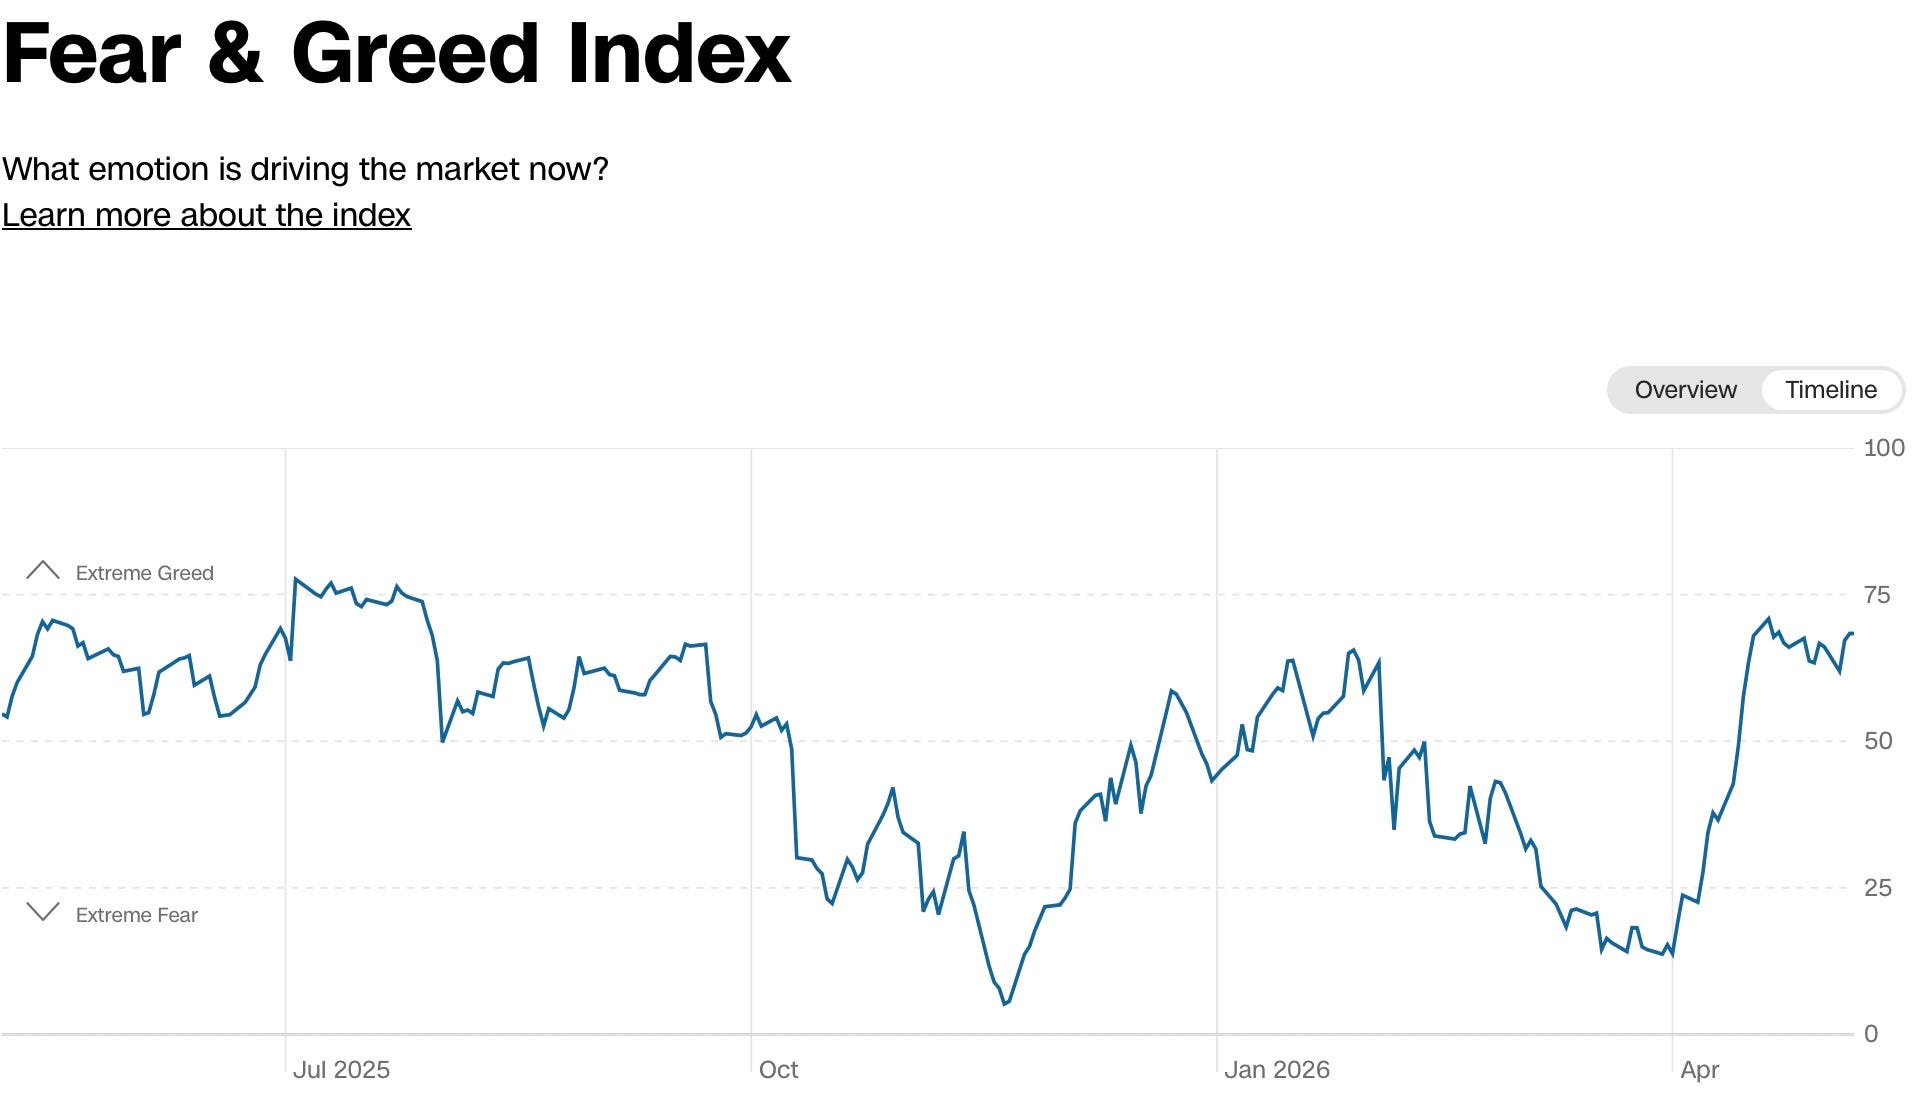
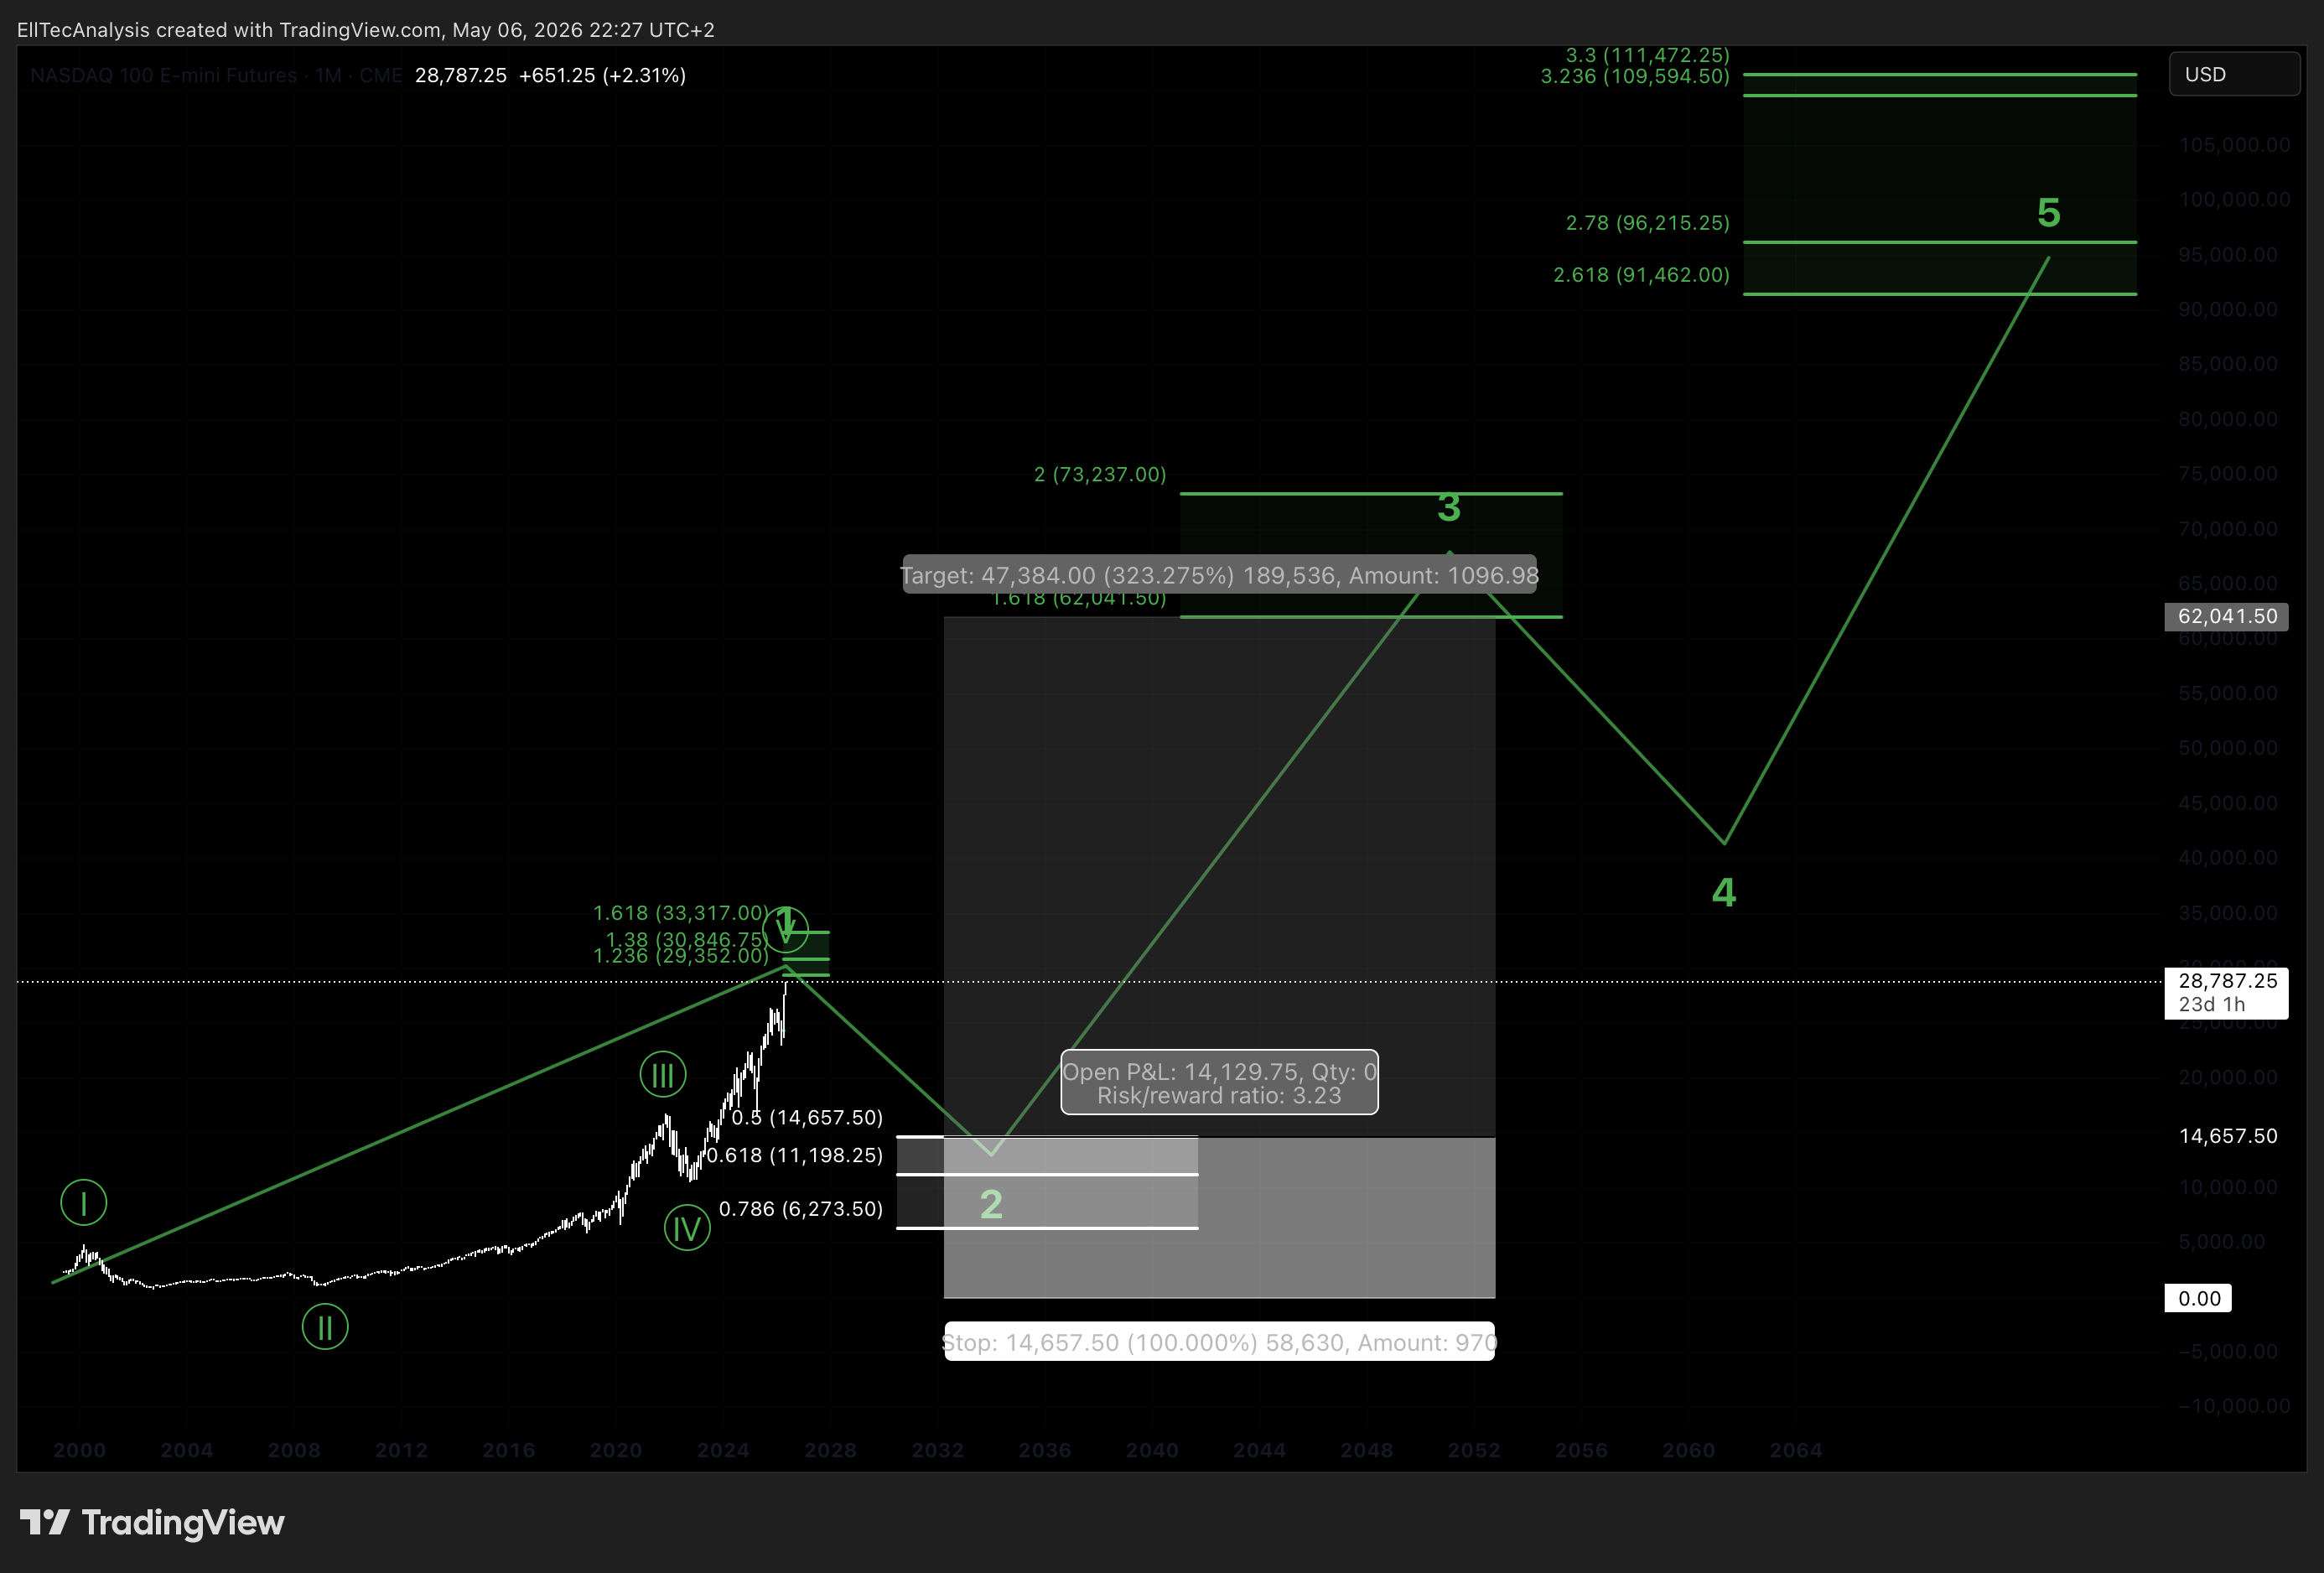
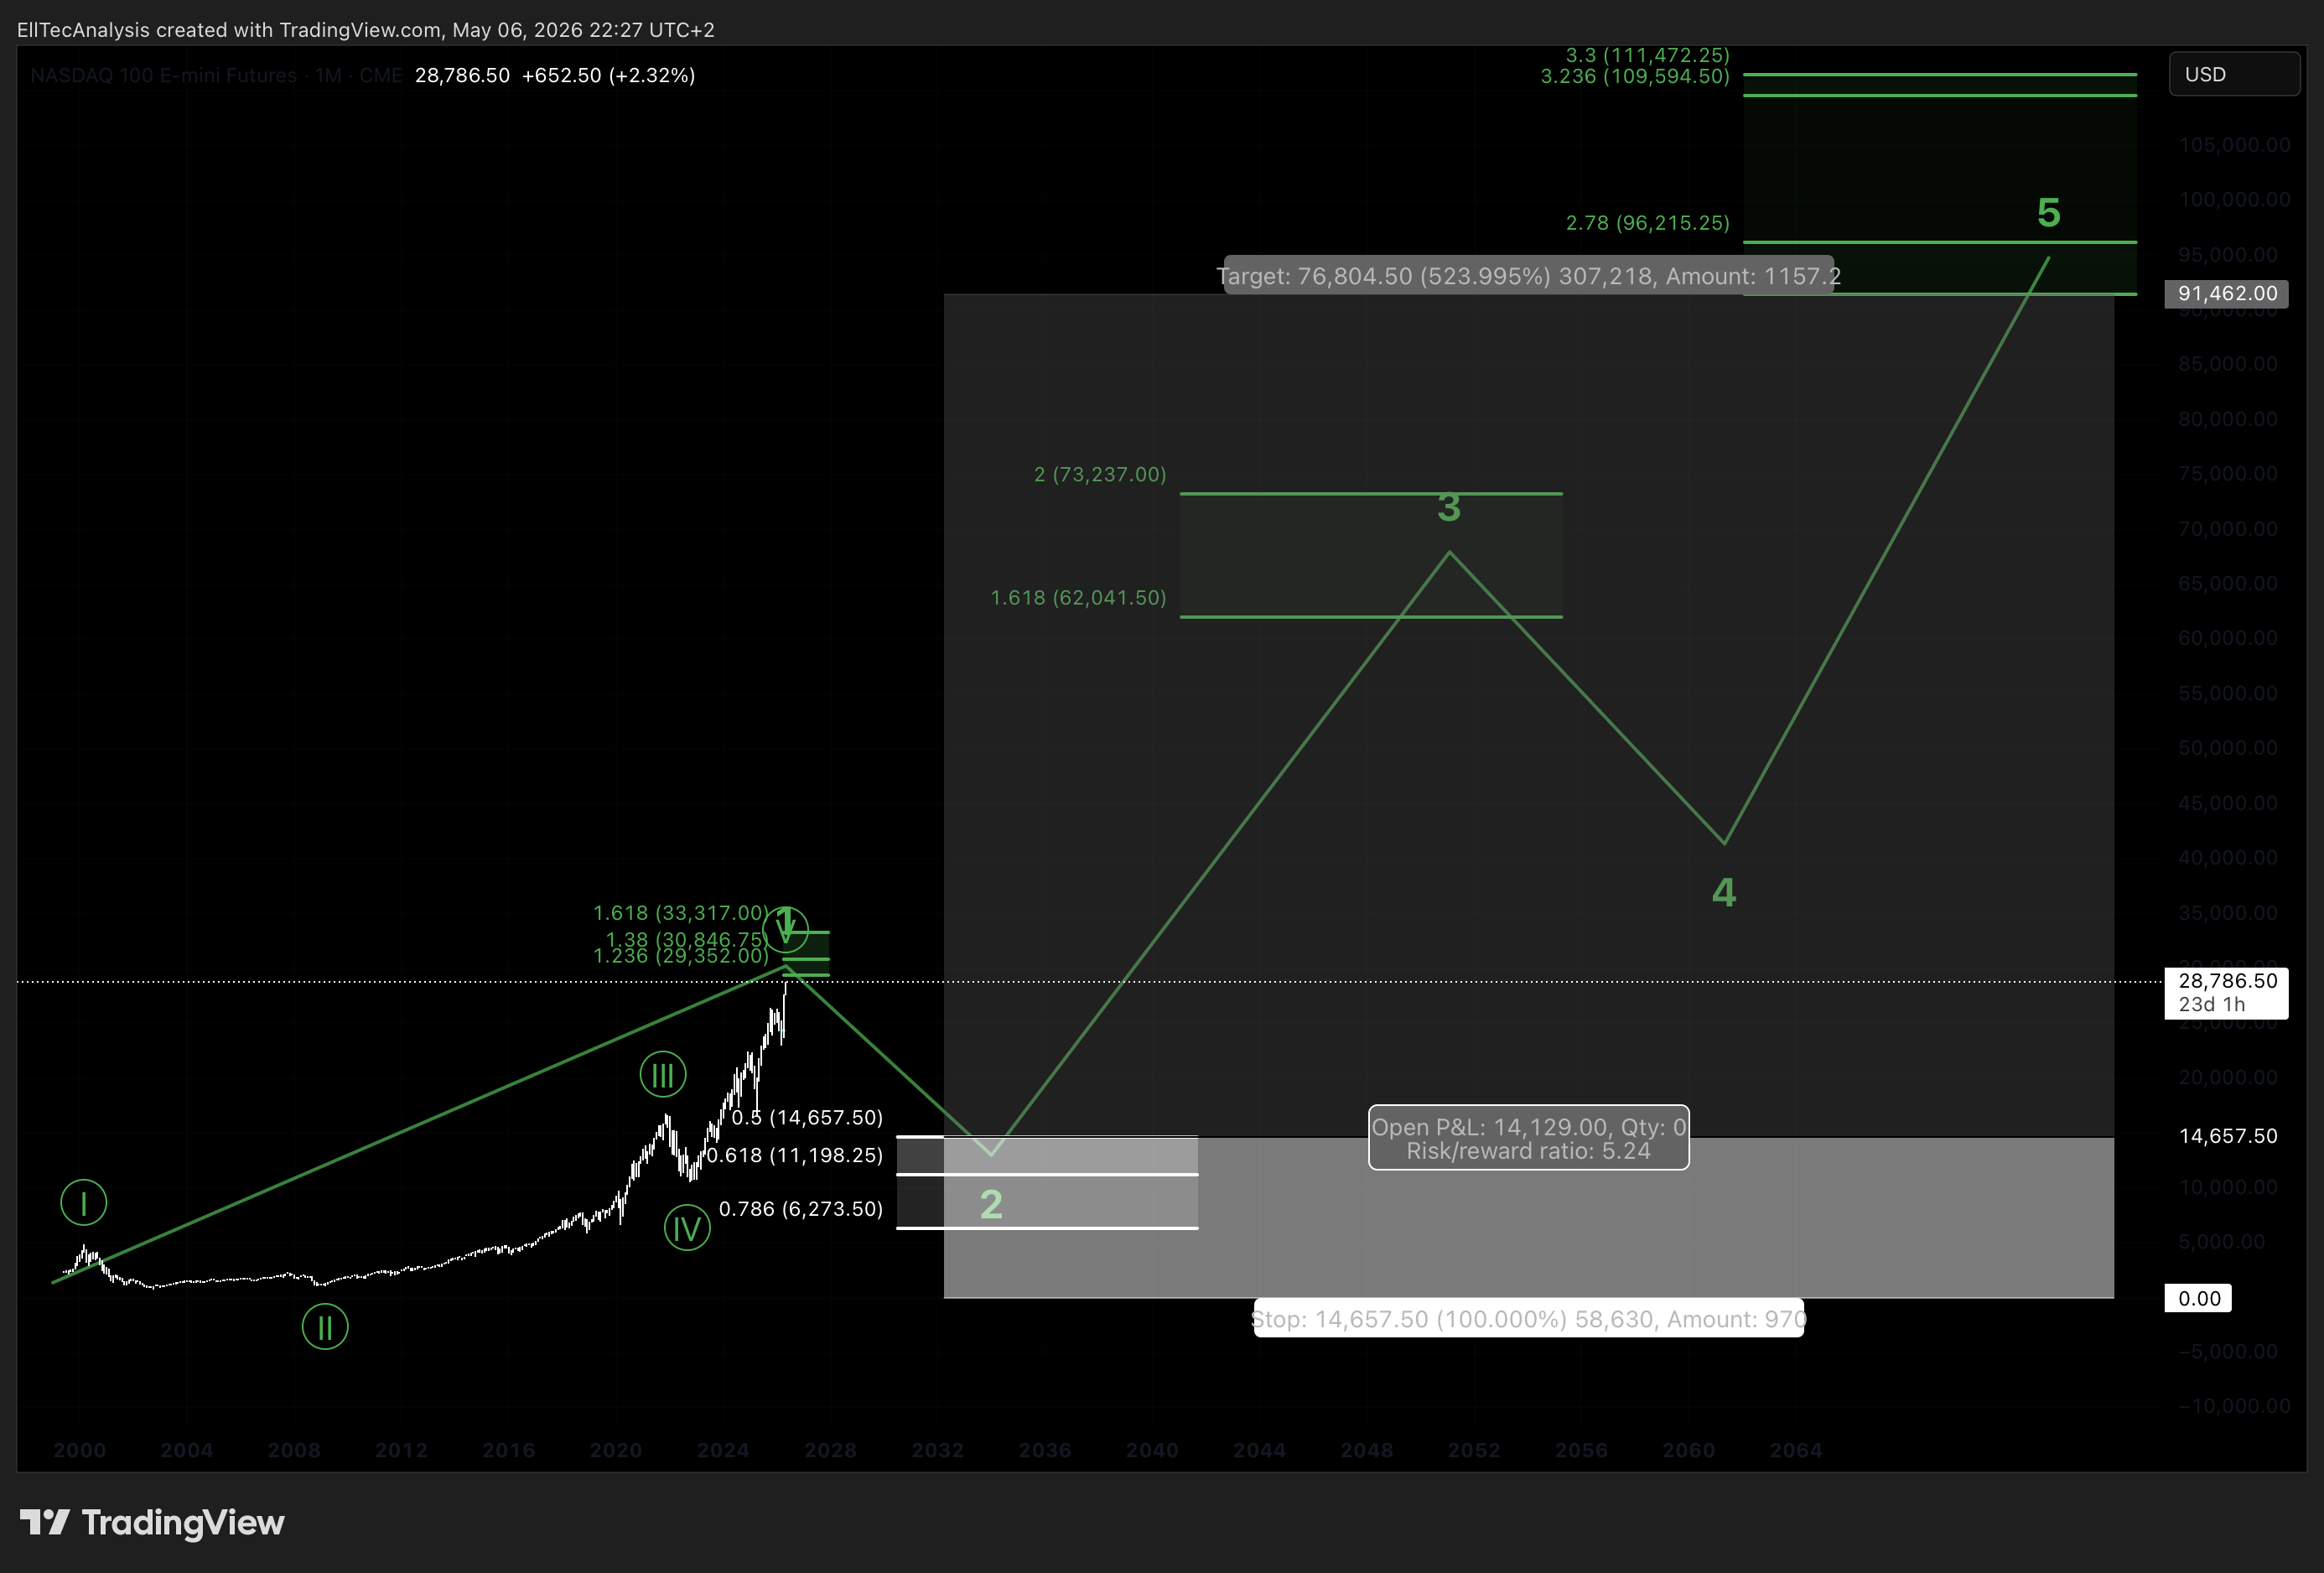
EllTec Analysis interprets the current structure as an impulsive sub-Wave 5 of an broader 5th Wave of a Supercycle Wave 1. This thesis is supported by a greed sentiment in the market and low - mid volatility. This creates the elusion the stock market just rises and rises safely.
3. Target Zones
Green Target Zone 1 represents a potential ending point for the Supercycle Wave 1
Lower boundary: 29,352 USD
Derived from 1.236% Fibonacci extension level (Wave 1 - Wave 2)
This zone represents the likely exhaustion point of the multi-year impulsive structure
The Target Zone 2 represents a potential turning point of a following Wave 2 correction. This Target Zone can be defined precisely, when the Supercycle Wave 1 completed.
Top boundry: approx. 14,700 USD
Derived from 50% Fibonacci retracement level
Target Zone 3 represents the price targets for a following Wave 3 extension
Lower boundry: approx. 62,000 USD
Derived from 1.618% Fibonacci extension level (Wave 1 - Wave 2)
Target Zone 4 represents the price targets for a following Wave 5 extension
Lower boundry: approx. 91,000 USD
Derived from 2.618% Fibonacci extension level (Wave 1 - Wave 2)
4. Potential Trade planning
Potential strategies:
1. Sell Long positions in the Target Zone 1
→ to avoid a the correction
→to have liquidity to entry in the Target Zone 2
2. Open Short Hedge
→ to limit the exposure in correction
→to have liquidity to entry in the Target Zone
—> EllTec Analysis would only use this stretegy for short term speculations and prefers Strategy 1
3.Entry in Target Zone 2 (Trades displayed above)
→use “discount area” to accumulate
→potential long term hold, over 500% into Target Zone 4 possible
4.Exit after Entry in Target Zone 2
50% exit at bottom boundry of Target Zone 3
full exit at bottom boundry of Target Zone 4 → potential major topping out area (Grand Supercycle 1)
5. Risk Assessment
EllTec Analysis assigns the Nasdaq 100 E-Mini Futures a Risk Score of 1/10.
Reasoning
Highly liquid, structurally stable index
Strong long-term secular growth trend in U.S. tech
Supported by institutional capital flows
Lower structural risk compared to individual equities
Despite short-term volatility driven by macro and geopolitical uncertainty, the index remains one of the most structurally robust global benchmarks.
6. Alternative Scenario
An alternative scenario would occur if:
price breaks sustainable above Target Zone 1
→ the structure would be invalidated, because Wave 1 and Wave 5 would be longer than Wave 3, this is not allowed in impulsive structures according to the Elliot Wave theory
→ reevaluation
→ further upwards potential
Conclusion
The Nasdaq 100 E-Mini Futures are currently positioned within a late-stage corrective Wave C of a a B-Wave correction, approaching a key structural exhaustion zone (small green zone). While short-term downside into the grey zone (completing the wave 4) remains likely, the broader structure supports a powerful mid-term recovery into Wave 5 expansion.
However, EllTec Analysis also emphasizes that this likely represents a late-cycle environment, where eventual supercycle tops should be expected in higher Fibonacci extension zones, followed by a large-scale macro correction phase.
Disclaimer
This analysis is for informational purposes only and does not constitute financial advice. All information is provided without guarantee. Markets involve risks, and past performance is not indicative of future results. Please do your own research or consult a licensed advisor. EllTec Analysis assumes no liability for decisions based on this content.