

XPeng Inc.
THE AI MOBILITY INFLECTION


SECTION 01
Fundamentals
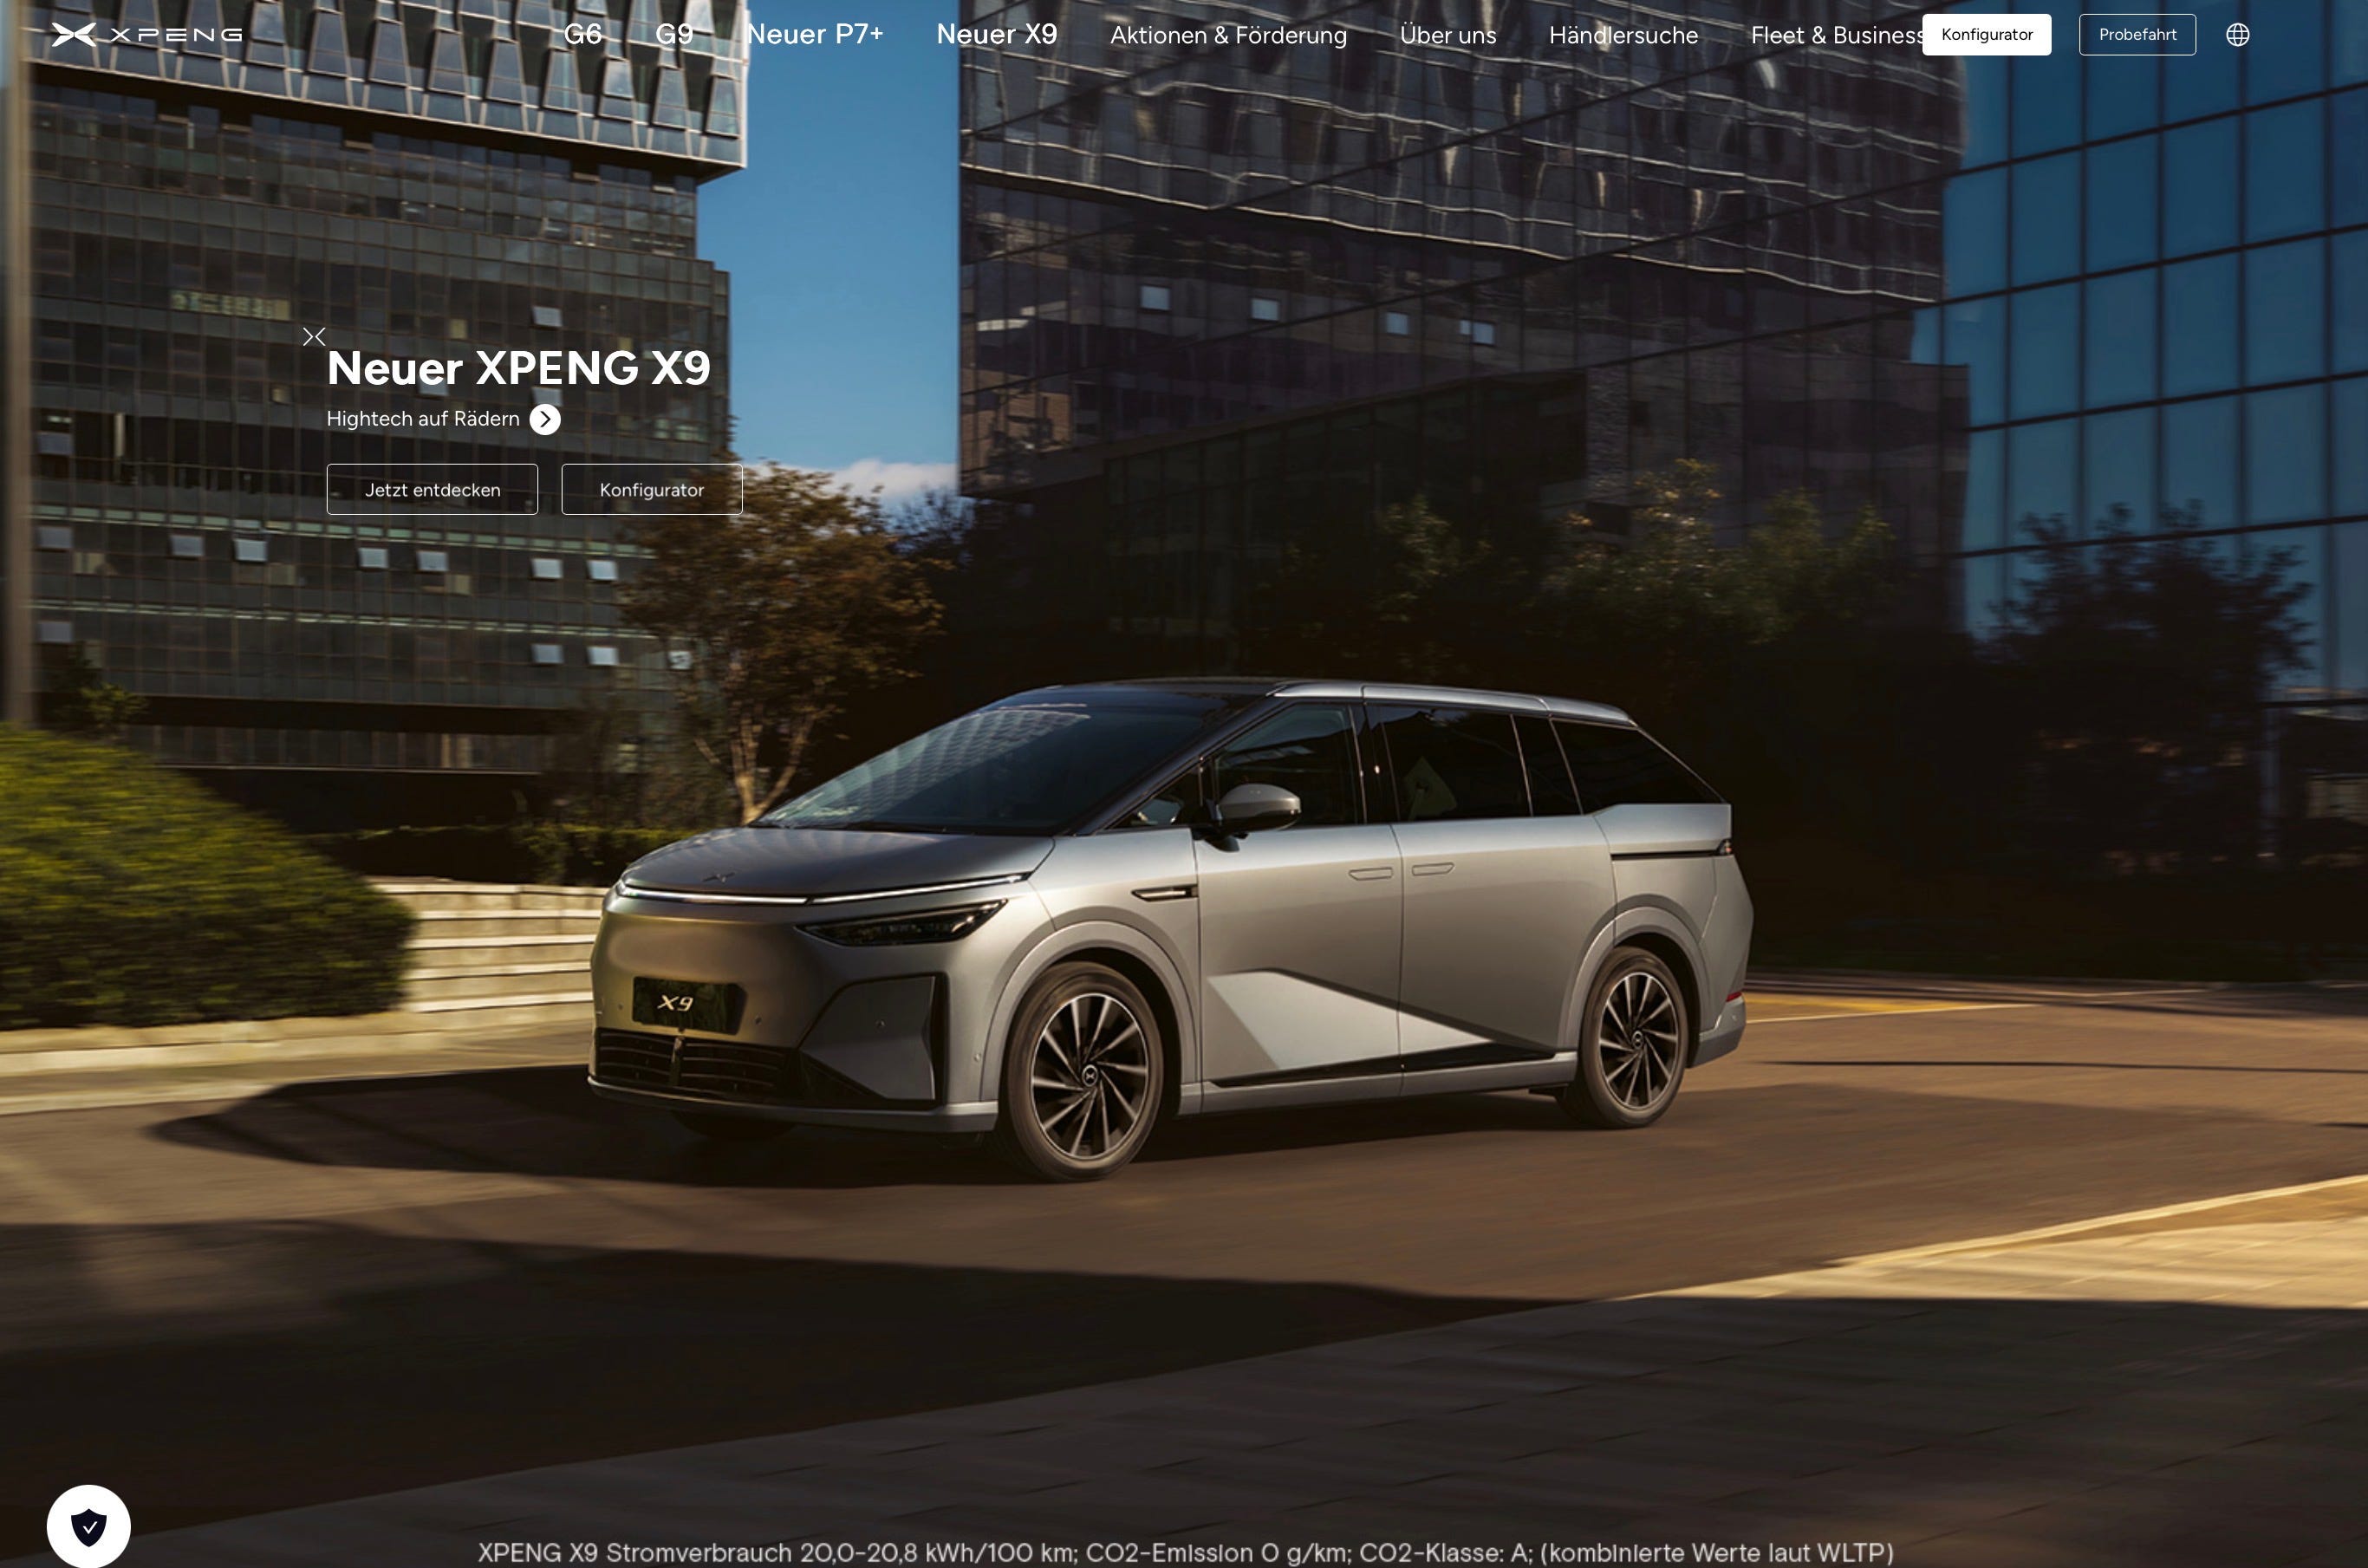

XPeng Inc. (ISIN: US98422D1054) is a Guangzhou-based smart electric vehicle company listed on the NYSE under the ticker XPEV and on the Hong Kong Exchange under 9868. Founded in 2014, the company designs, manufactures, and markets a portfolio of intelligent EVs spanning sedans, SUVs, and premium MPVs, with its core customer base concentrated among China’s technology-oriented middle class. What distinguishes XPeng from the broader field of Chinese EV producers is its ambition to function not merely as an automaker but as an AI-defined mobility platform: the company develops its full-stack advanced driver assistance system, its in-car operating system, its powertrain architecture, and its electrical and electronic backbone entirely in-house. This vertical integration creates a compounding technology advantage that becomes more defensible with each software iteration and each incremental improvement in autonomous capability.
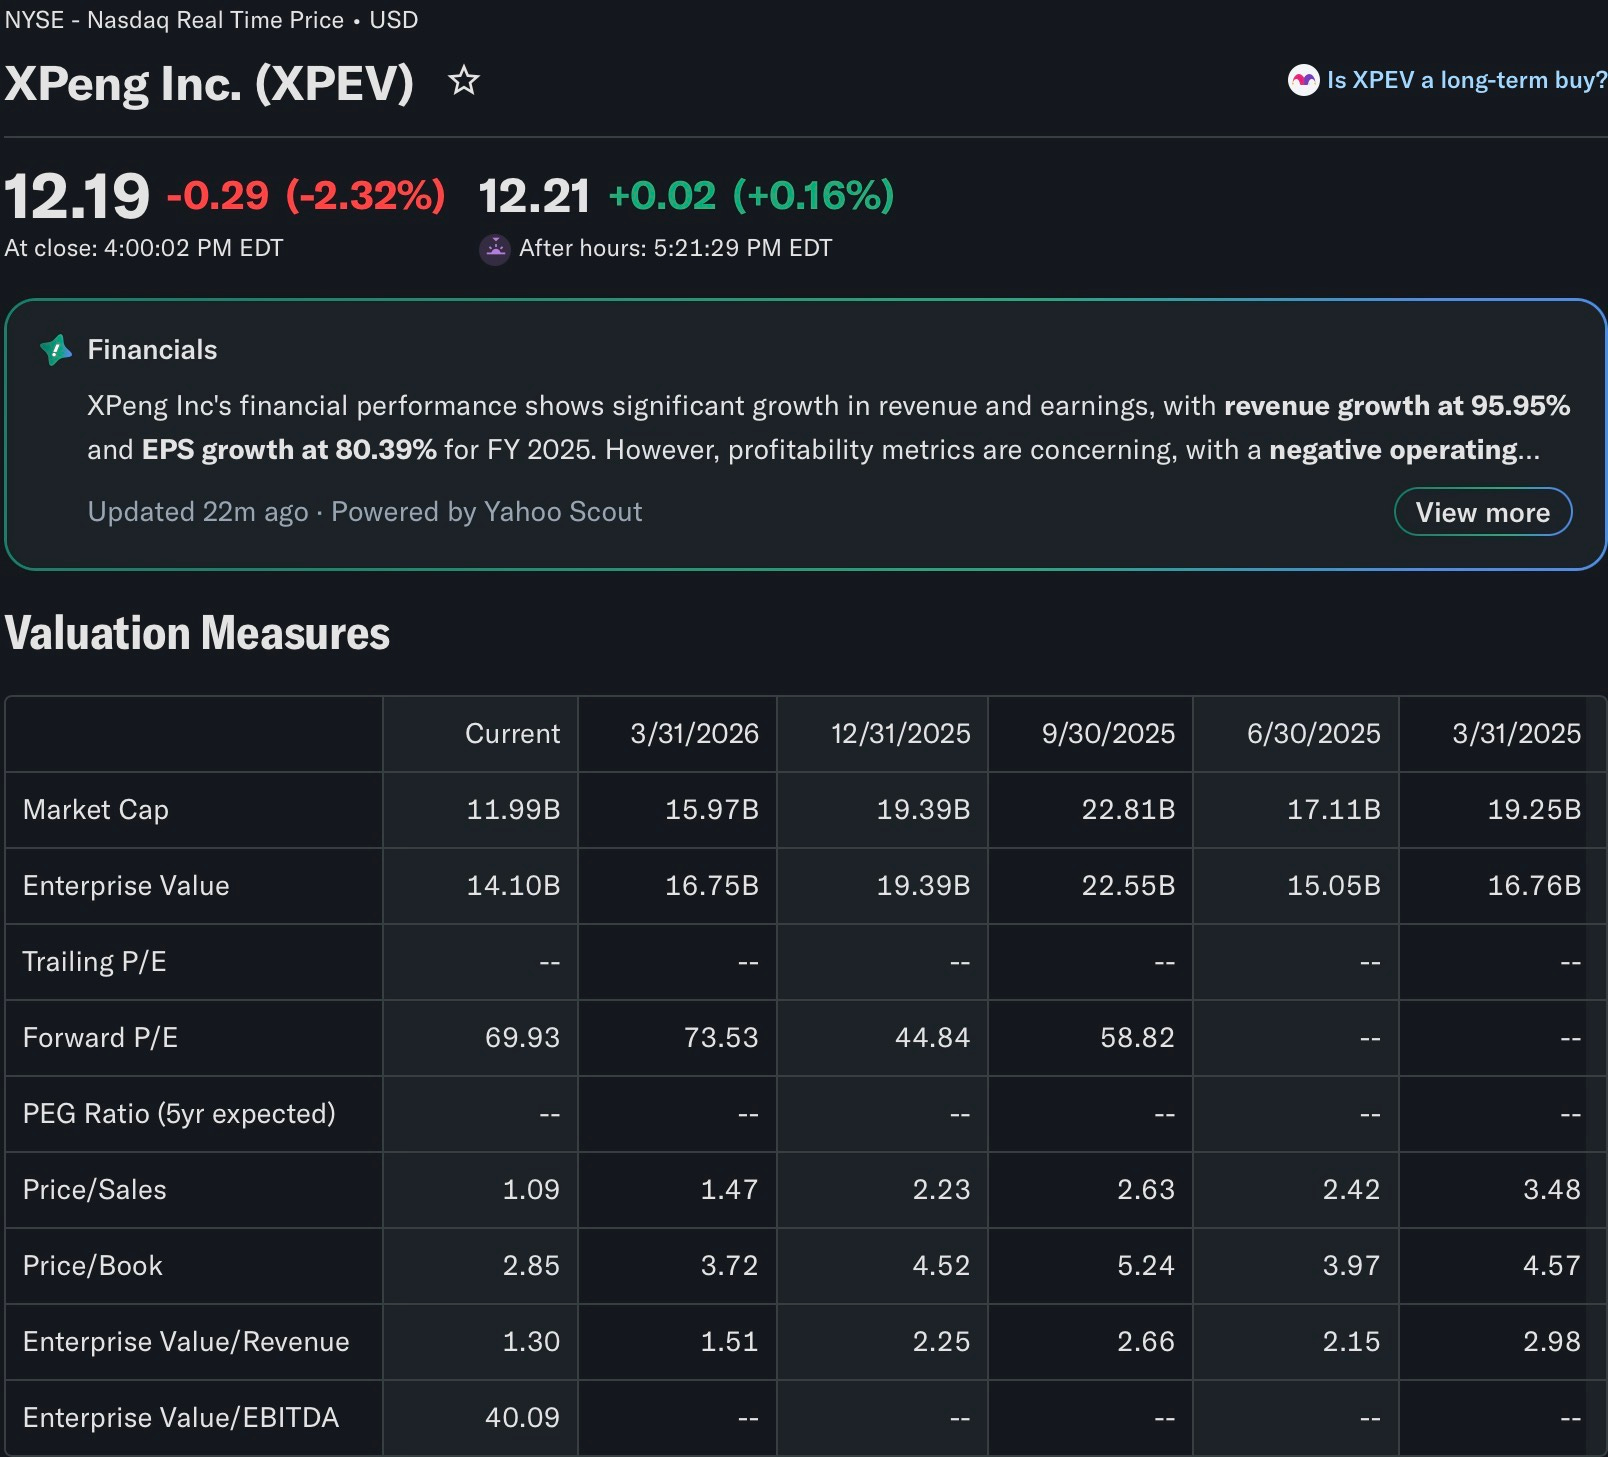
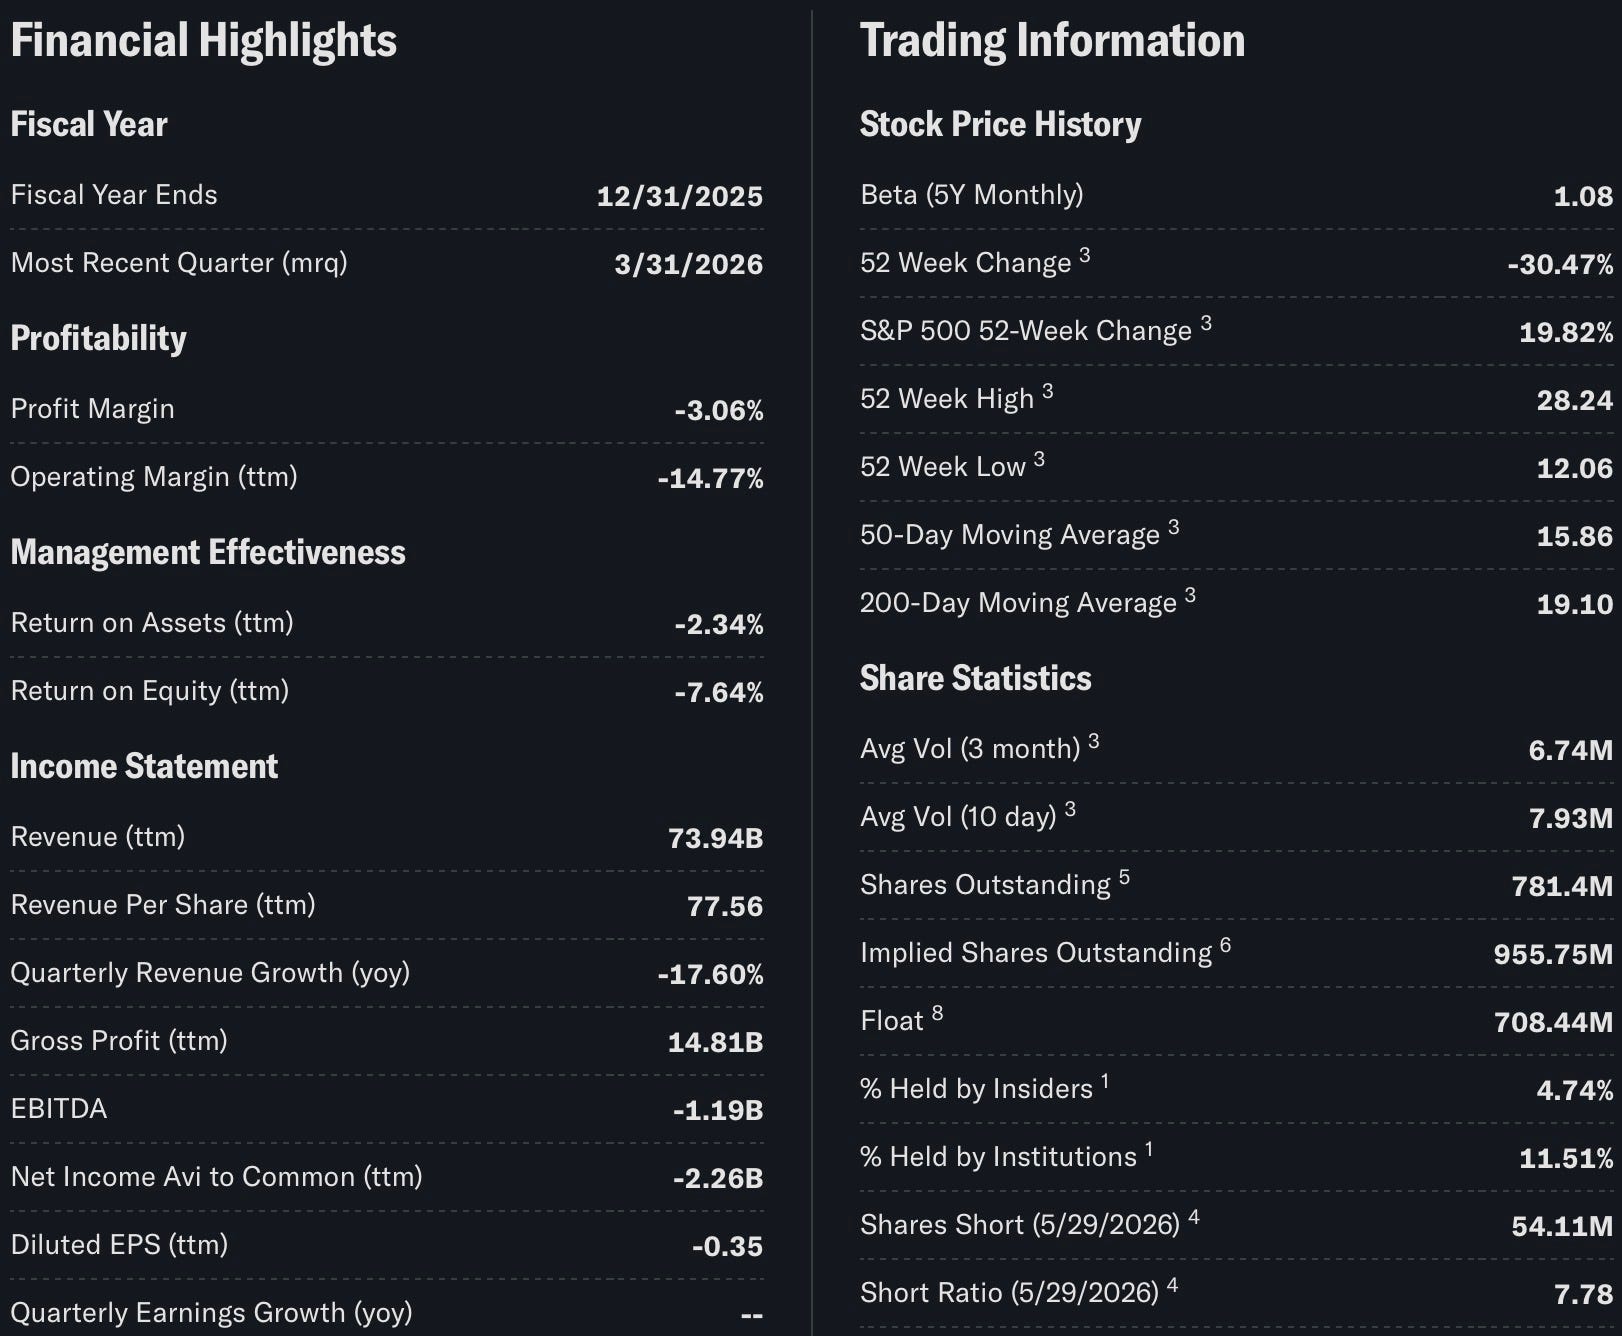
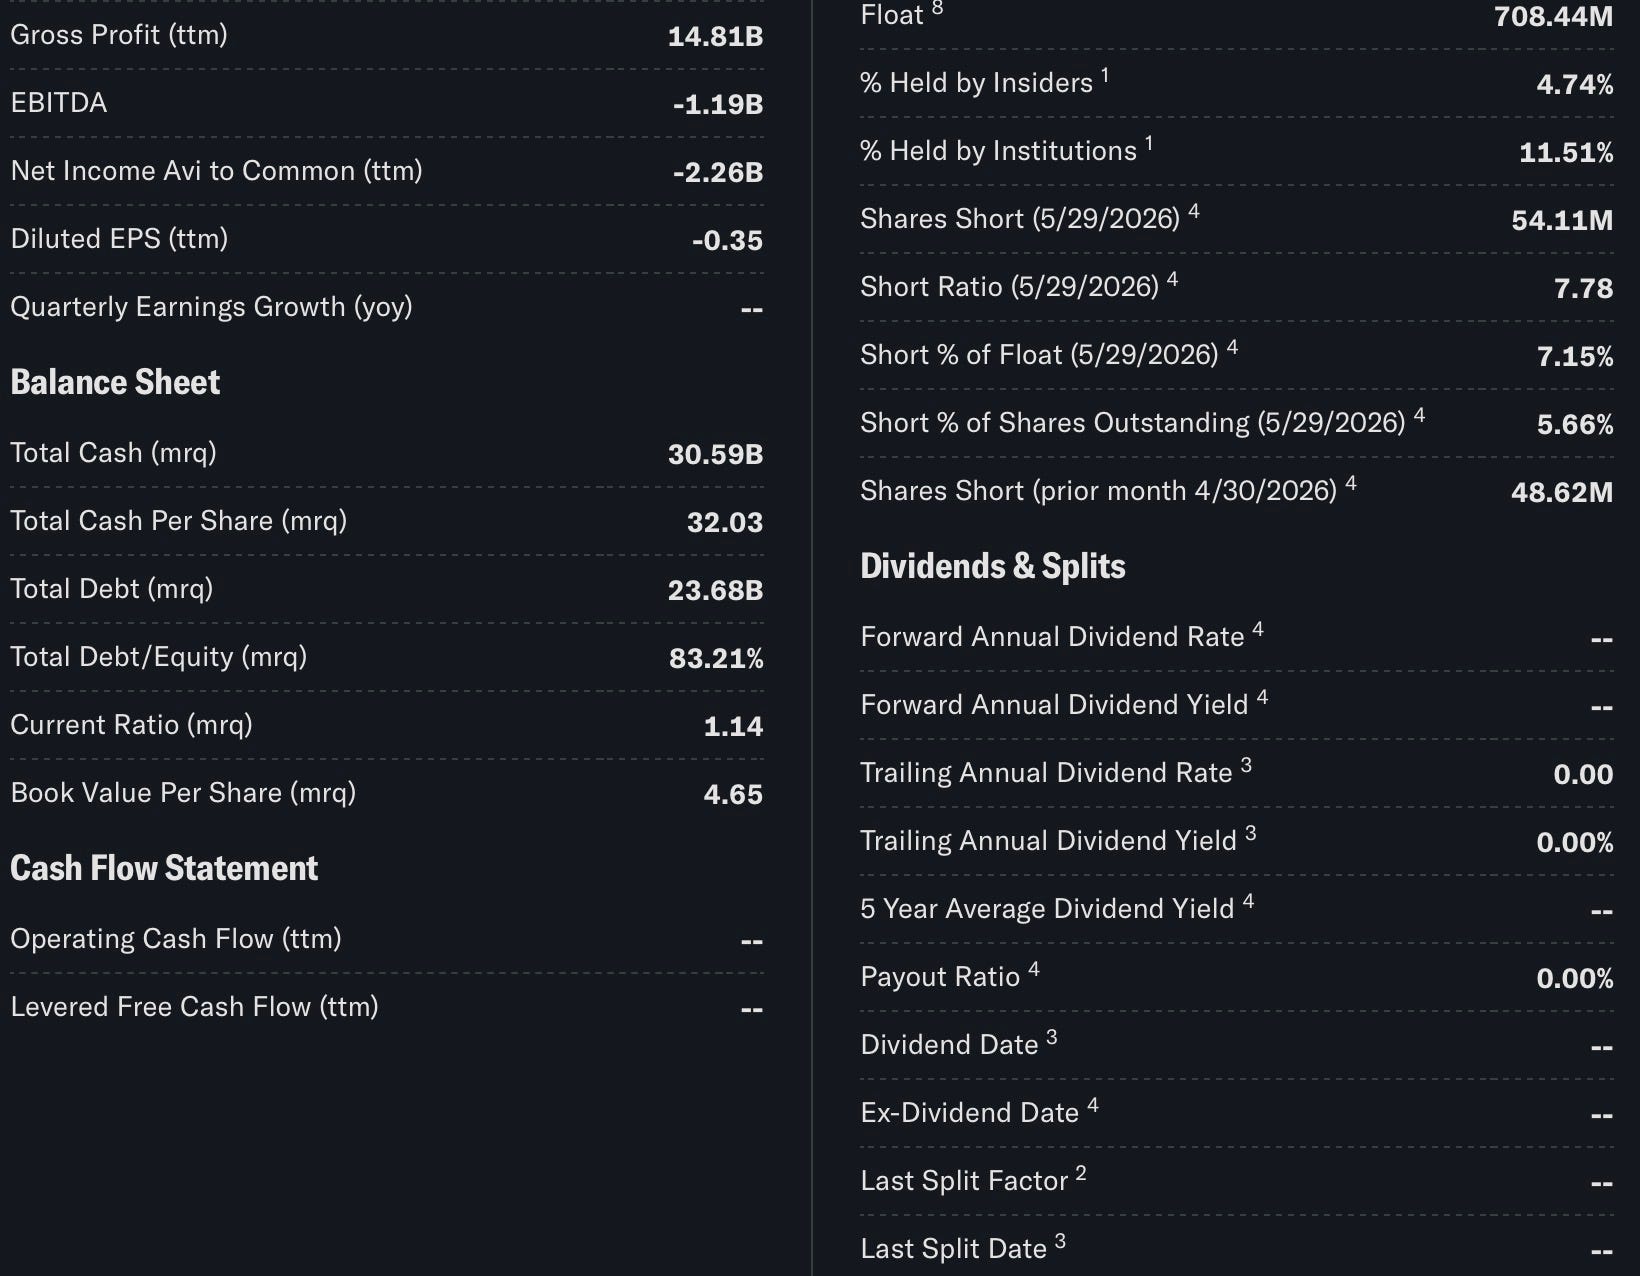
The financial trajectory through 2025 has been exceptional by any objective standard. Total revenues for the third quarter of 2025 reached RMB 20.38 billion, representing a 101.8% year-over-year increase. Gross margin expanded to 20.1%, a gain of 4.8 percentage points versus the same period of the prior year, while vehicle margin improved to 13.1%. Delivery volumes have accelerated sharply: XPeng surpassed its entire 2024 delivery total within the first half of 2025 alone, delivering 197,189 vehicles in that period. The September 2025 monthly figure of 41,581 units set a new company record, and cumulative deliveries through November 2025 reached 391,937 units. The company entered this cycle with a cash and liquid investment position of RMB 48.33 billion as of September 2025, providing significant runway for continued product investment and global expansion.
The global dimension of XPeng’s strategy has moved from aspiration to operational reality. As of mid-2025, the company had established a presence in more than 40 countries and regions, with a stated ambition to reach 60 markets and over 300 global service outlets by end of year. Right-hand drive manufacturing has commenced in Indonesia, and a Munich research and development center has been established as the foundation for European co-development. The Turing AI Intelligent Driving System is entering its global adaptation phase in 2026, with mass-produced Level 4 autonomous driving capability targeted for the same period. Beyond vehicles, XPeng unveiled its VLA 2.0 AI driving model, a robotaxi program, and its humanoid robot IRON at its 2025 AI Day event, each scheduled for mass production in 2026. These initiatives position XPeng not as a pure EV manufacturer subject to commoditization pressure, but as a platform business whose software, data, and AI layers generate recurring value independent of vehicle unit economics.
The macro environment for XPeng presents a mixed but ultimately constructive backdrop. Domestic Chinese EV penetration continues to rise as the infrastructure layer matures and price competition intensifies across the segment. XPeng’s MONA M03 Max, launched in May 2025 at the RMB 150,000 price point with full urban ADAS capability, represents a deliberate move to democratize intelligent driving and capture volume at a lower price tier. Geopolitically, the risk of tariffs and market access restrictions in Western markets is real but partially offset by the company’s strategy of establishing local manufacturing and R&D presence. Interest rate dynamics in China remain accommodative relative to global peers, supporting consumer financing and infrastructure investment. Taken together, the fundamental picture is that of a company that has resolved its prior existential volume and profitability questions and is now executing a multi-year technology-led expansion that the market has not yet fully priced in.
SECTION 02
Correlations
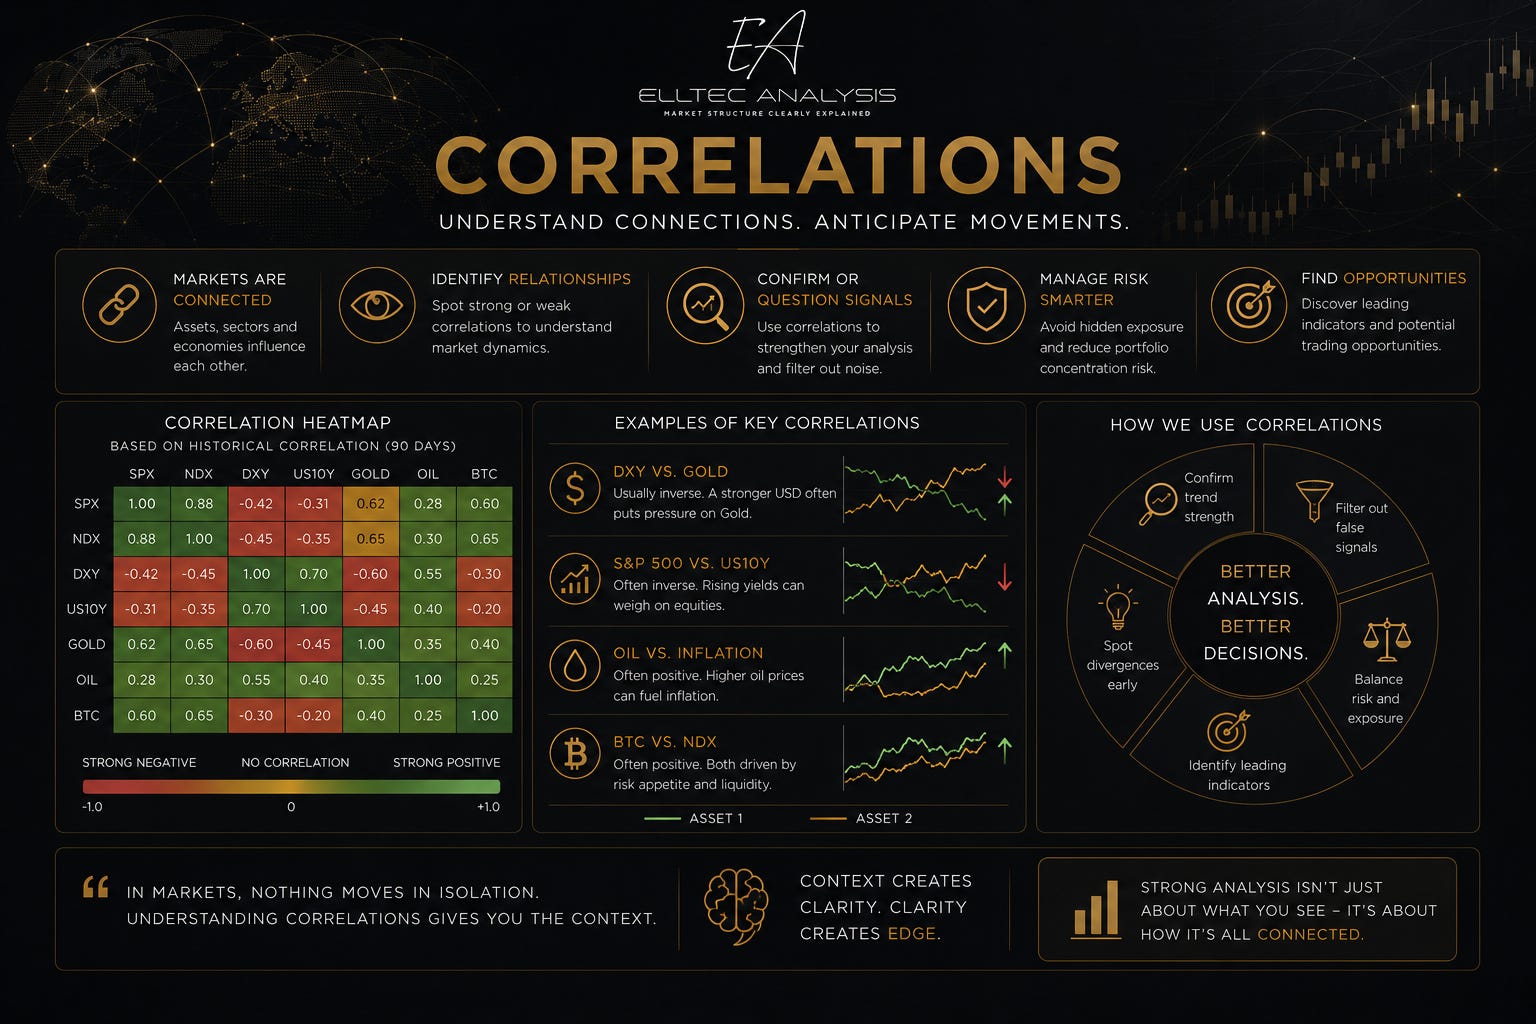
The correlation structure of XPEV is multi-layered and highly regime-dependent, reflecting the stock’s dual identity as a Chinese growth asset and a global technology name.
GLOBAL RISK SENTIMENT (RISK-ON / RISK-OFF)
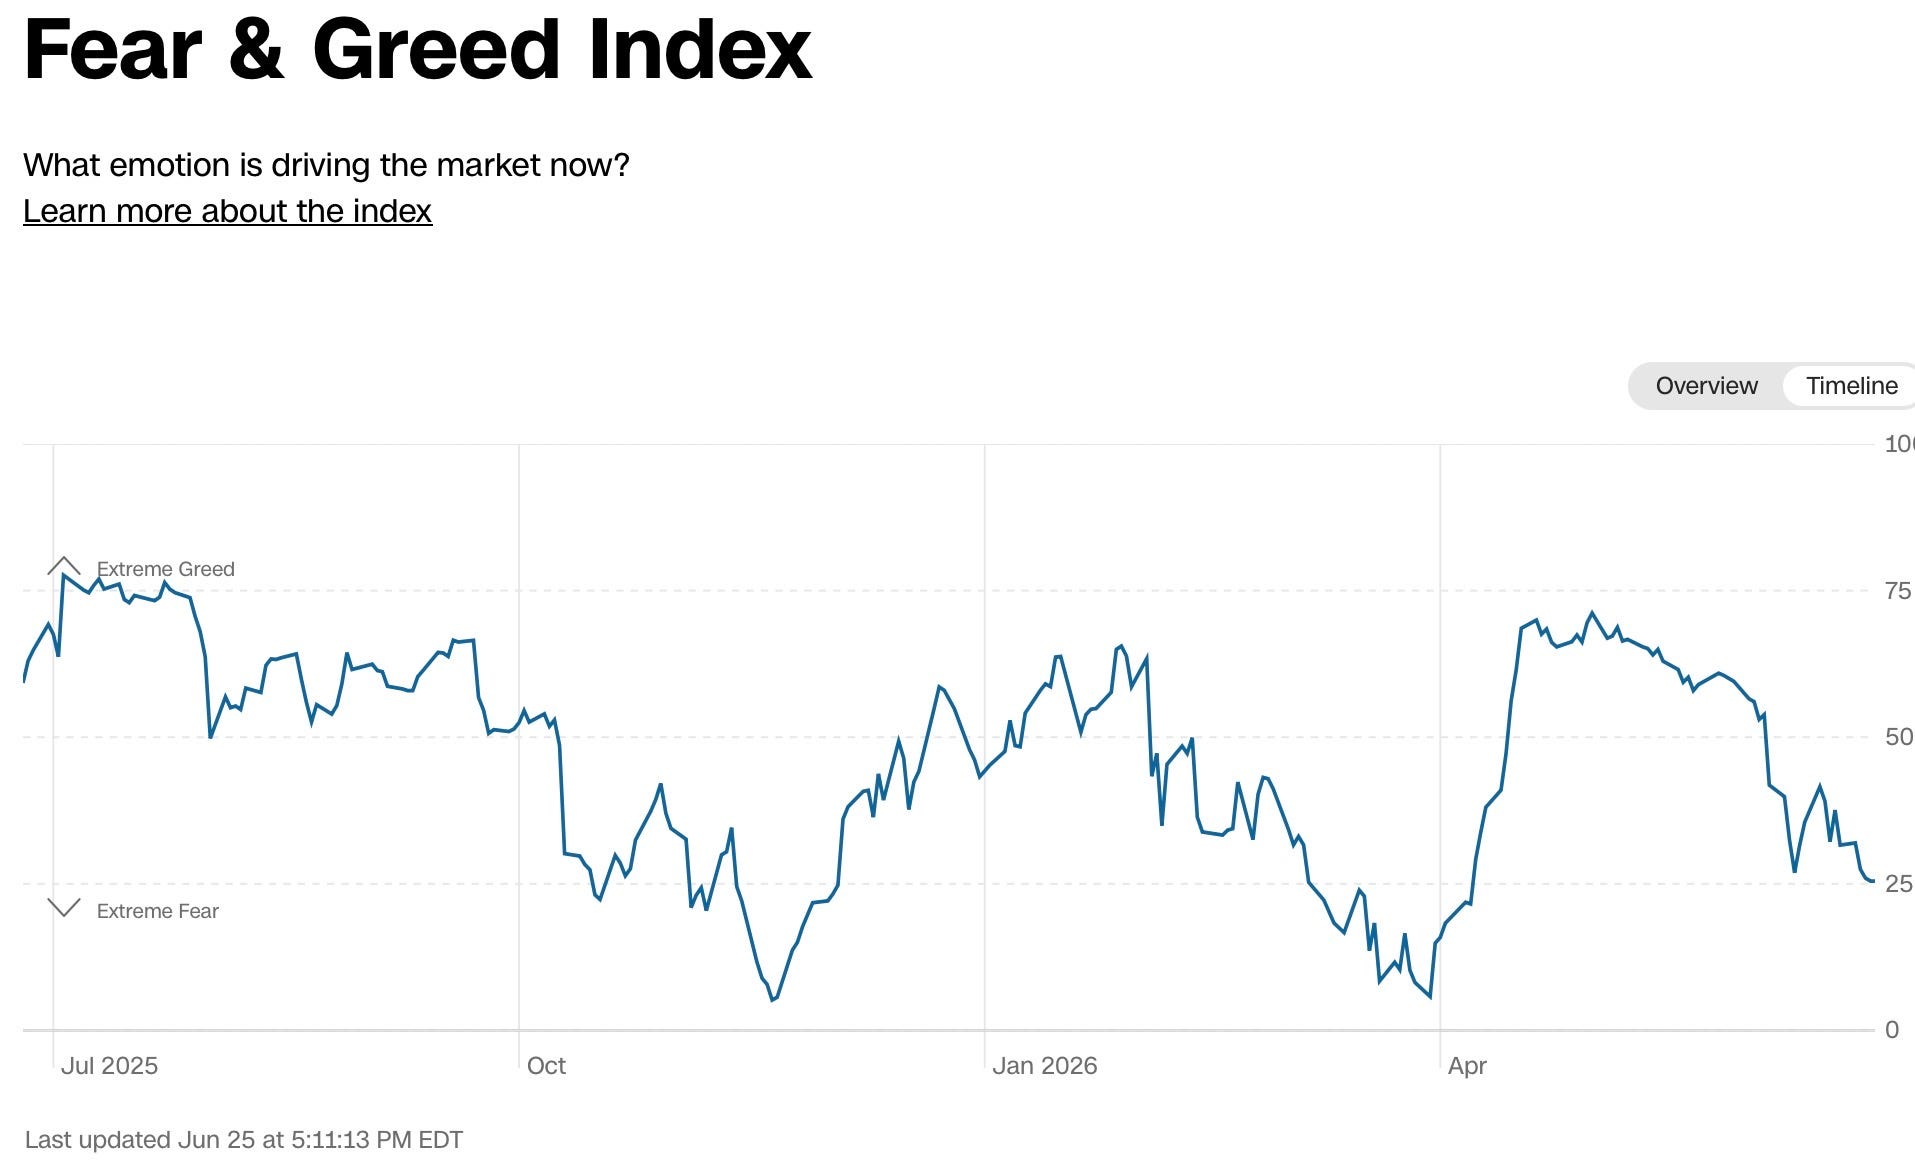
XPEV exhibits a pronounced sensitivity to global risk appetite. In risk-on regimes, the stock tends to outperform as capital rotates into high-beta, high-growth names; in risk-off environments, the de-rating is typically amplified relative to broader equity benchmarks, as thin domestic institutional ownership and elevated short interest accelerate directional moves. This relationship makes macro regime identification a prerequisite for timing any structural entry.
Hang Seng Index (HSI)
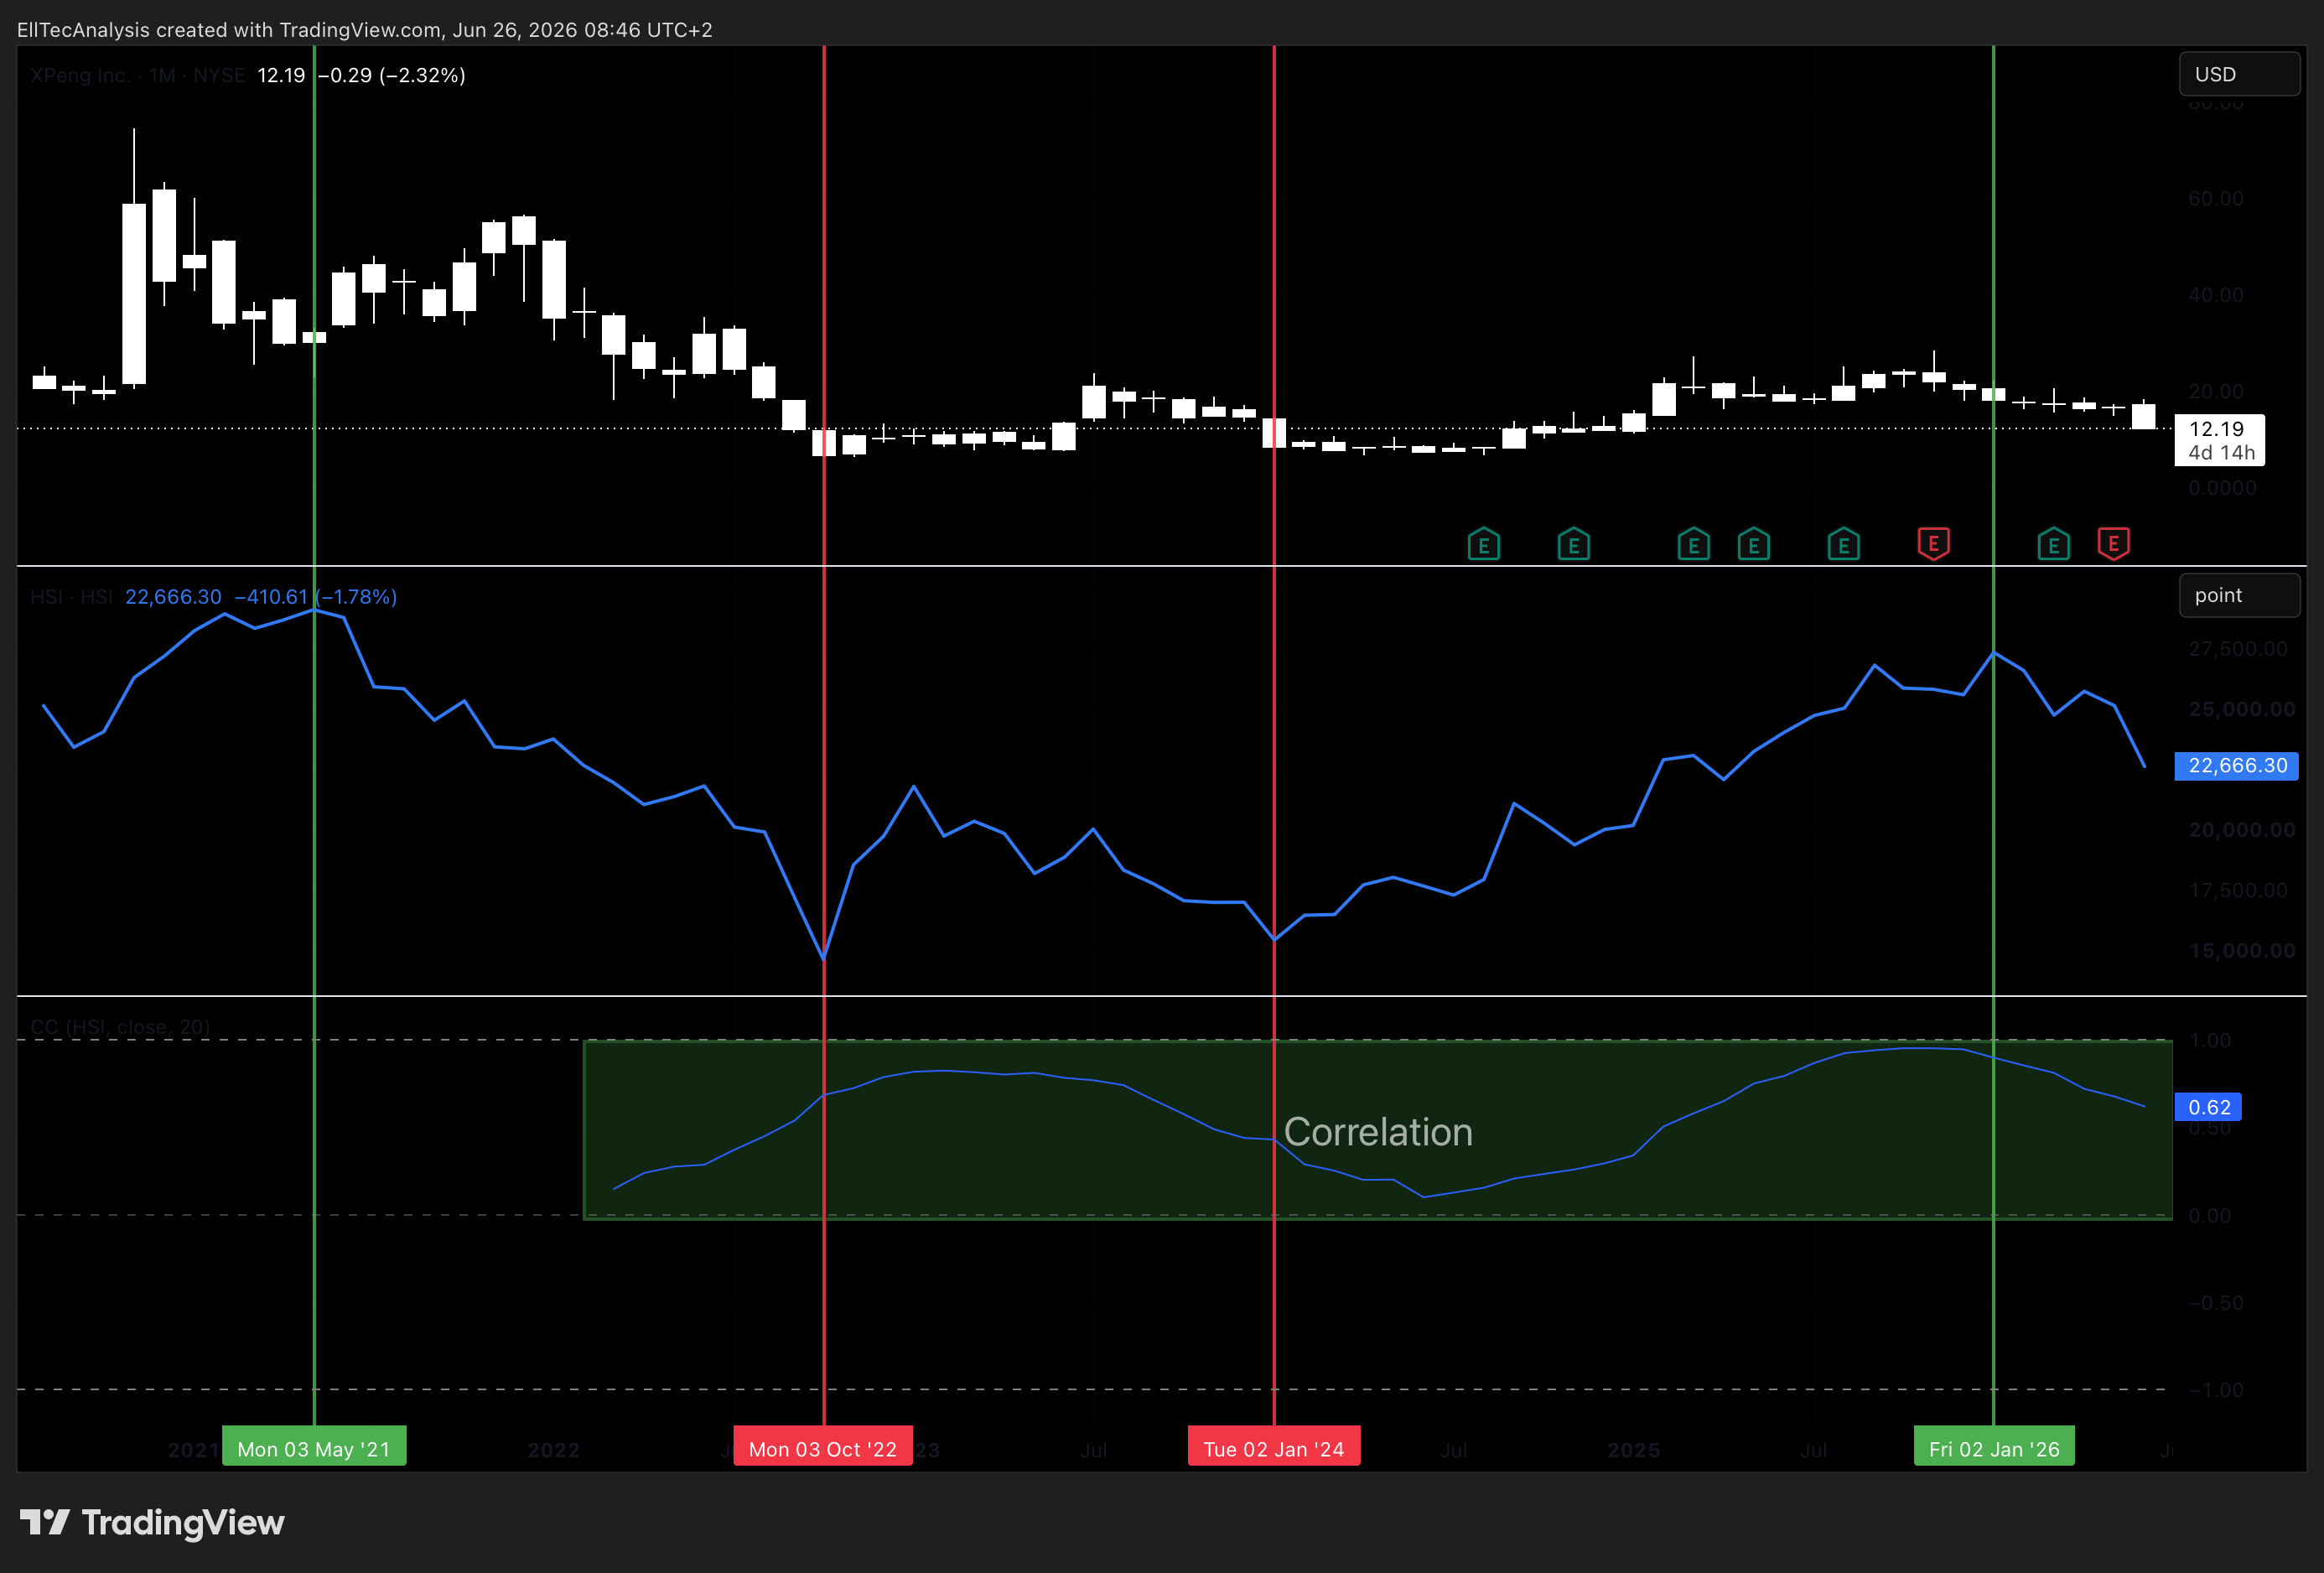
XPEV maintains a strong and persistent correlation with the broader Chinese equity complex. Periods of divergence, where XPEV meaningfully underperforms the HSI, have historically resolved in favor of mean reversion. A strong HSI performance makes it very likely that XPeng will perform too. The primary Elliot Wave scenario for the HSI and XPeng adds upp pretty well and gives confluence.
More about the HSI:

US DOLLAR INDEX (DXY)
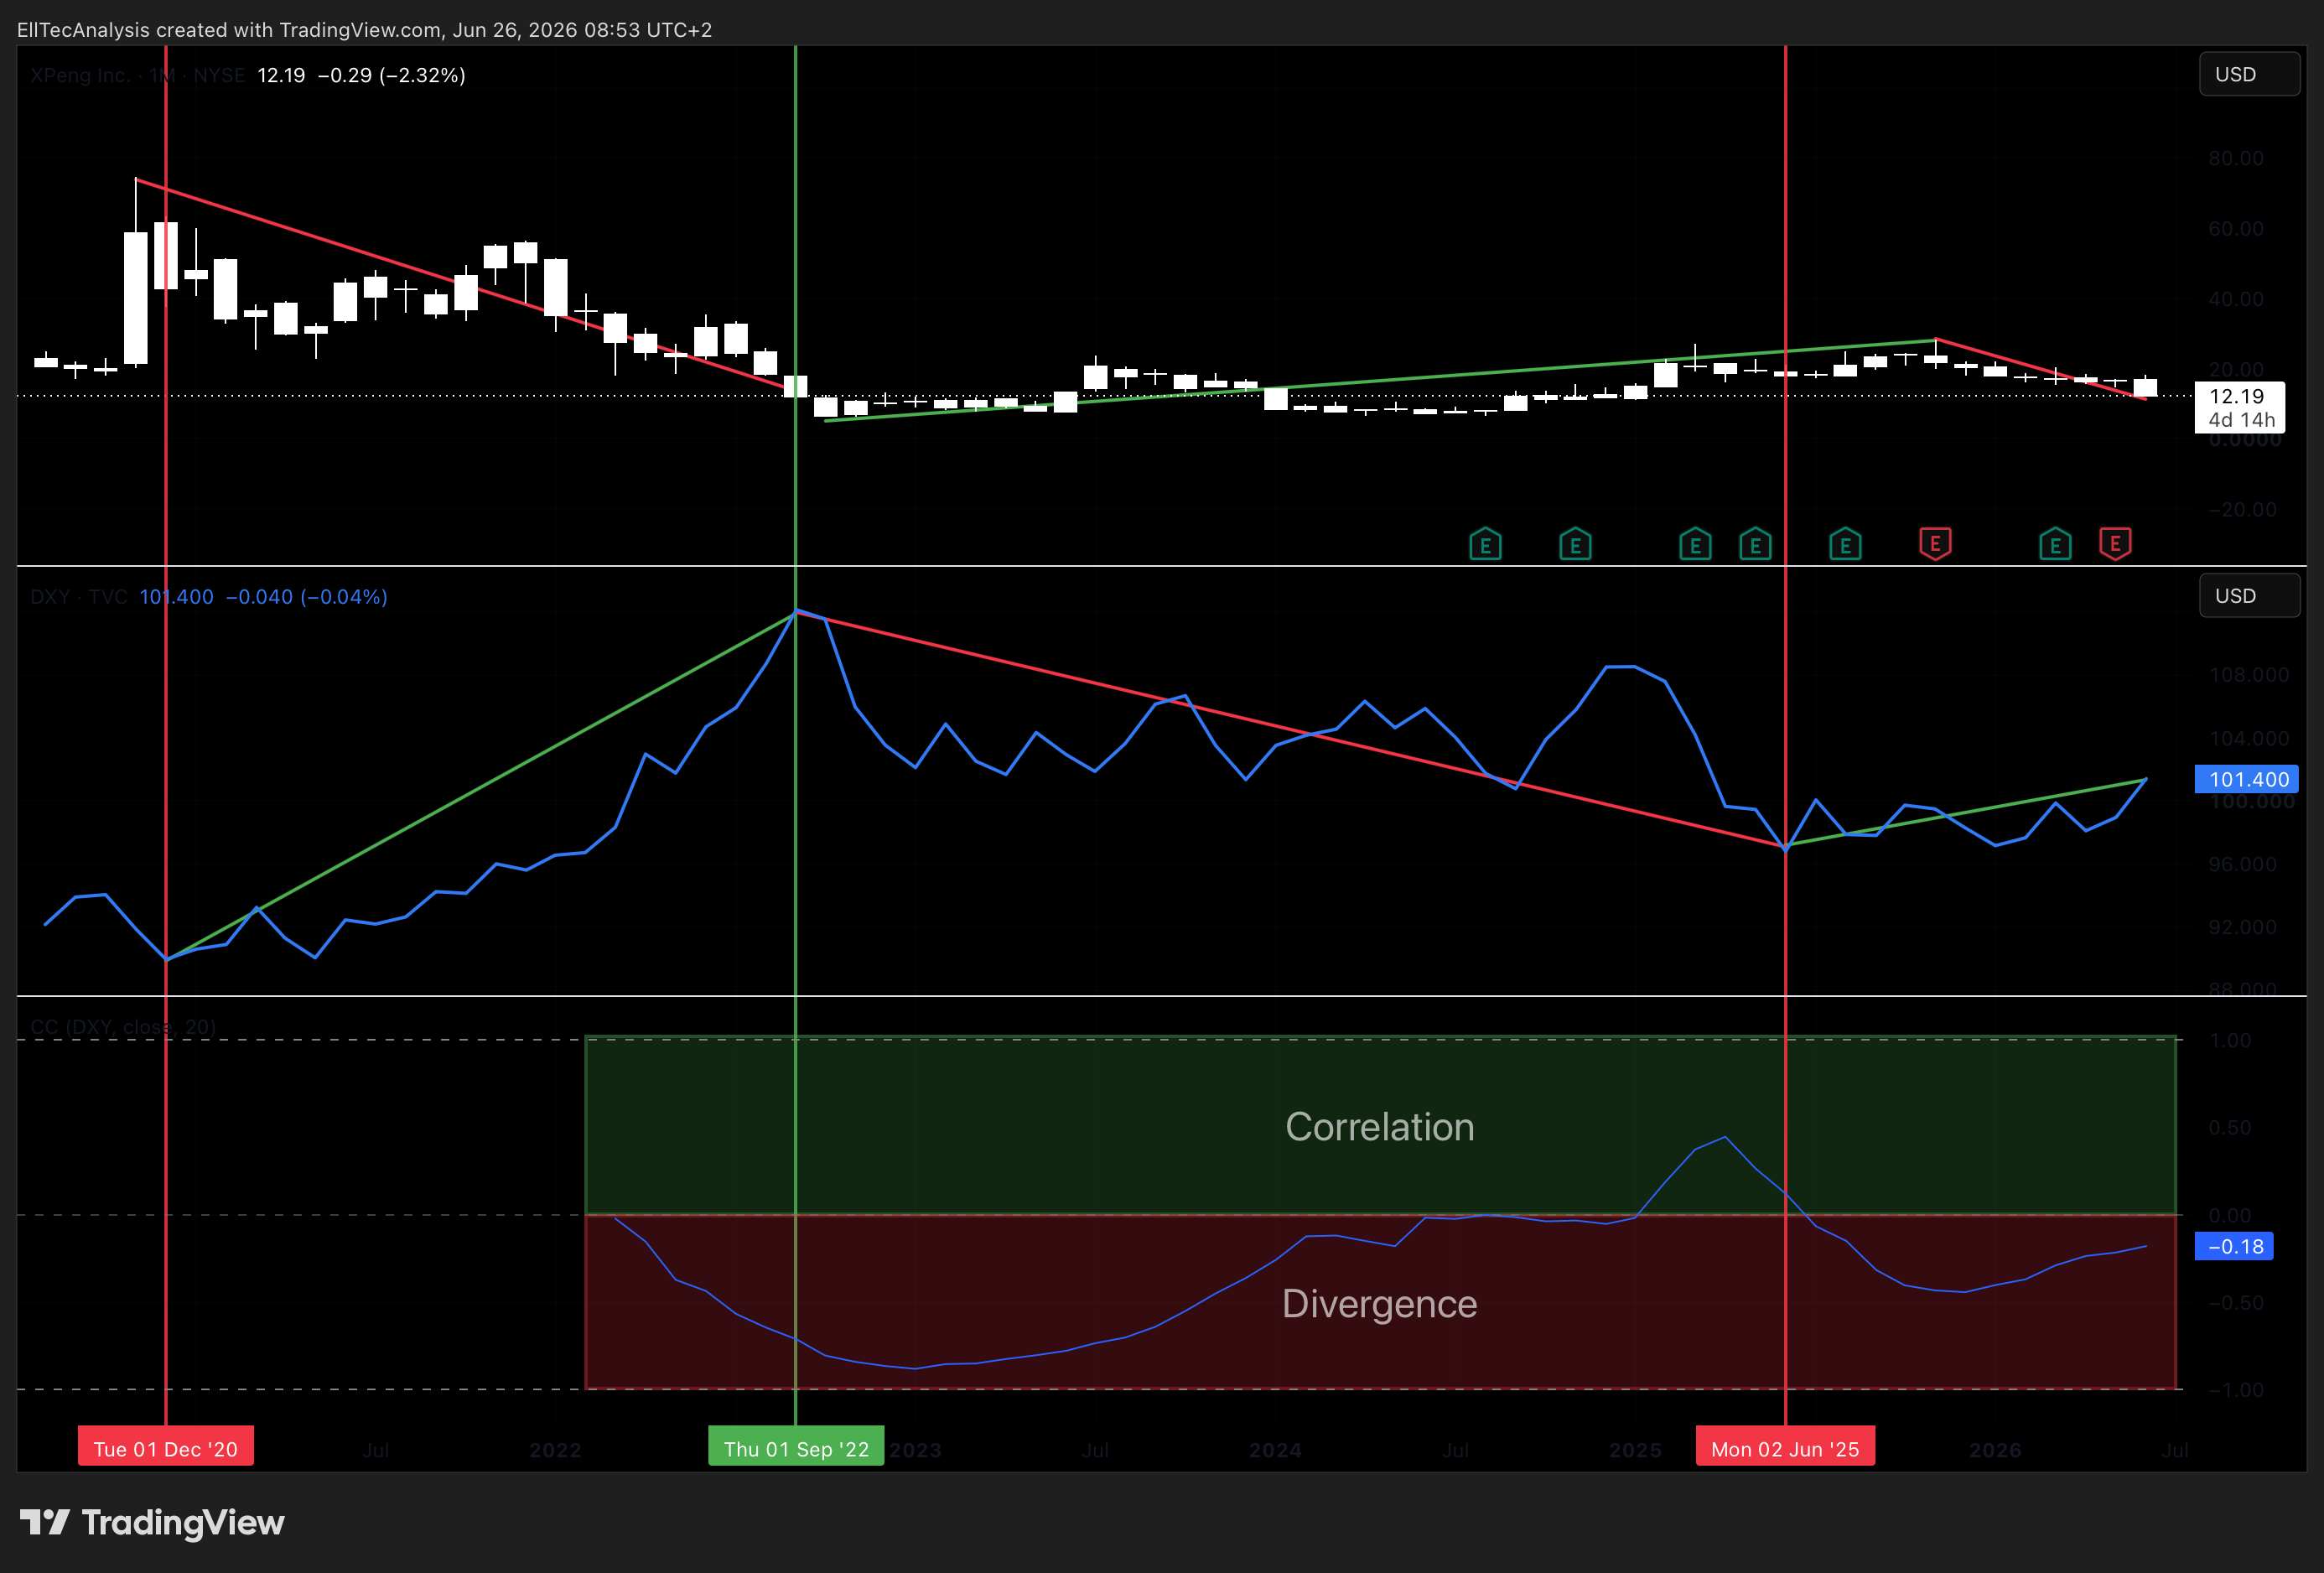
As a Chinese company reporting in Renminbi, but priced and traded in USD, XPEV carries an embedded currency sensitivity to the dollar. A strengthening dollar creates headwinds through both valuation compression and RMB translation effects on fundamentals as reported in US filings. DXY weakness has historically coincided with periods of XPeng outperformance and tends to amplify the early stages of any recovery cycle.
LITHIUM AND BATTERY METALS COMPLEX
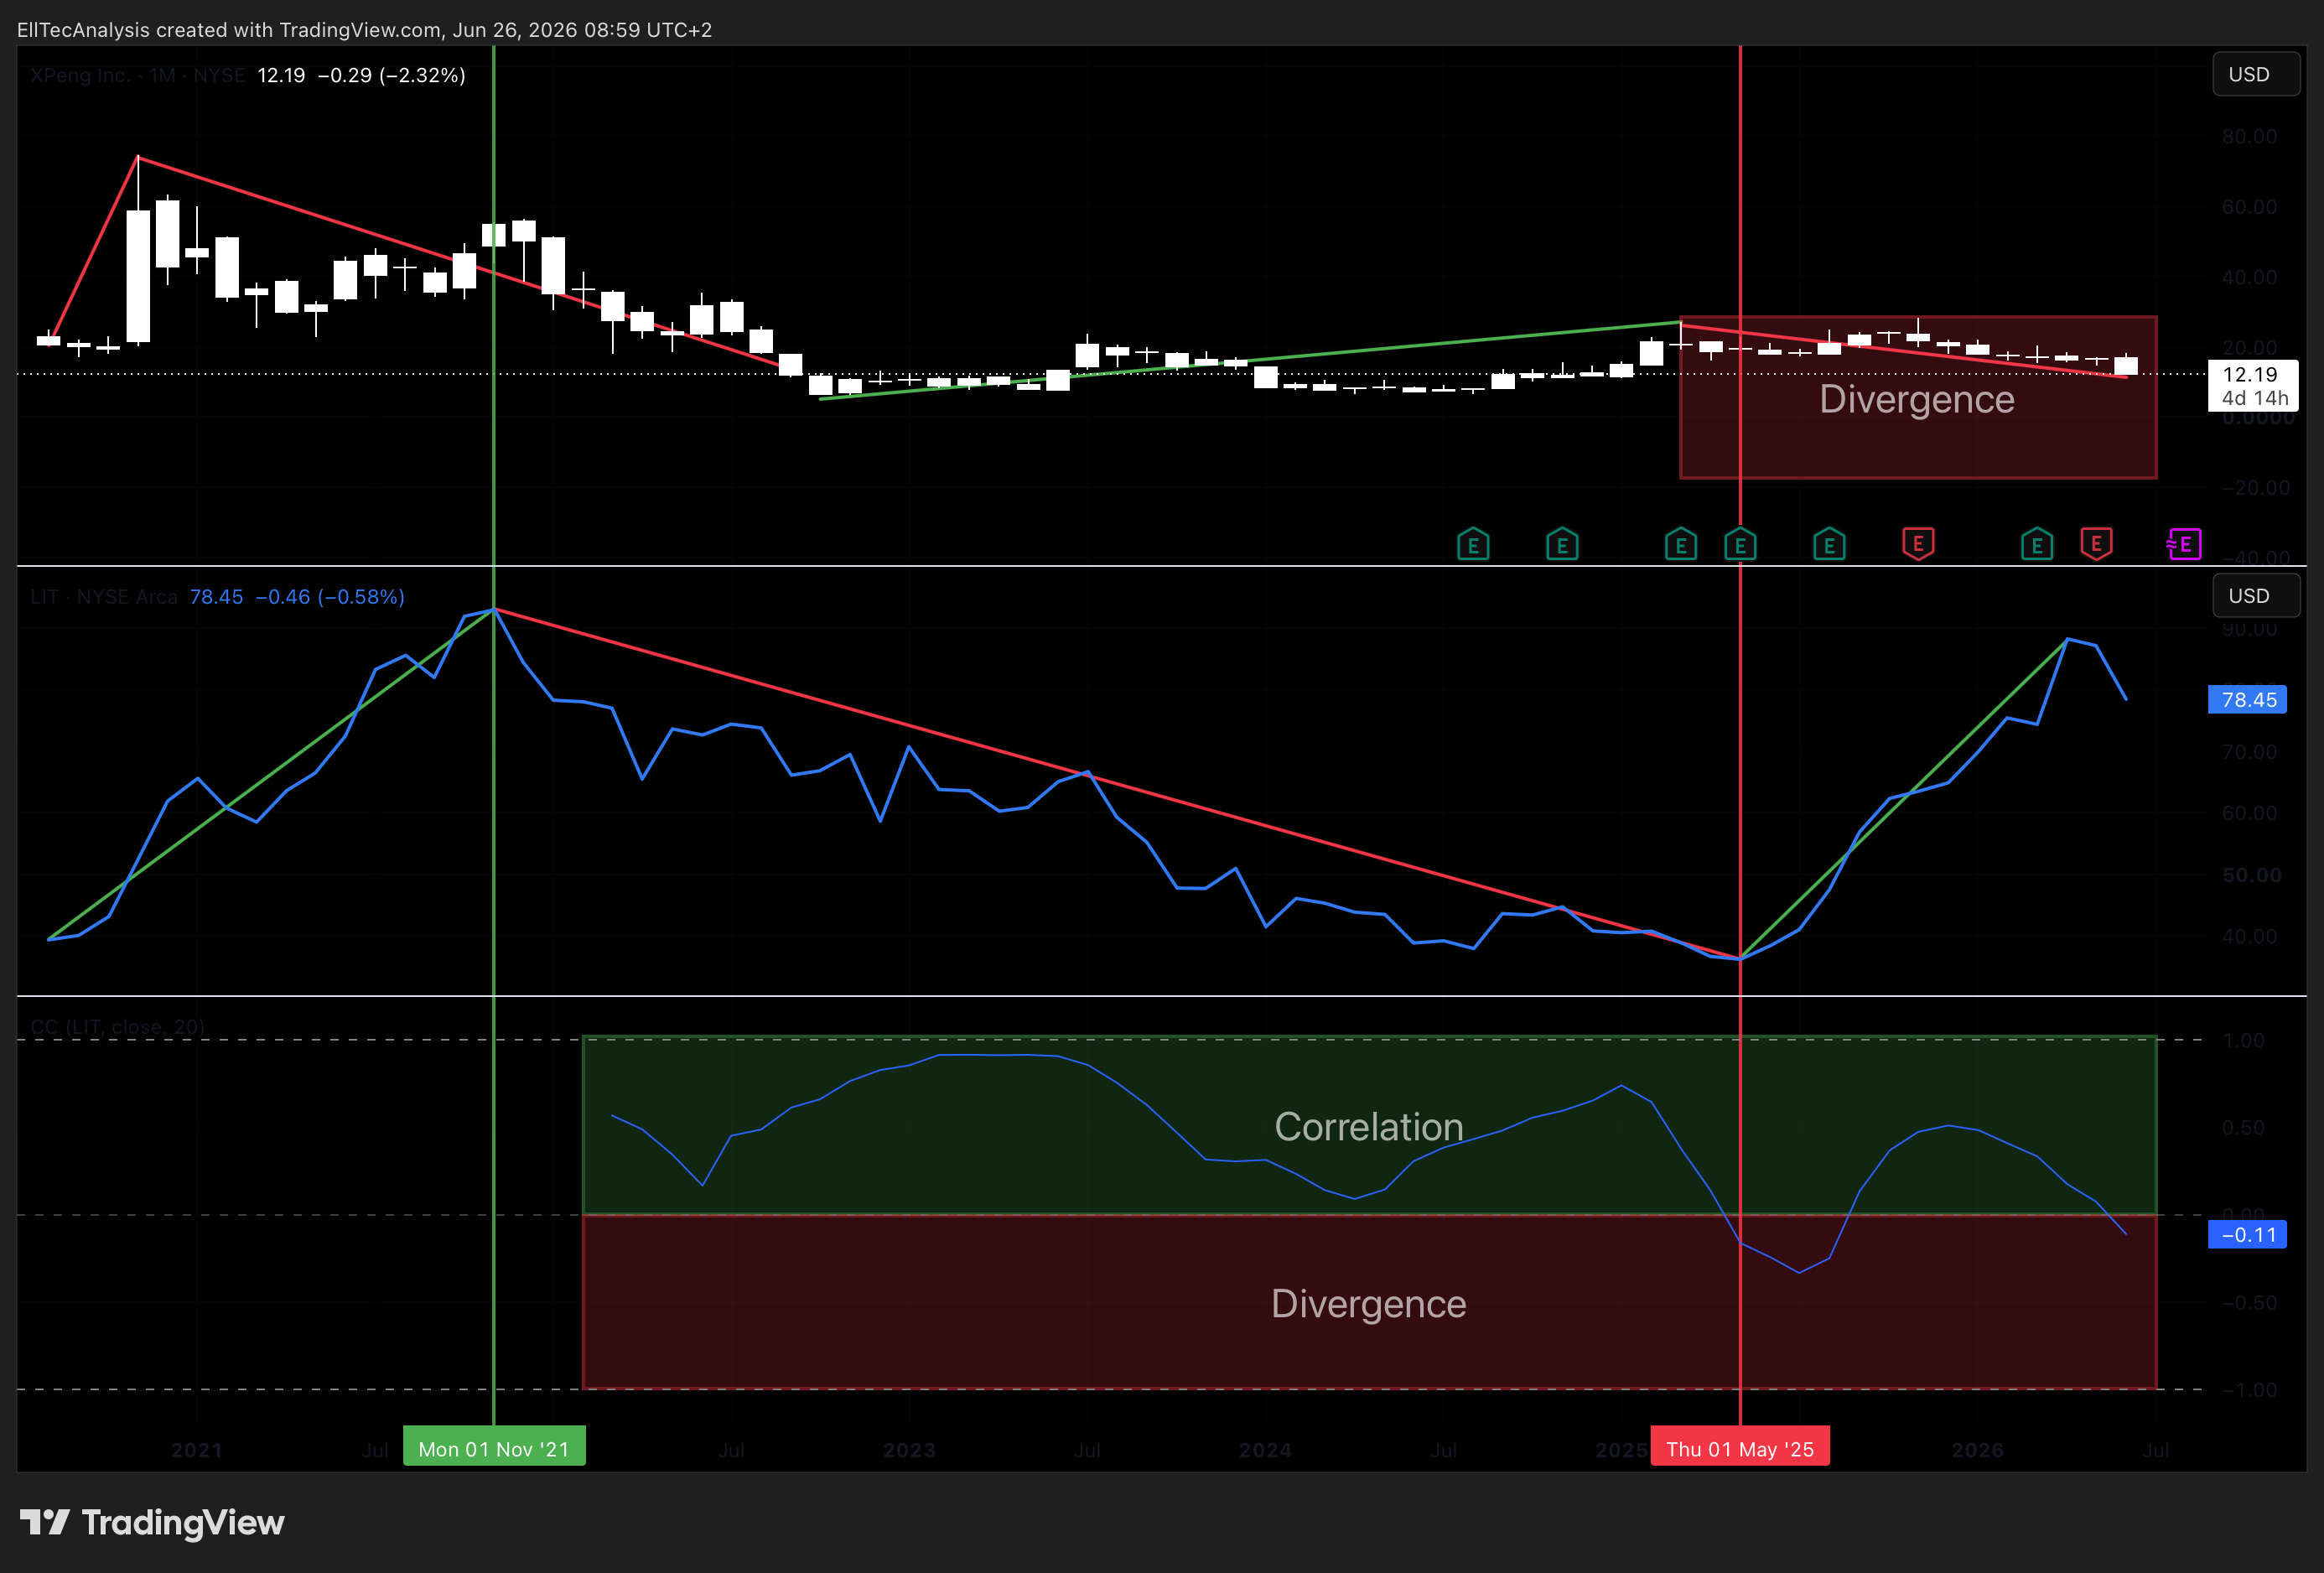
Battery input costs represent the primary variable cost lever in XPeng’s vehicle margin structure. Sentiment correlates between XPEV and LIT, so a strong correlation can be seen. Since March 2025 a divergence can be seen, XPEV sold off, while prices for LIT rose. This divergence can indicate a near trend reversal ij XPEV, this adds up to the primary ElliotWave scenario displayed below.
PEER EV SENTIMENT (NIO, LI AUTO)
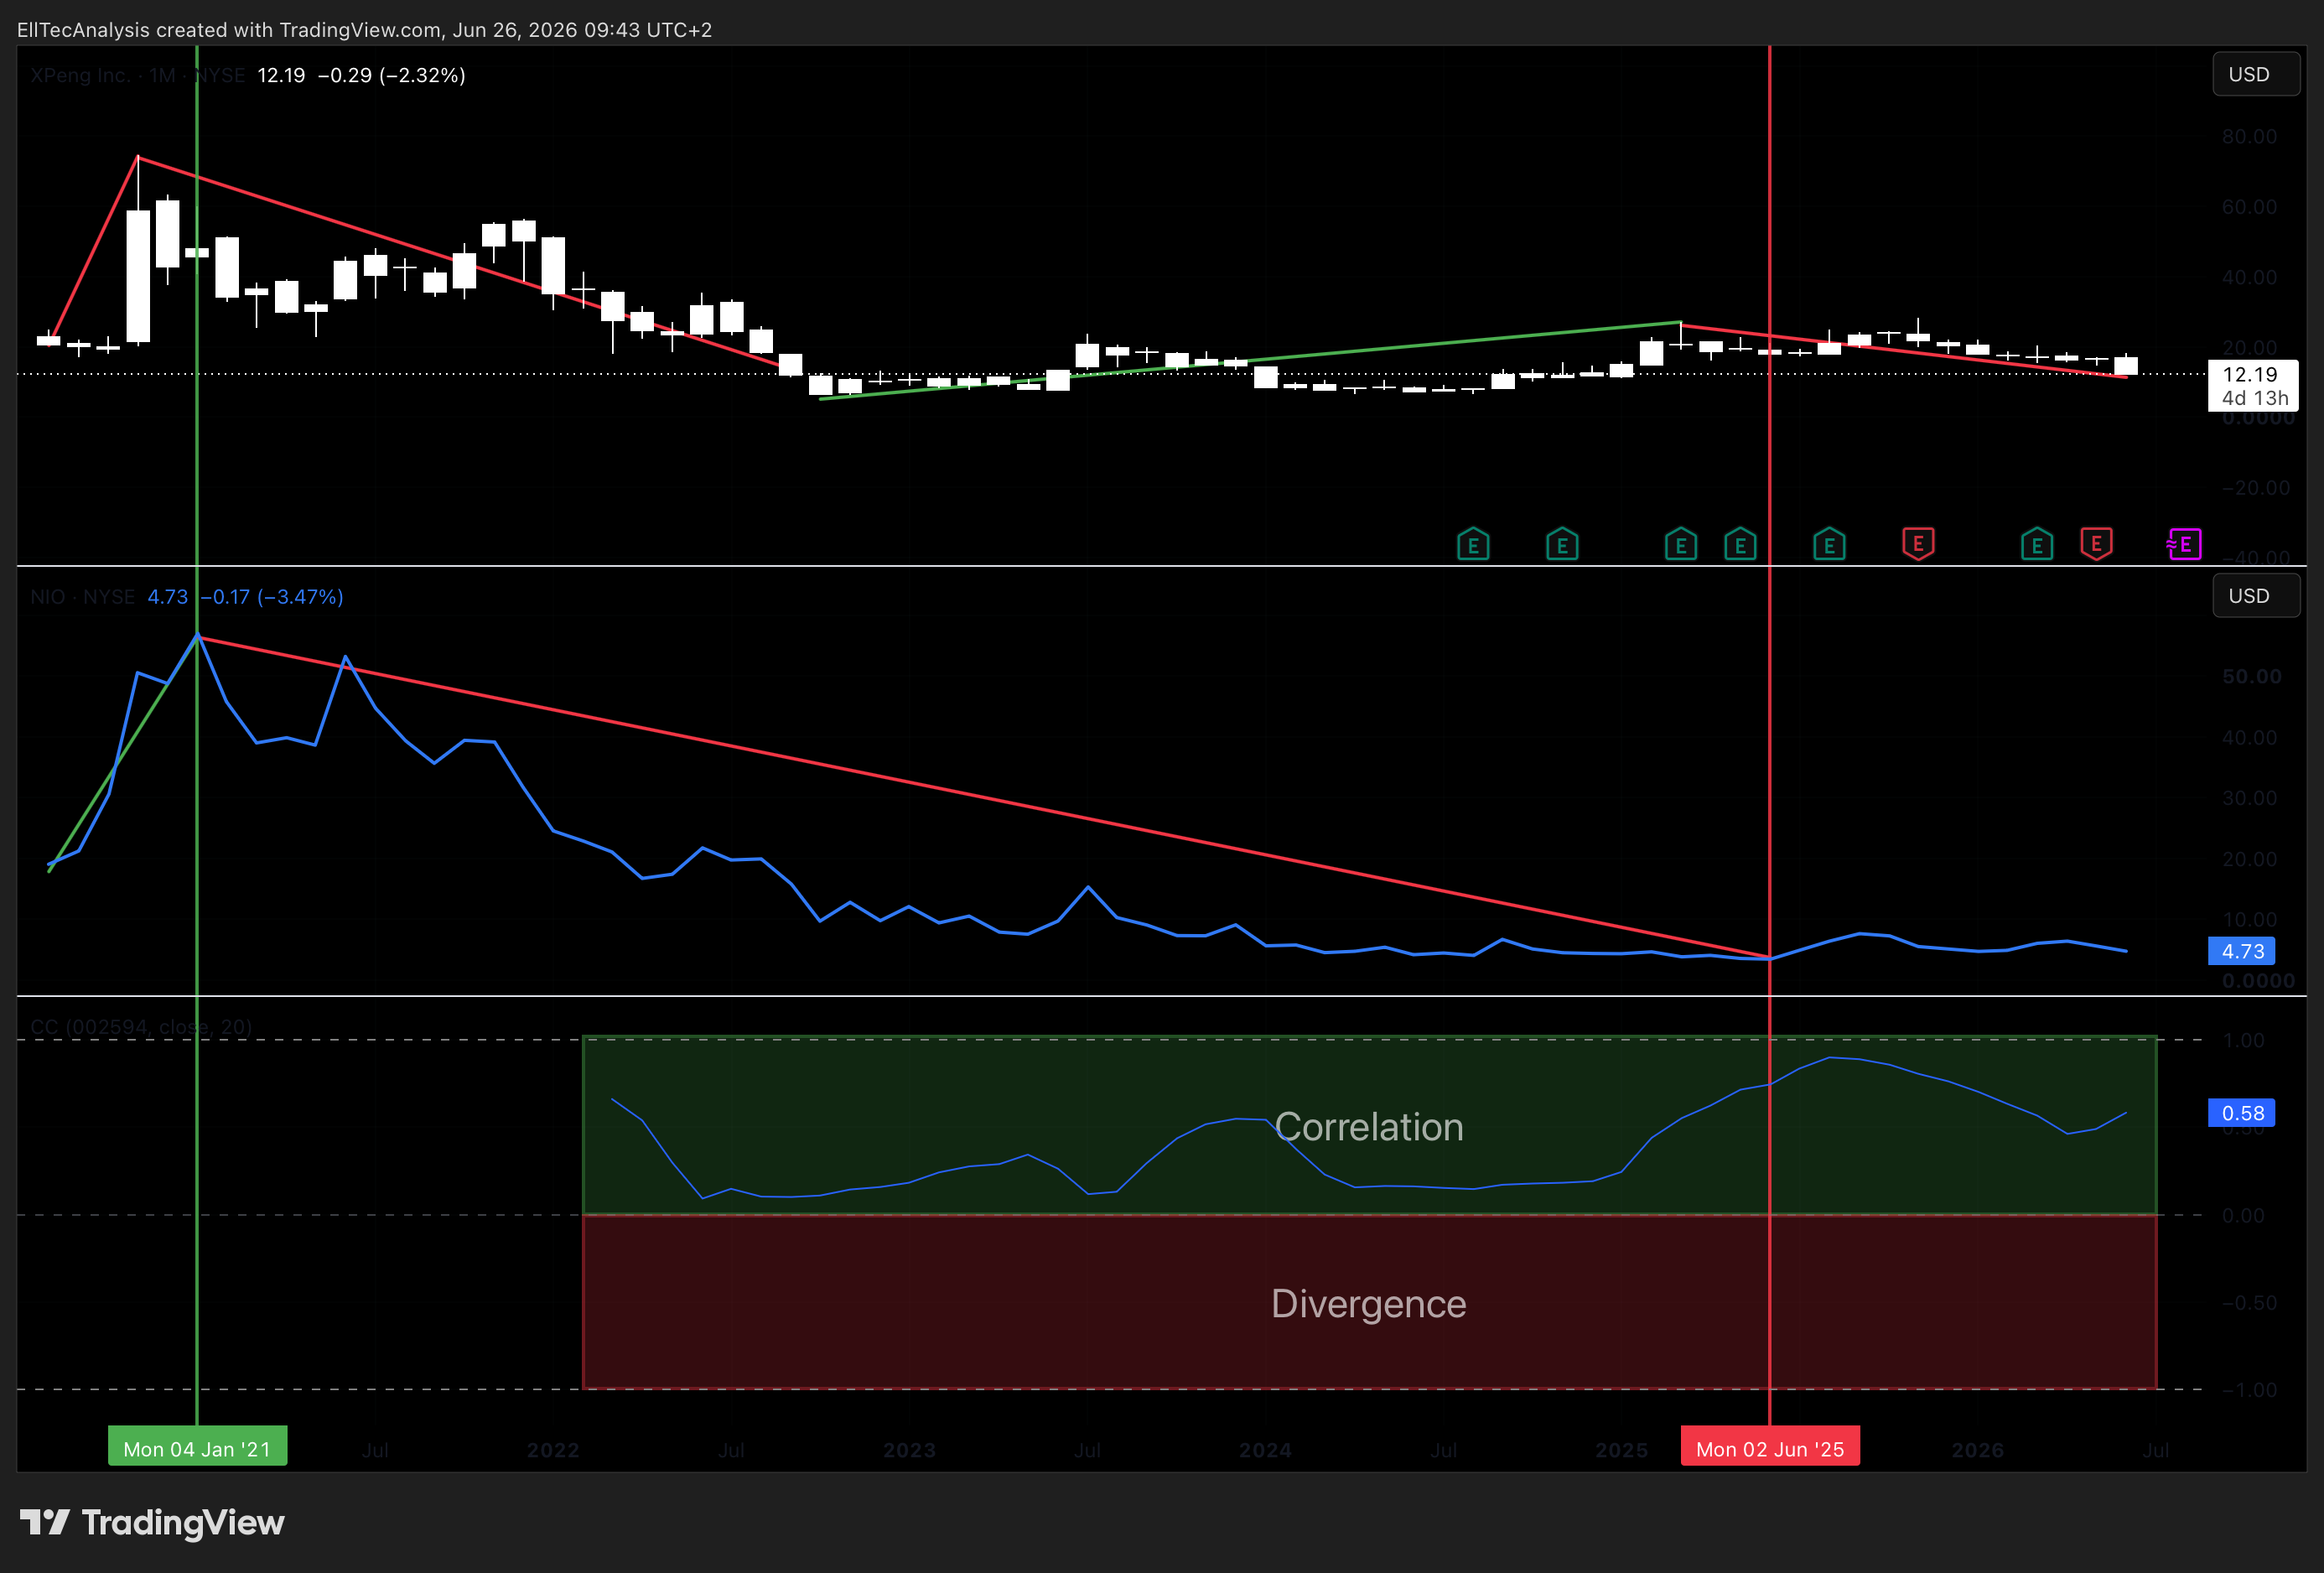
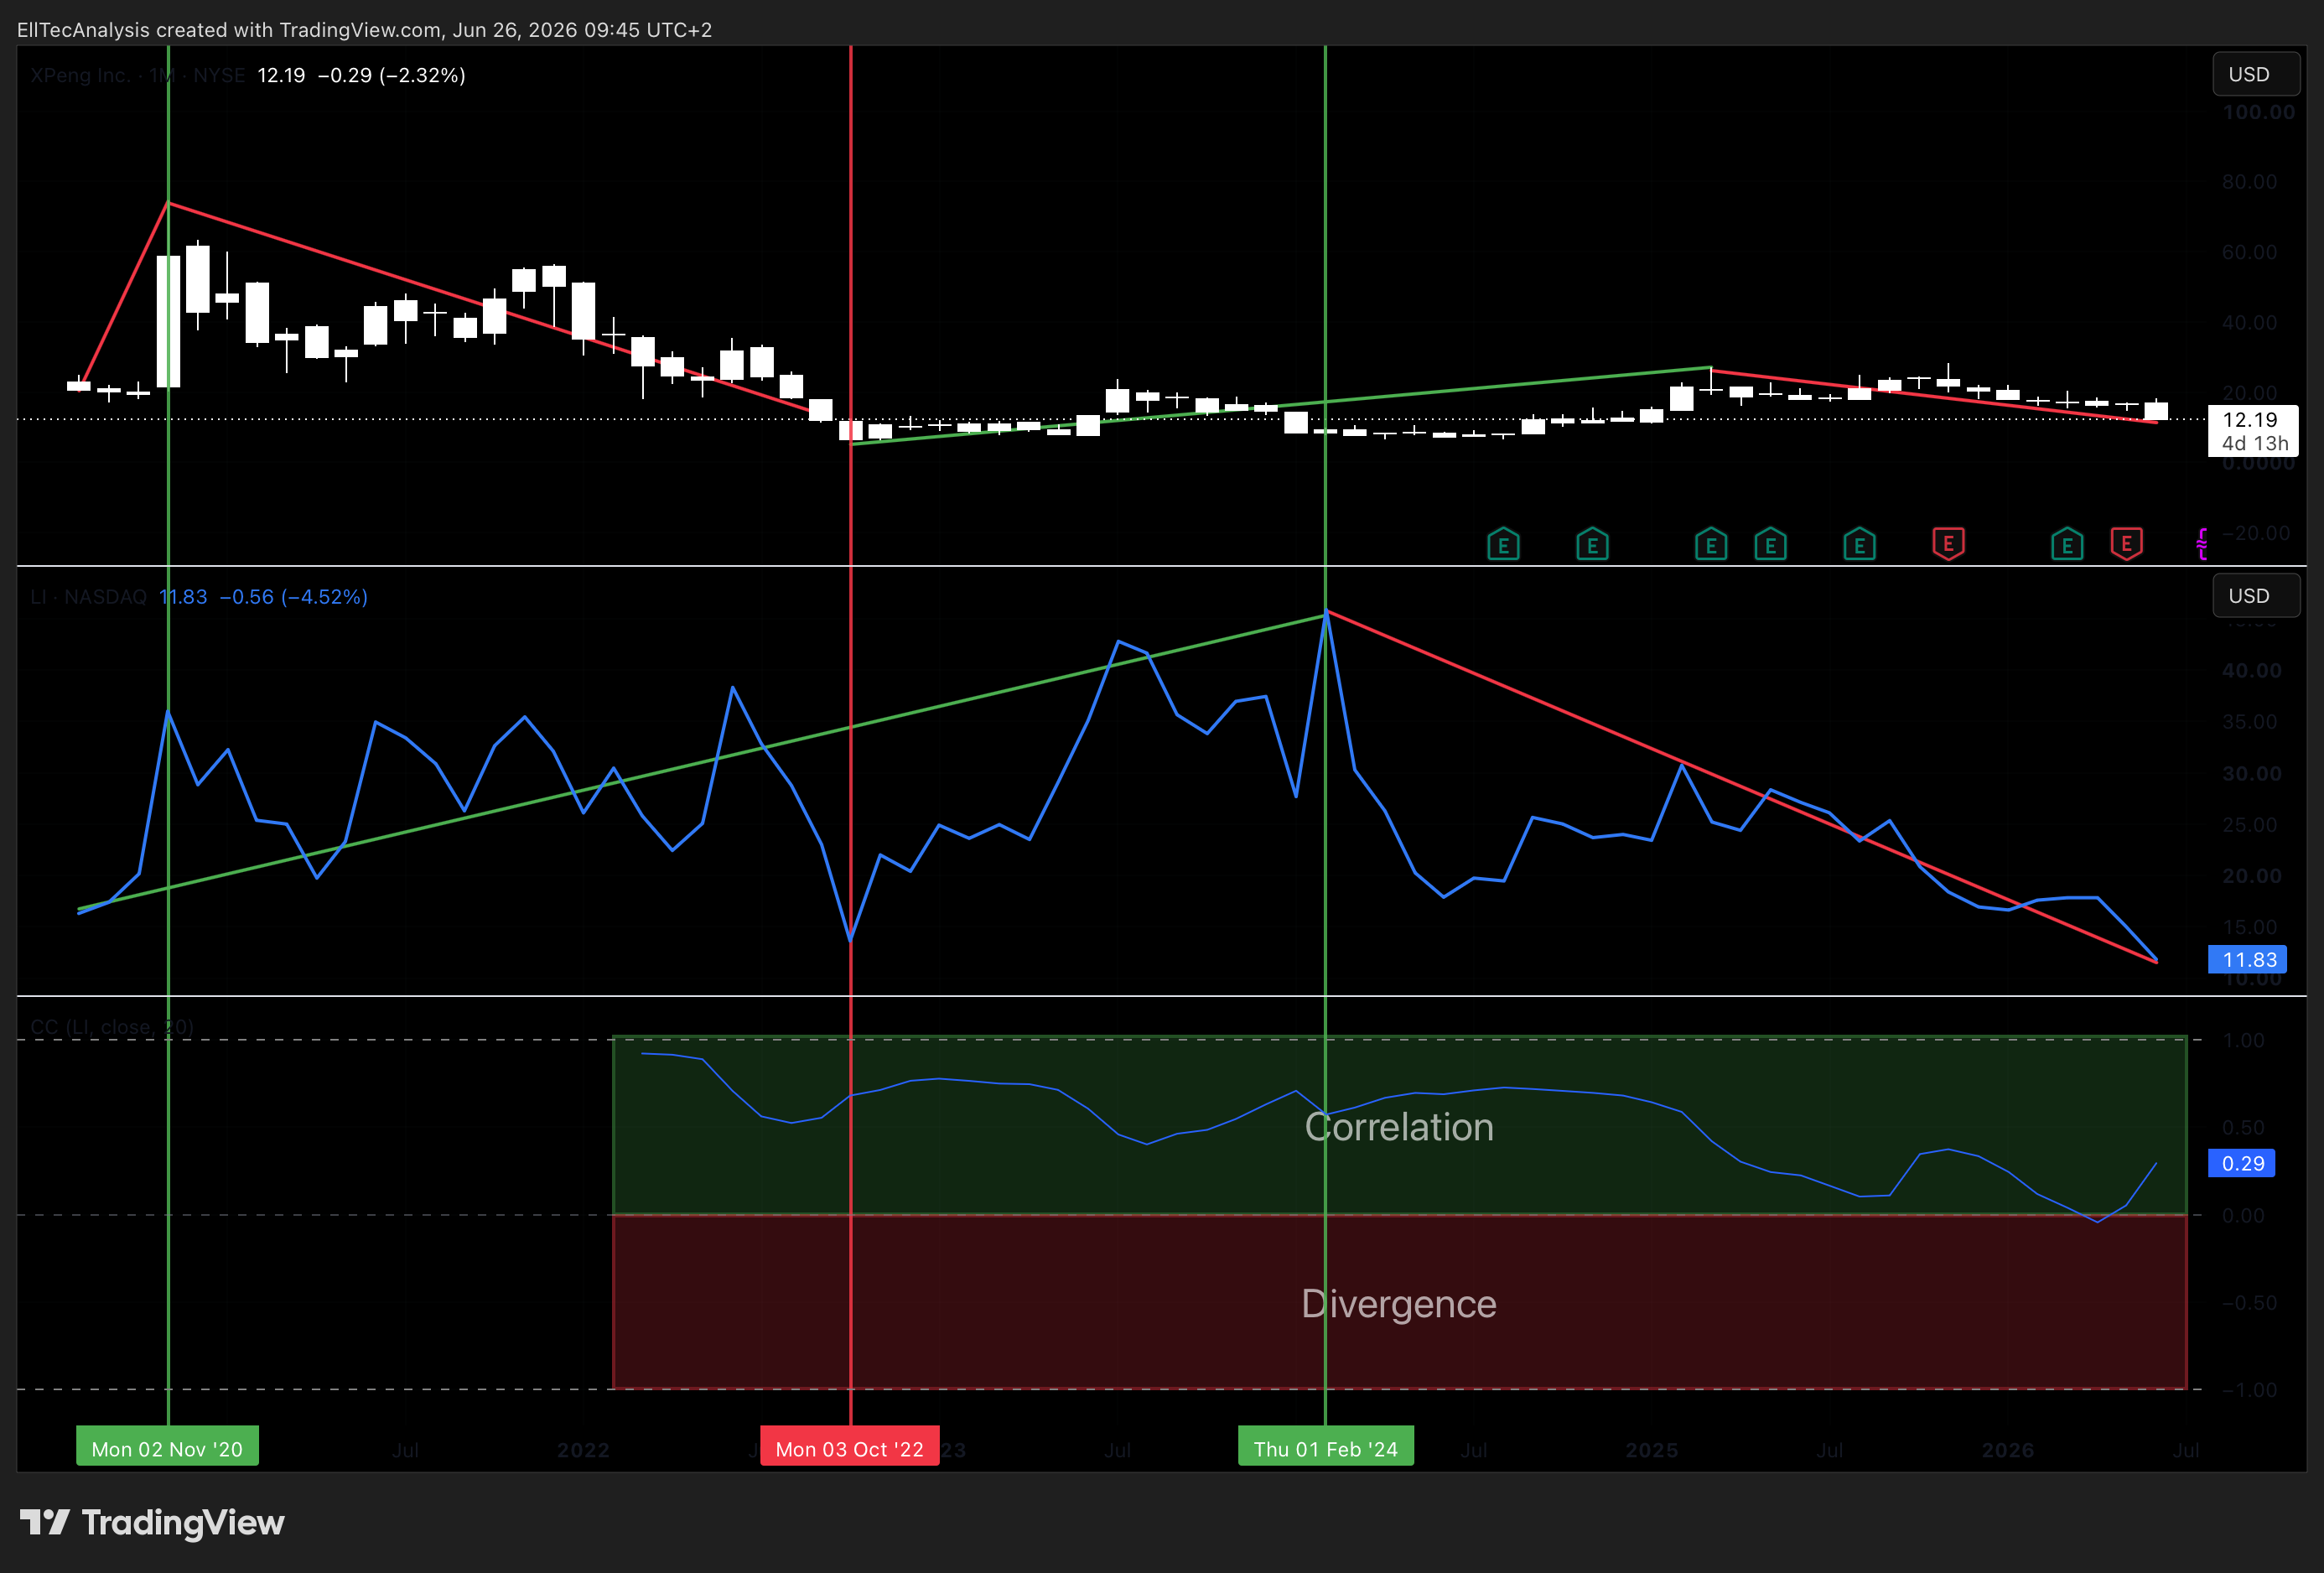
The Chinese EV sector trades with considerable intra-group correlation, particularly during periods of macro-driven sector rotation. Developments at NIO, Li Auto, and BYD frequently set the short-term directional tone for XPEV regardless of company-specific news. This peer dependency means that a structural low in XPEV is more likely to hold when the broader NIO/Li Auto complex is simultaneously forming bottoms, as coordinated sector recoveries tend to produce stronger and more sustained impulses than isolated single-stock reversals.
SECTION 03
Seasonality
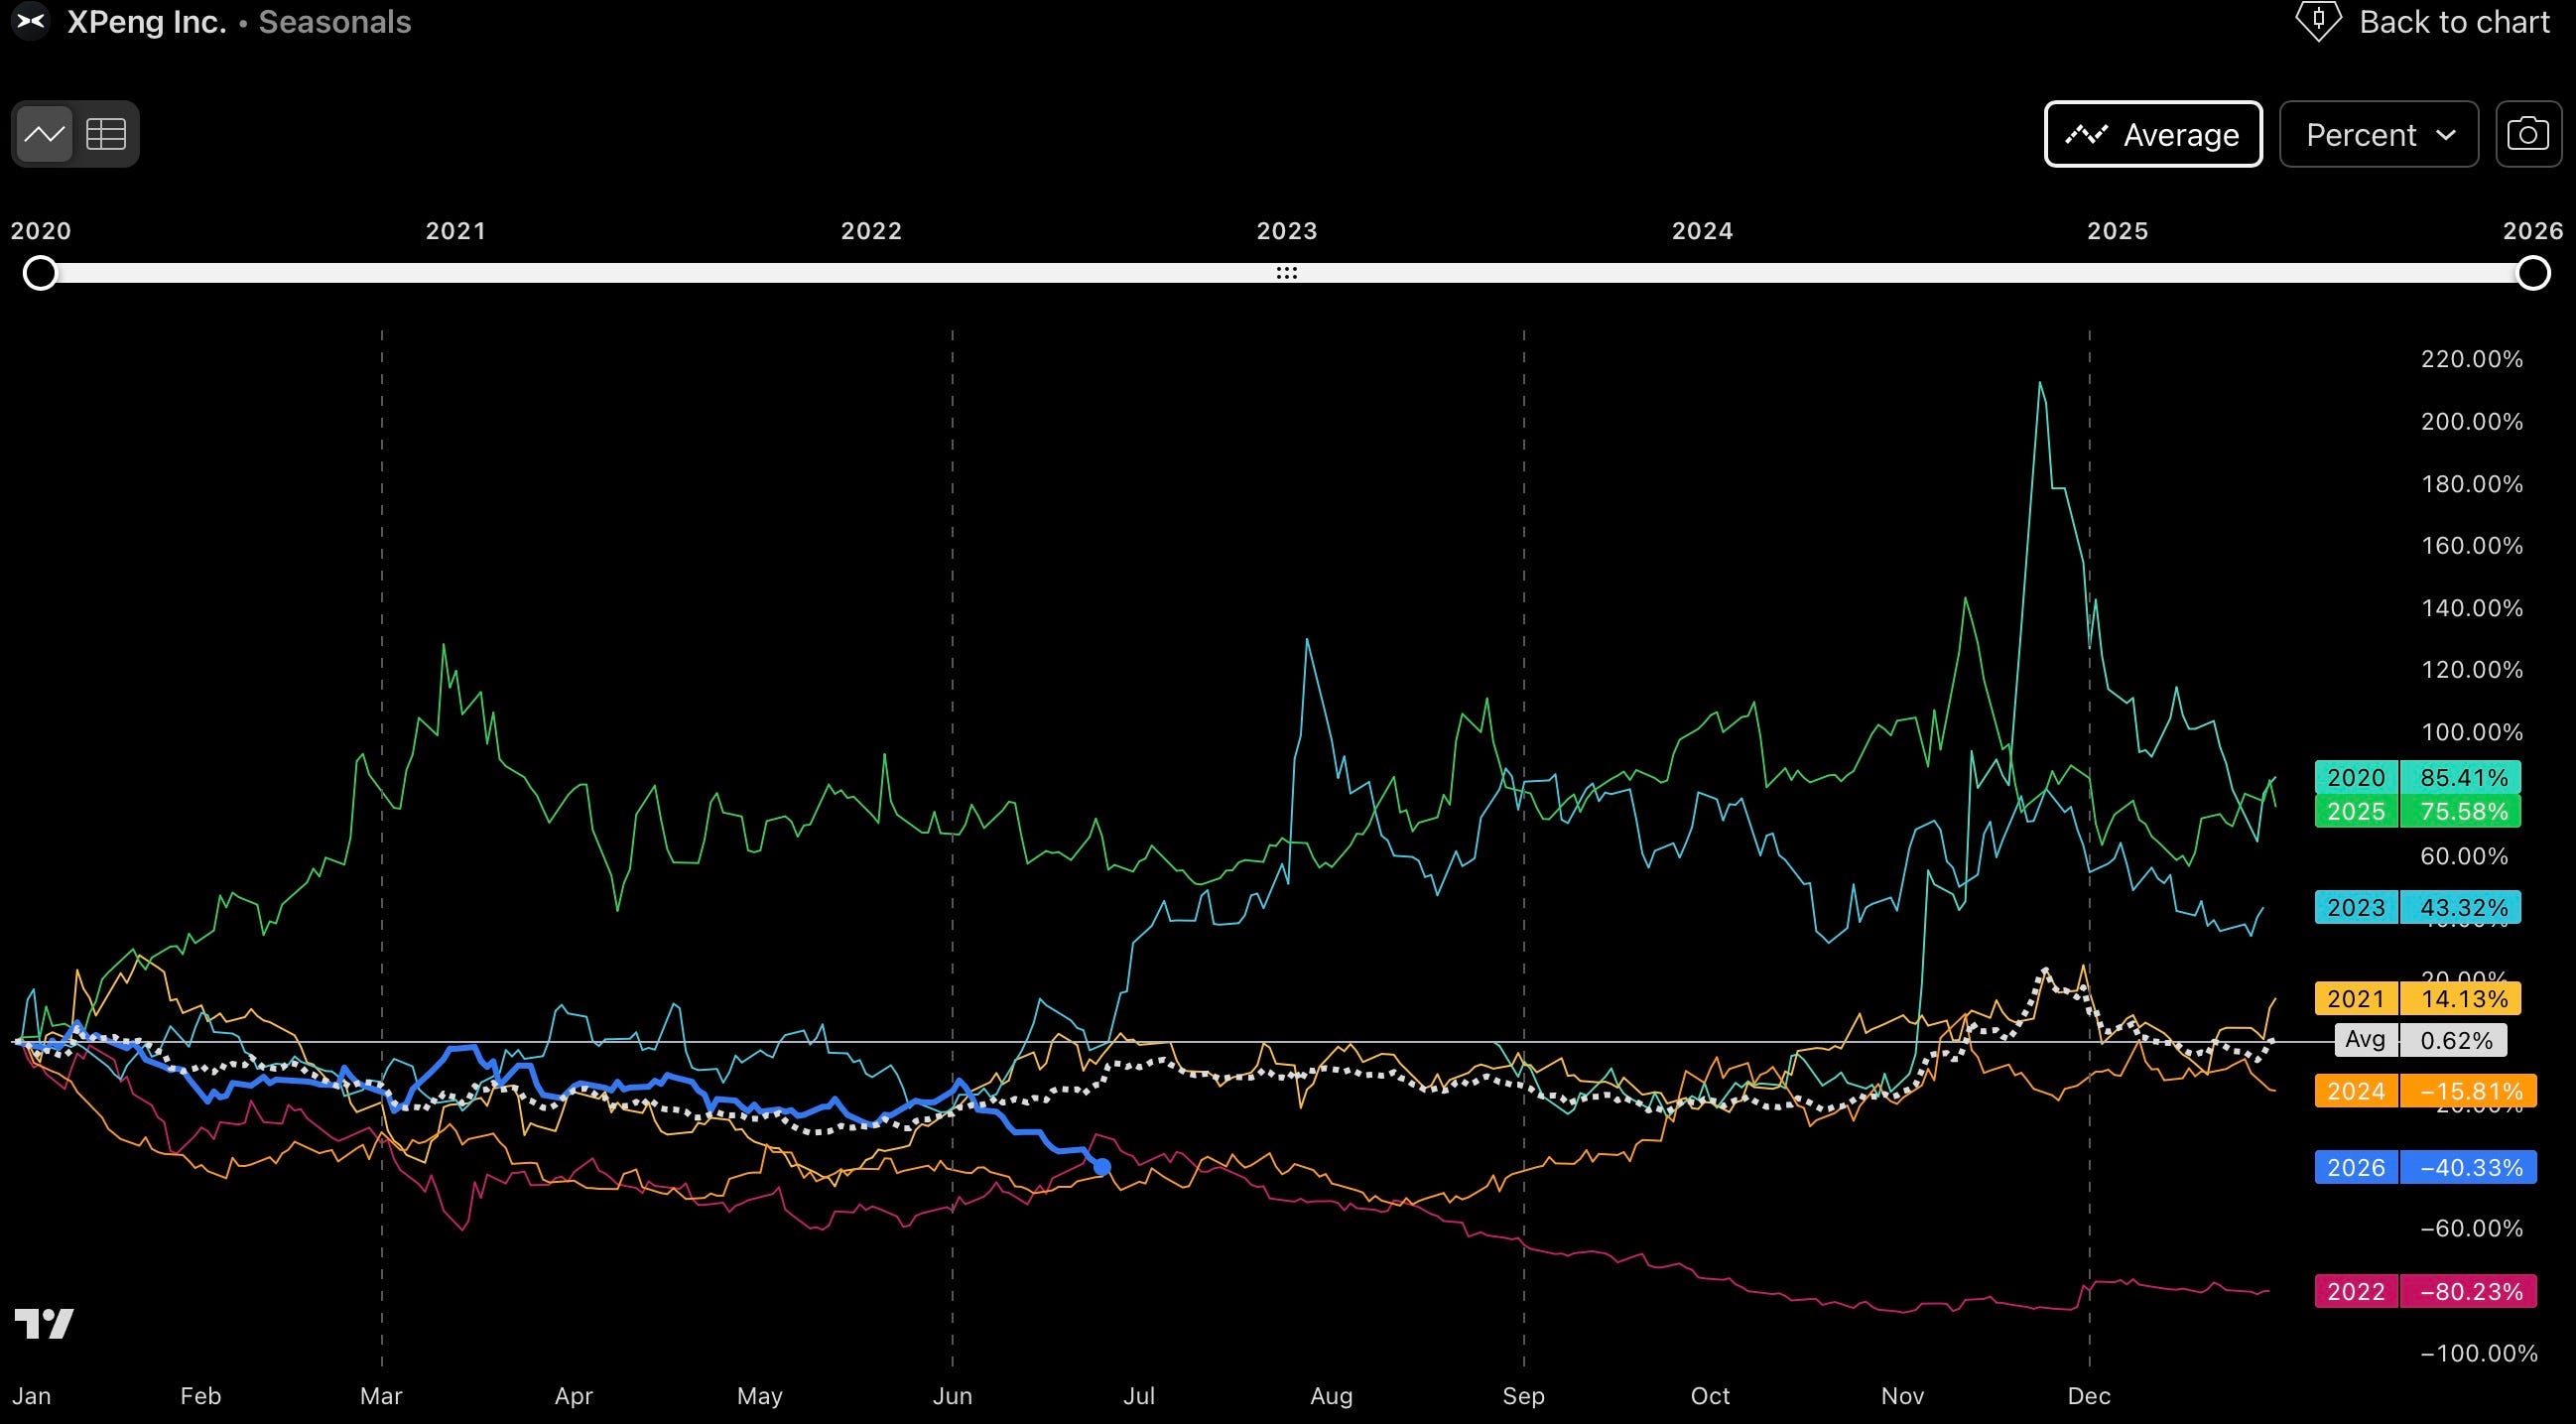
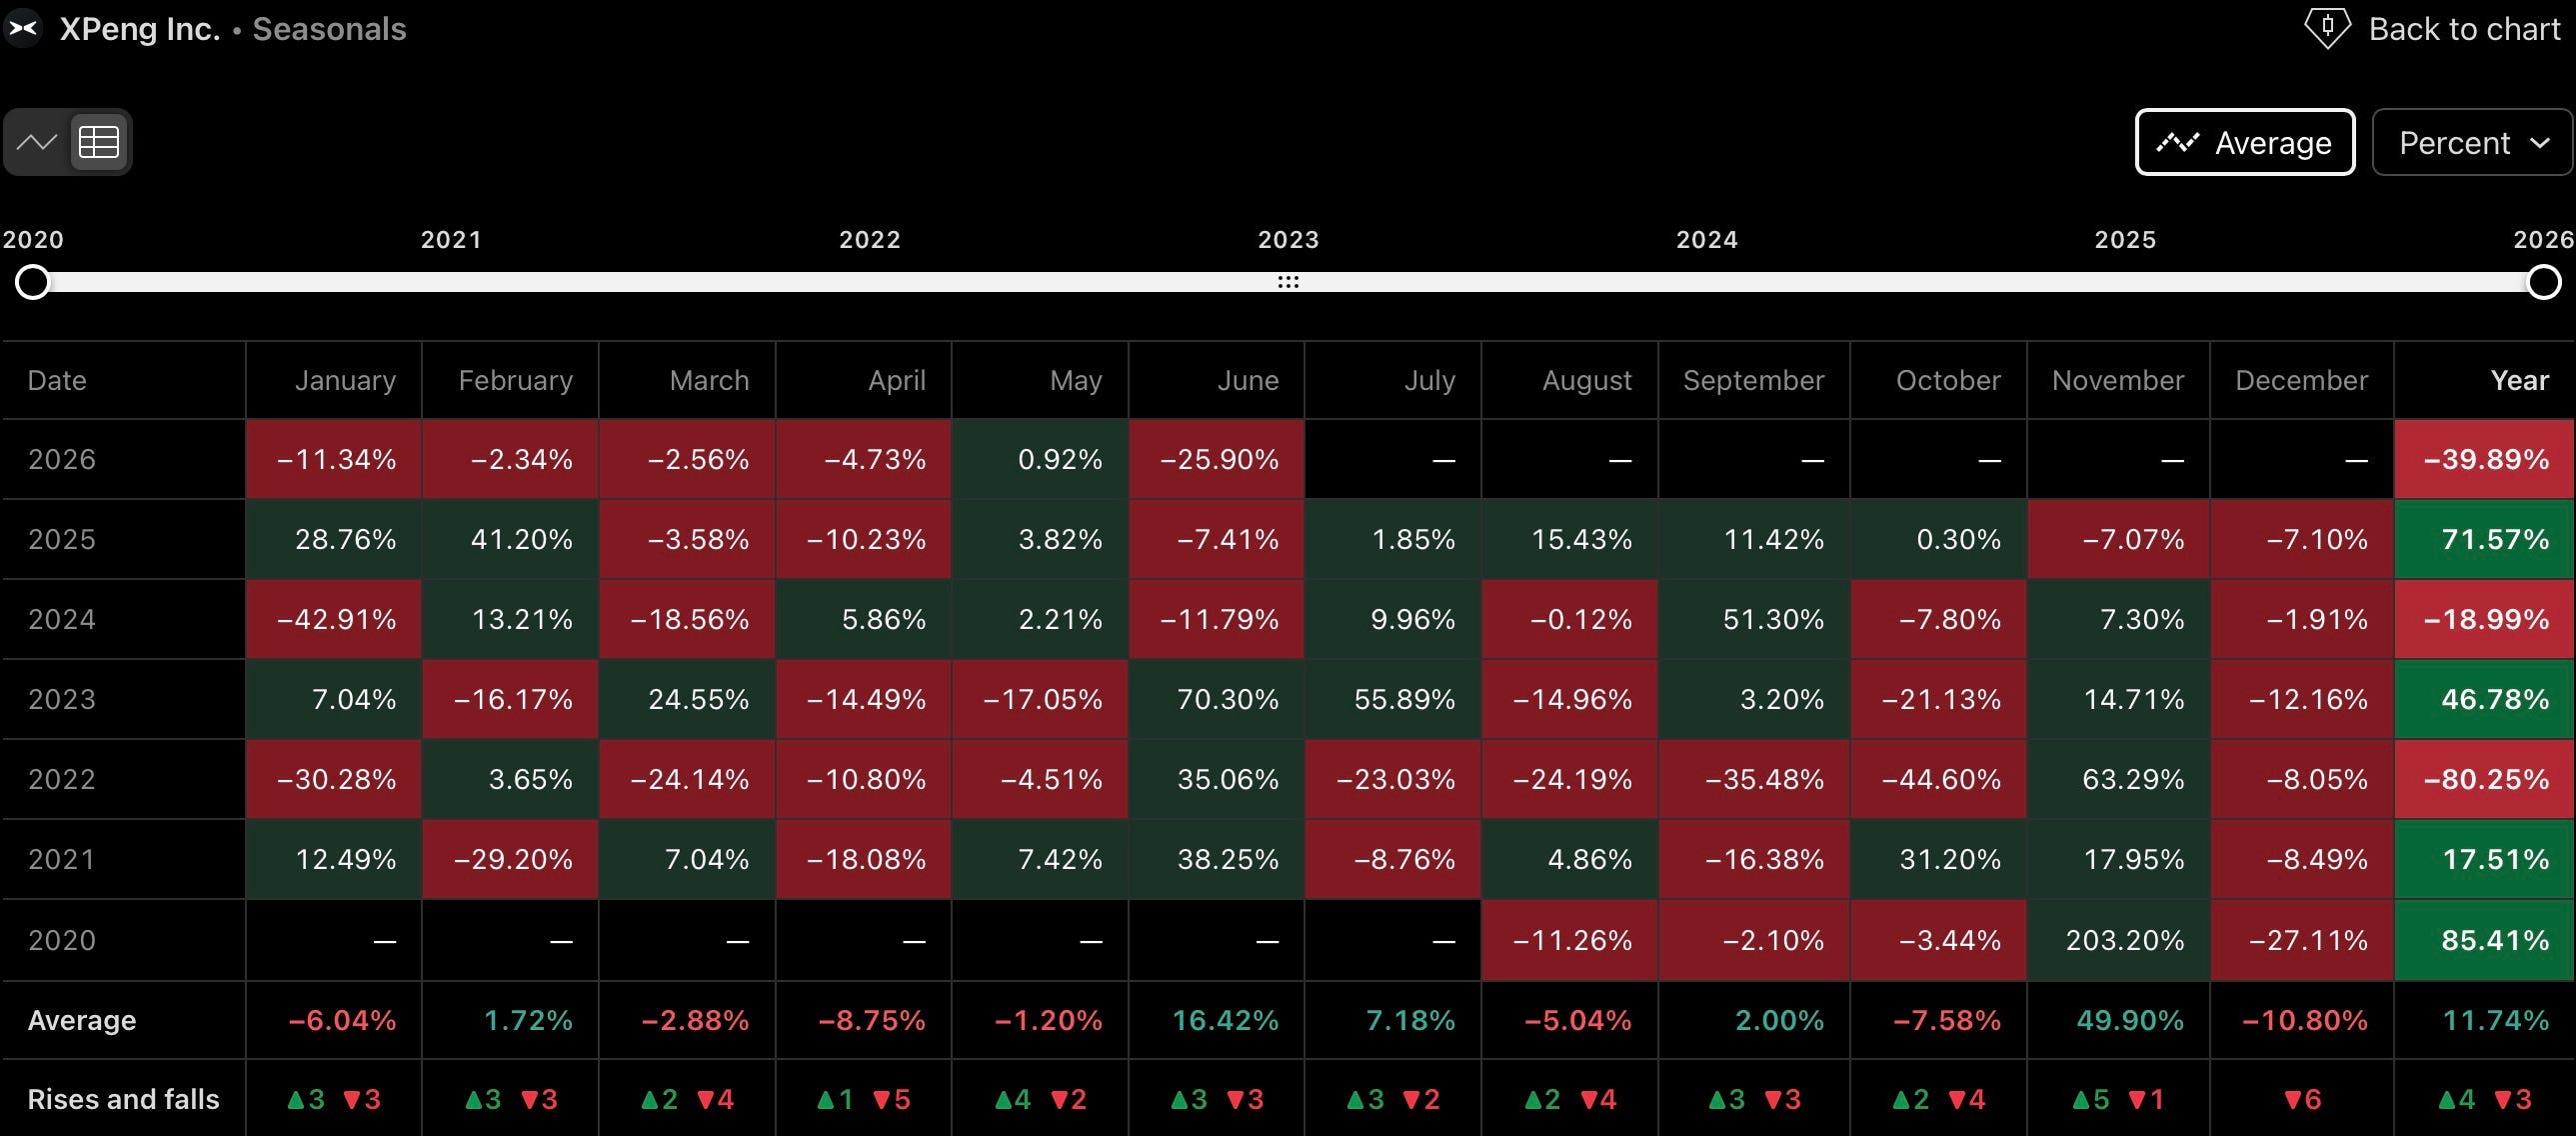
Seasonality analysis for XPEV over the observation window from 2020 to 2026 reveals a consistent and strategically relevant pattern. The months of June, July, September, November, and February have historically delivered positive average returns, while the remaining months have tended to generate negative performance.
June stands out as the highest-conviction positive month, with an average return of approximately +16%. July follows with an average return of approximately +7%. Both months coincide with the mid-year window following Q1 results and delivery updates, during which the market frequently reassesses its forward earnings assumptions. September and November have also shown positive average performance, with November particularly notable: the average return approaches +49.9%, with five positive occurrences and only one negative over the 2020 to 2026 sample period. This makes November the highest-magnitude seasonal window in the dataset.
The practical implication is that the current corrective phase, if it completes in the June to July window as the wave structure suggests, would align the structural reversal with the seasonally strongest segment of the calendar year. At the latest, the seasonal signal supports a fully established position entering November, which has historically provided the most powerful and consistent upside thrust in the annual cycle.
SECTION 04
