

Strategy (MSTR)
THE BITCOIN TREASURY MACHINE

MSTR · NASDAQ · BITCOIN TREASURY

SECTION 01
Fundamentals
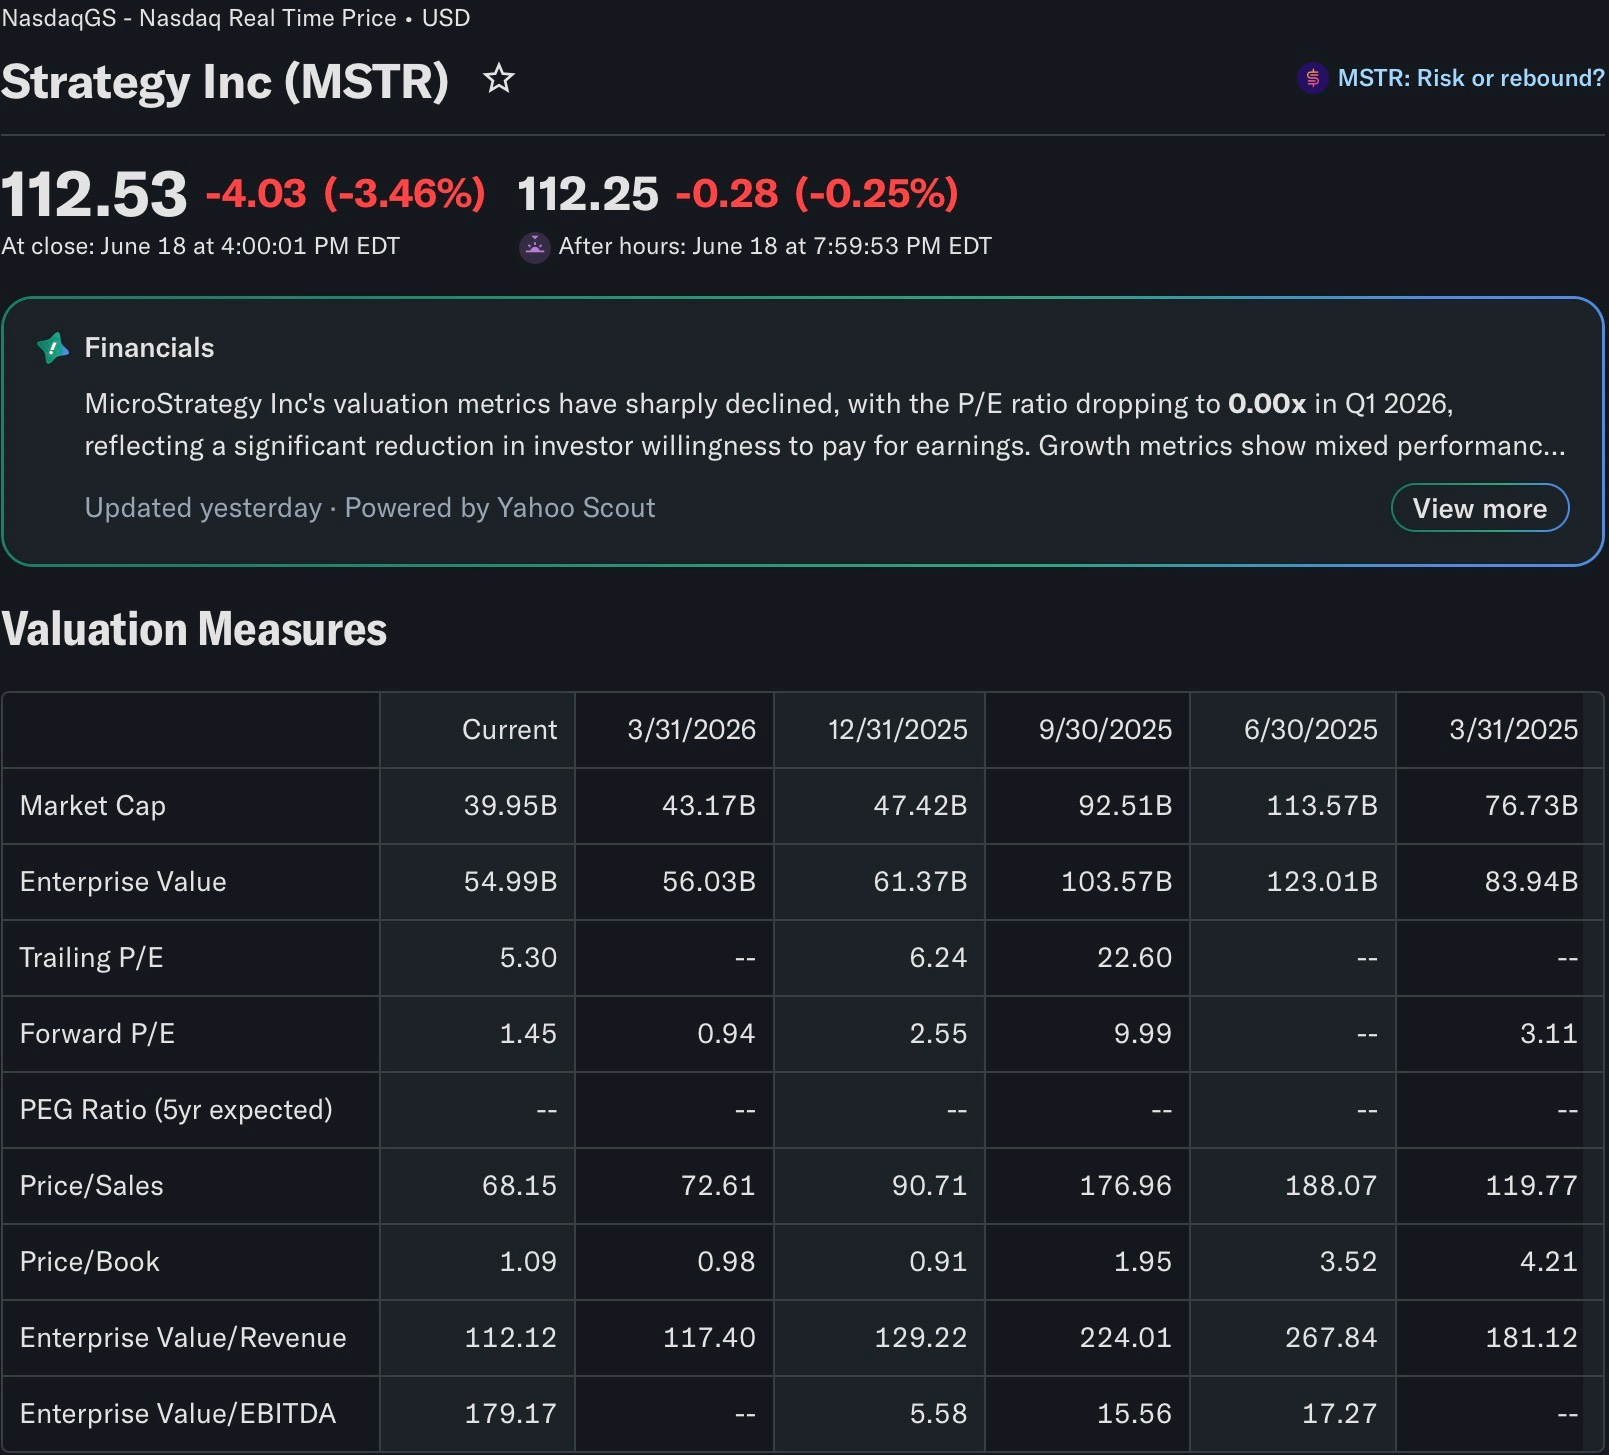
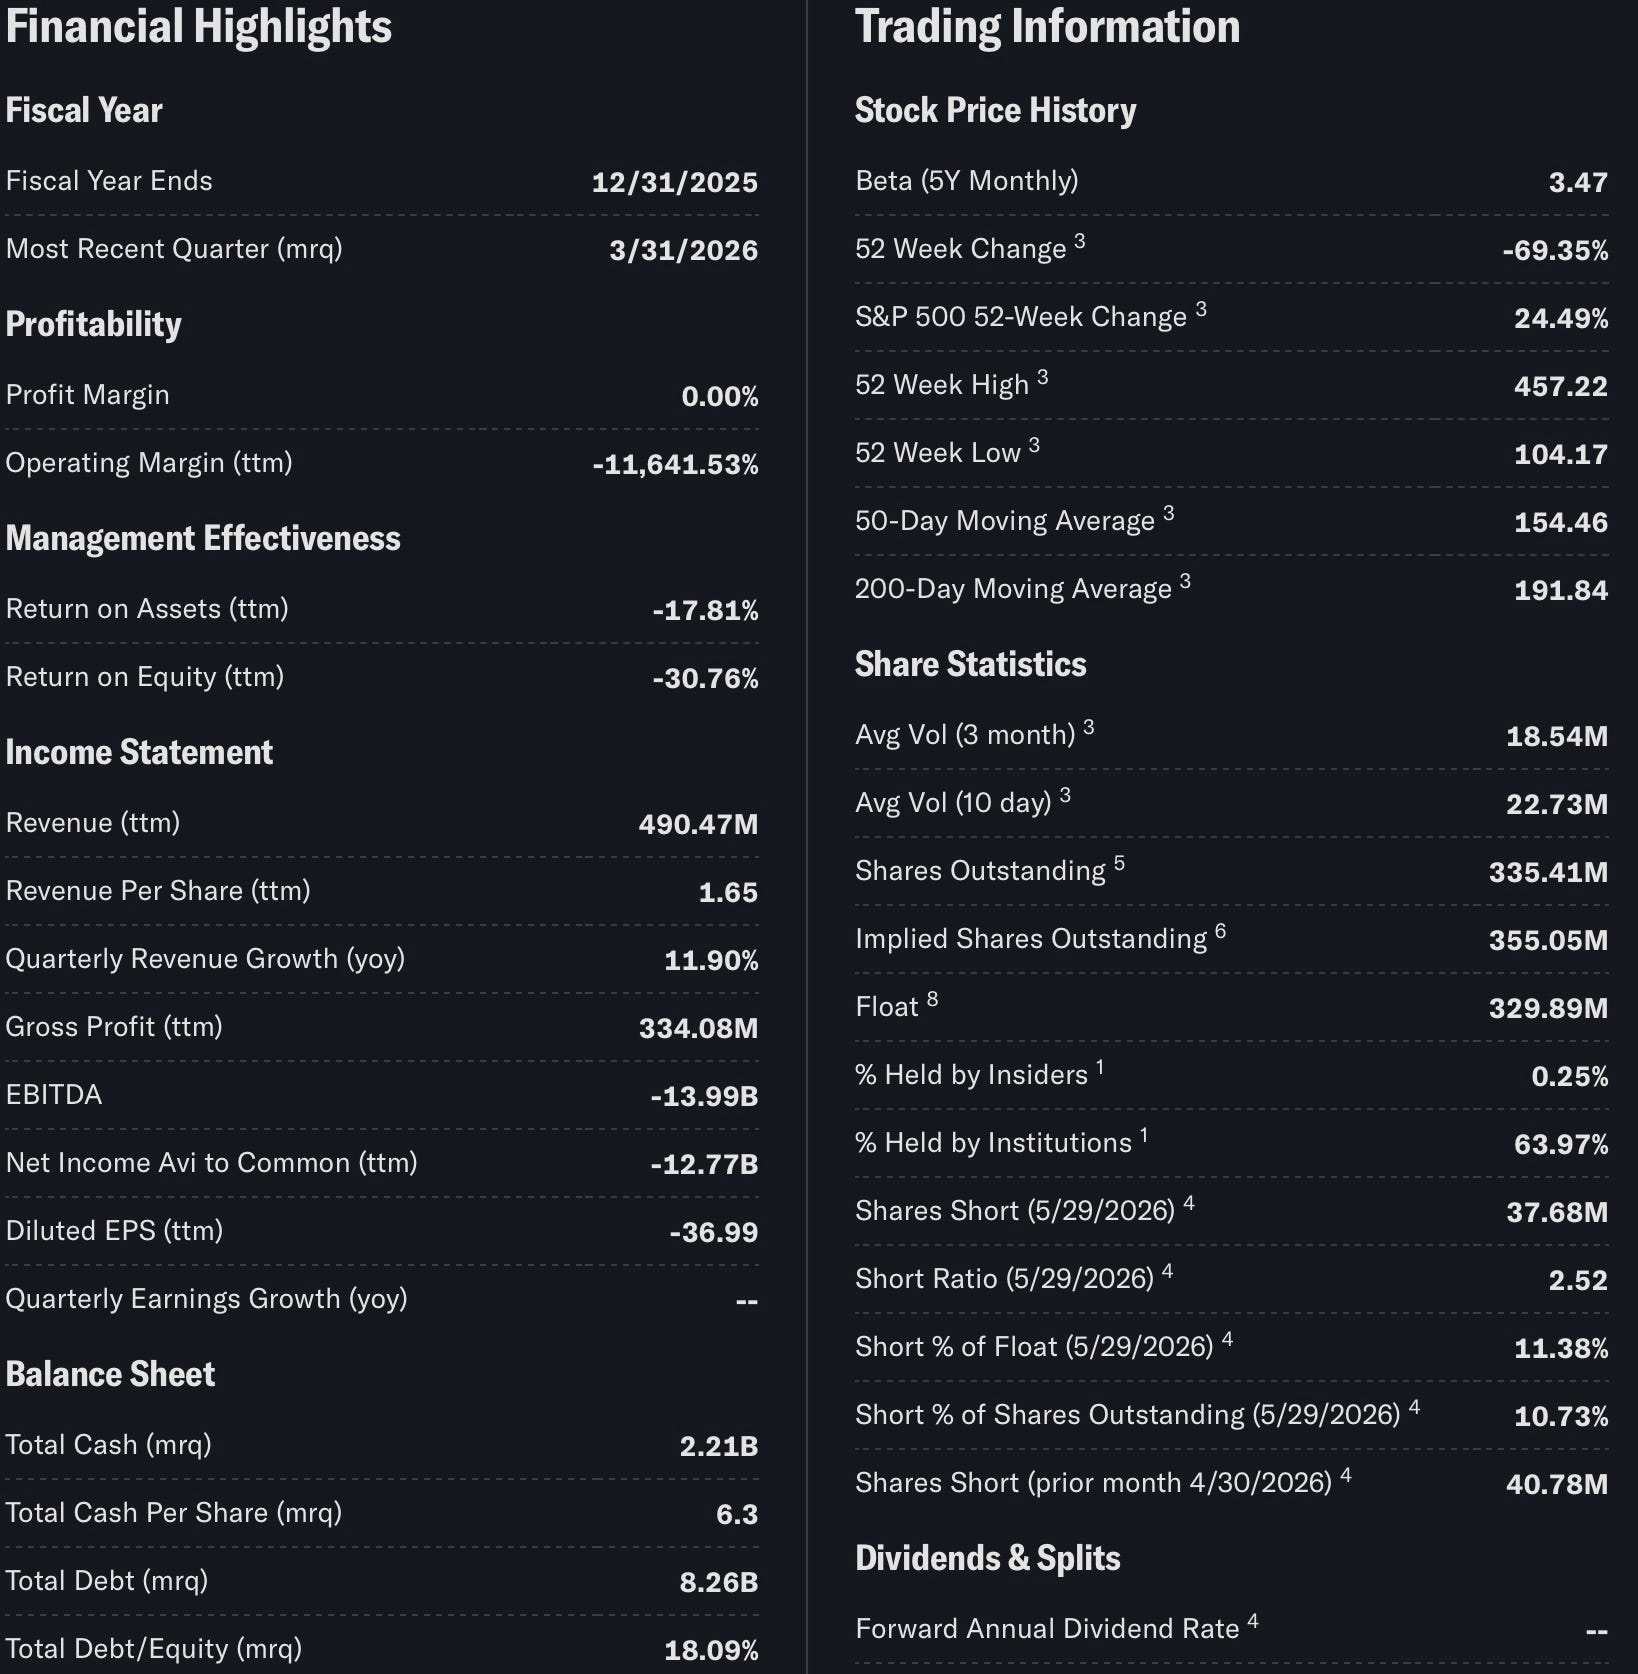
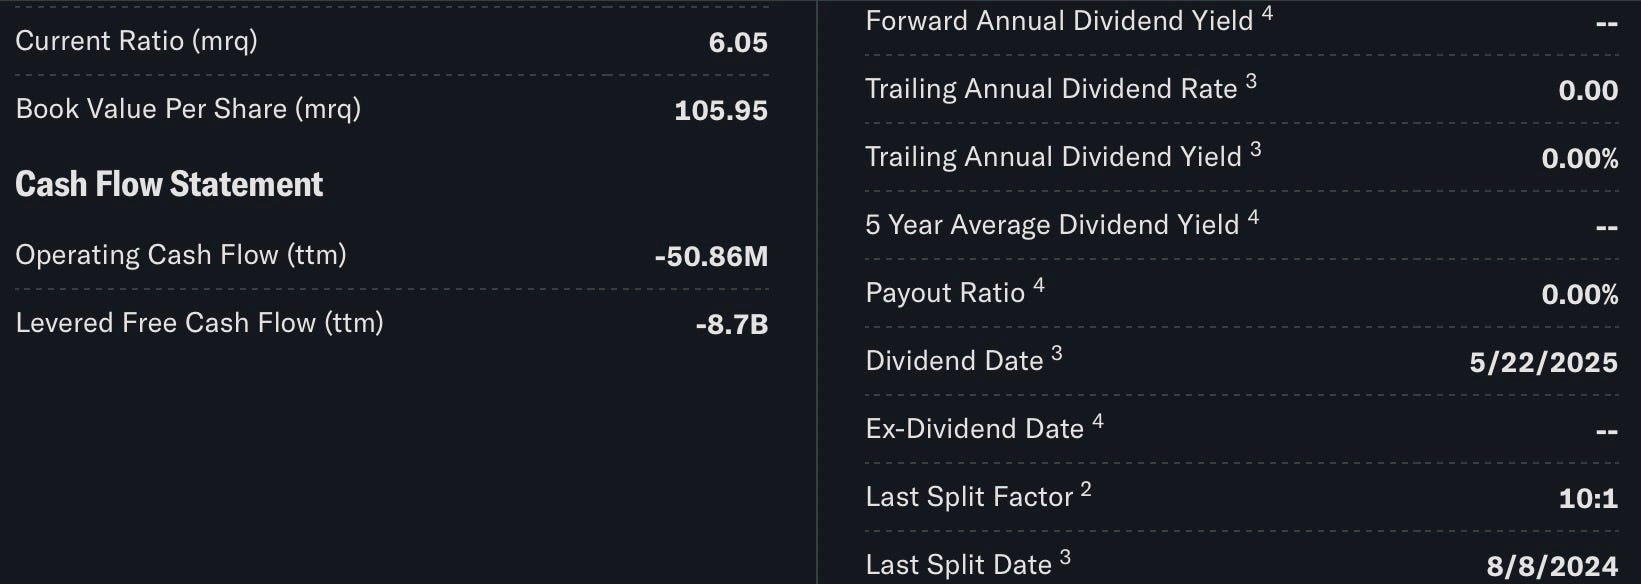
Strategy, Inc. (Nasdaq: MSTR) is no longer a software company in any meaningful sense. Formerly known as MicroStrategy, the company rebranded in February 2025 to reflect what it has, in practice, been since August 2020: the world’s first and largest Bitcoin Treasury Company. Founded in 1989 by Michael Saylor, Sanju Bansal, and Thomas Spahr and publicly listed since 1998, Strategy has systematically converted its balance sheet into a Bitcoin accumulation vehicle, holding as of mid-2026 in excess of 845,000 BTC, representing roughly 4% of the total 21 million coins that will ever exist. That position was acquired at an aggregate cost of approximately 59 billion US dollars.
The business model is architecturally simple but financially complex. Strategy raises capital through a combination of at-the-market equity offerings, convertible notes, and preferred share issuances, then deploys the proceeds entirely into Bitcoin. The company’s proprietary performance metric, BTC Yield, measures the growth in Bitcoin per diluted share over time. In the first quarter of 2025 alone, Strategy reported a 13.7% BTC Yield year-to-date and subsequently raised its full-year target to 25%. The legacy business intelligence and analytics software division continues to generate modest revenues of roughly 490 million US dollars annually, but that revenue is operationally irrelevant to the stock’s valuation. What matters is the Bitcoin treasury, the mNAV premium investors are willing to pay for leveraged exposure to it, and the company’s ability to continue issuing capital accretively.
The macro thesis for holding MSTR rests on three reinforcing pillars. First, Bitcoin itself continues to absorb institutional capital at an accelerating pace, with BlackRock’s IBIT ETF holding over 54 billion US dollars in AUM alone as of early 2026, while more than 70 publicly traded companies worldwide have adopted a Bitcoin treasury standard. Second, Strategy functions as a leveraged call option on Bitcoin through its balance sheet: every 10% move in Bitcoin translates directly into book equity gains via fair-value accounting under ASU 2023-08, which the company adopted in January 2025. Third, Strategy’s issuance flywheel — the mechanism by which ATM equity issuances at premium to NAV accrete BTC per share for existing holders — remains structurally intact as long as the mNAV premium stays above 1.0x. The company has already raised its capital target from the original 42 billion US dollar plan to an expanded 84 billion US dollar framework.
The key dependencies and risks are equally concentrated. Strategy’s operational performance is almost entirely a function of Bitcoin’s price direction, the mNAV premium, share dilution dynamics, and the company’s ability to service approximately 8.25 billion US dollars in convertible debt and roughly 10.3 billion US dollars in preferred stock obligations. With revenues of under 500 million US dollars, the company is structurally dependent on capital markets remaining open to it, which in turn requires Bitcoin to stay in a positive trend. A sustained Bitcoin bear cycle would compress the mNAV premium, restrict the issuance flywheel, and stress fixed obligations simultaneously. This three-way pressure distinguishes MSTR’s risk profile sharply from direct Bitcoin ownership.
SECTION 02
Correlations

The correlation structure of Strategy is, unlike most equities, hierarchical and concentrated. Nearly every meaningful price driver flows back through a single channel: Bitcoin. Understanding how that channel functions, and how it is mediated by sentiment, leverage, and capital market access, is the foundation of any serious MSTR analysis.
BITCOIN (BTC/USD)
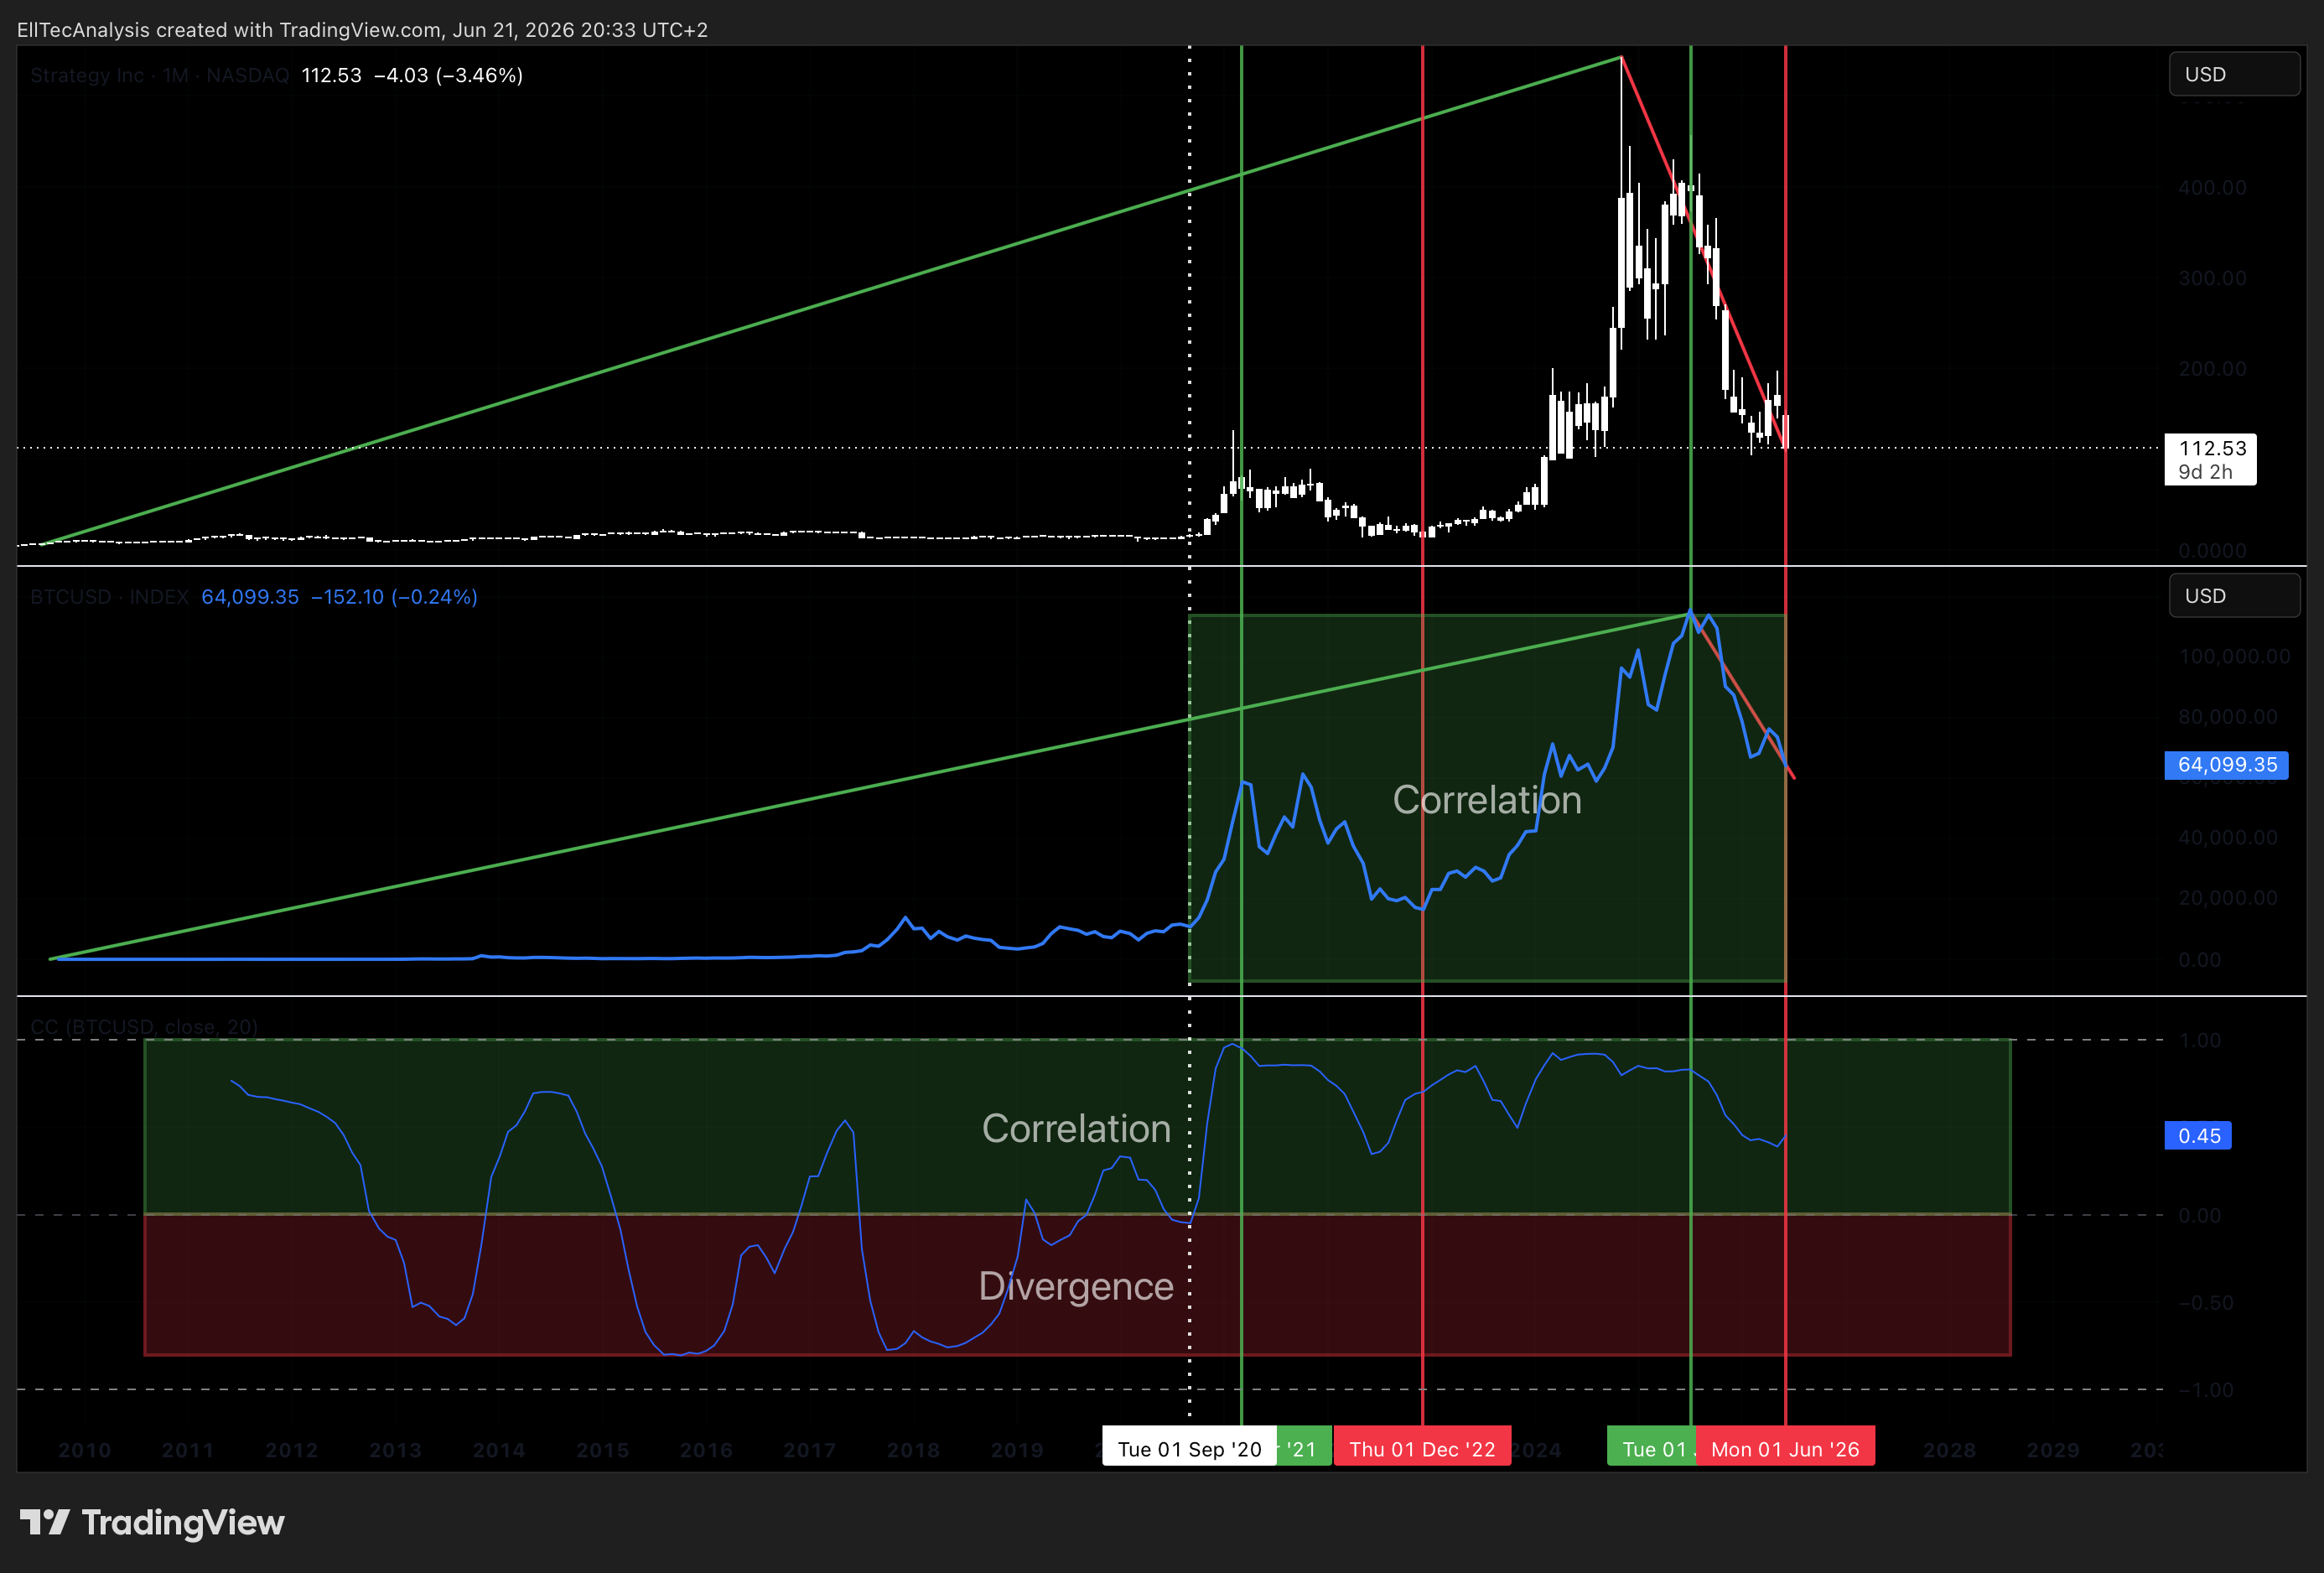
The primary and overwhelming driver of MSTR’s price is Bitcoin since around September 2020. Its stock behaves as a leveraged derivative: MSTR’s beta to Bitcoin has historically ranged from 1.3 to 1.77 depending on the measurement window, meaning that a 10% BTC move tends to produce a 13 to 18% MSTR move in the same direction. In bull phases, the mNAV premium expands, amplifying returns further. In bear phases, premium compression adds a second layer of downside on top of the BTC decline itself, the structural dynamic that defines MSTR as a high-beta Bitcoin proxy rather than a simple holding company.
More about BTC:

MSTR / BTC RATIO — STRATEGY MEASURED IN BITCOIN
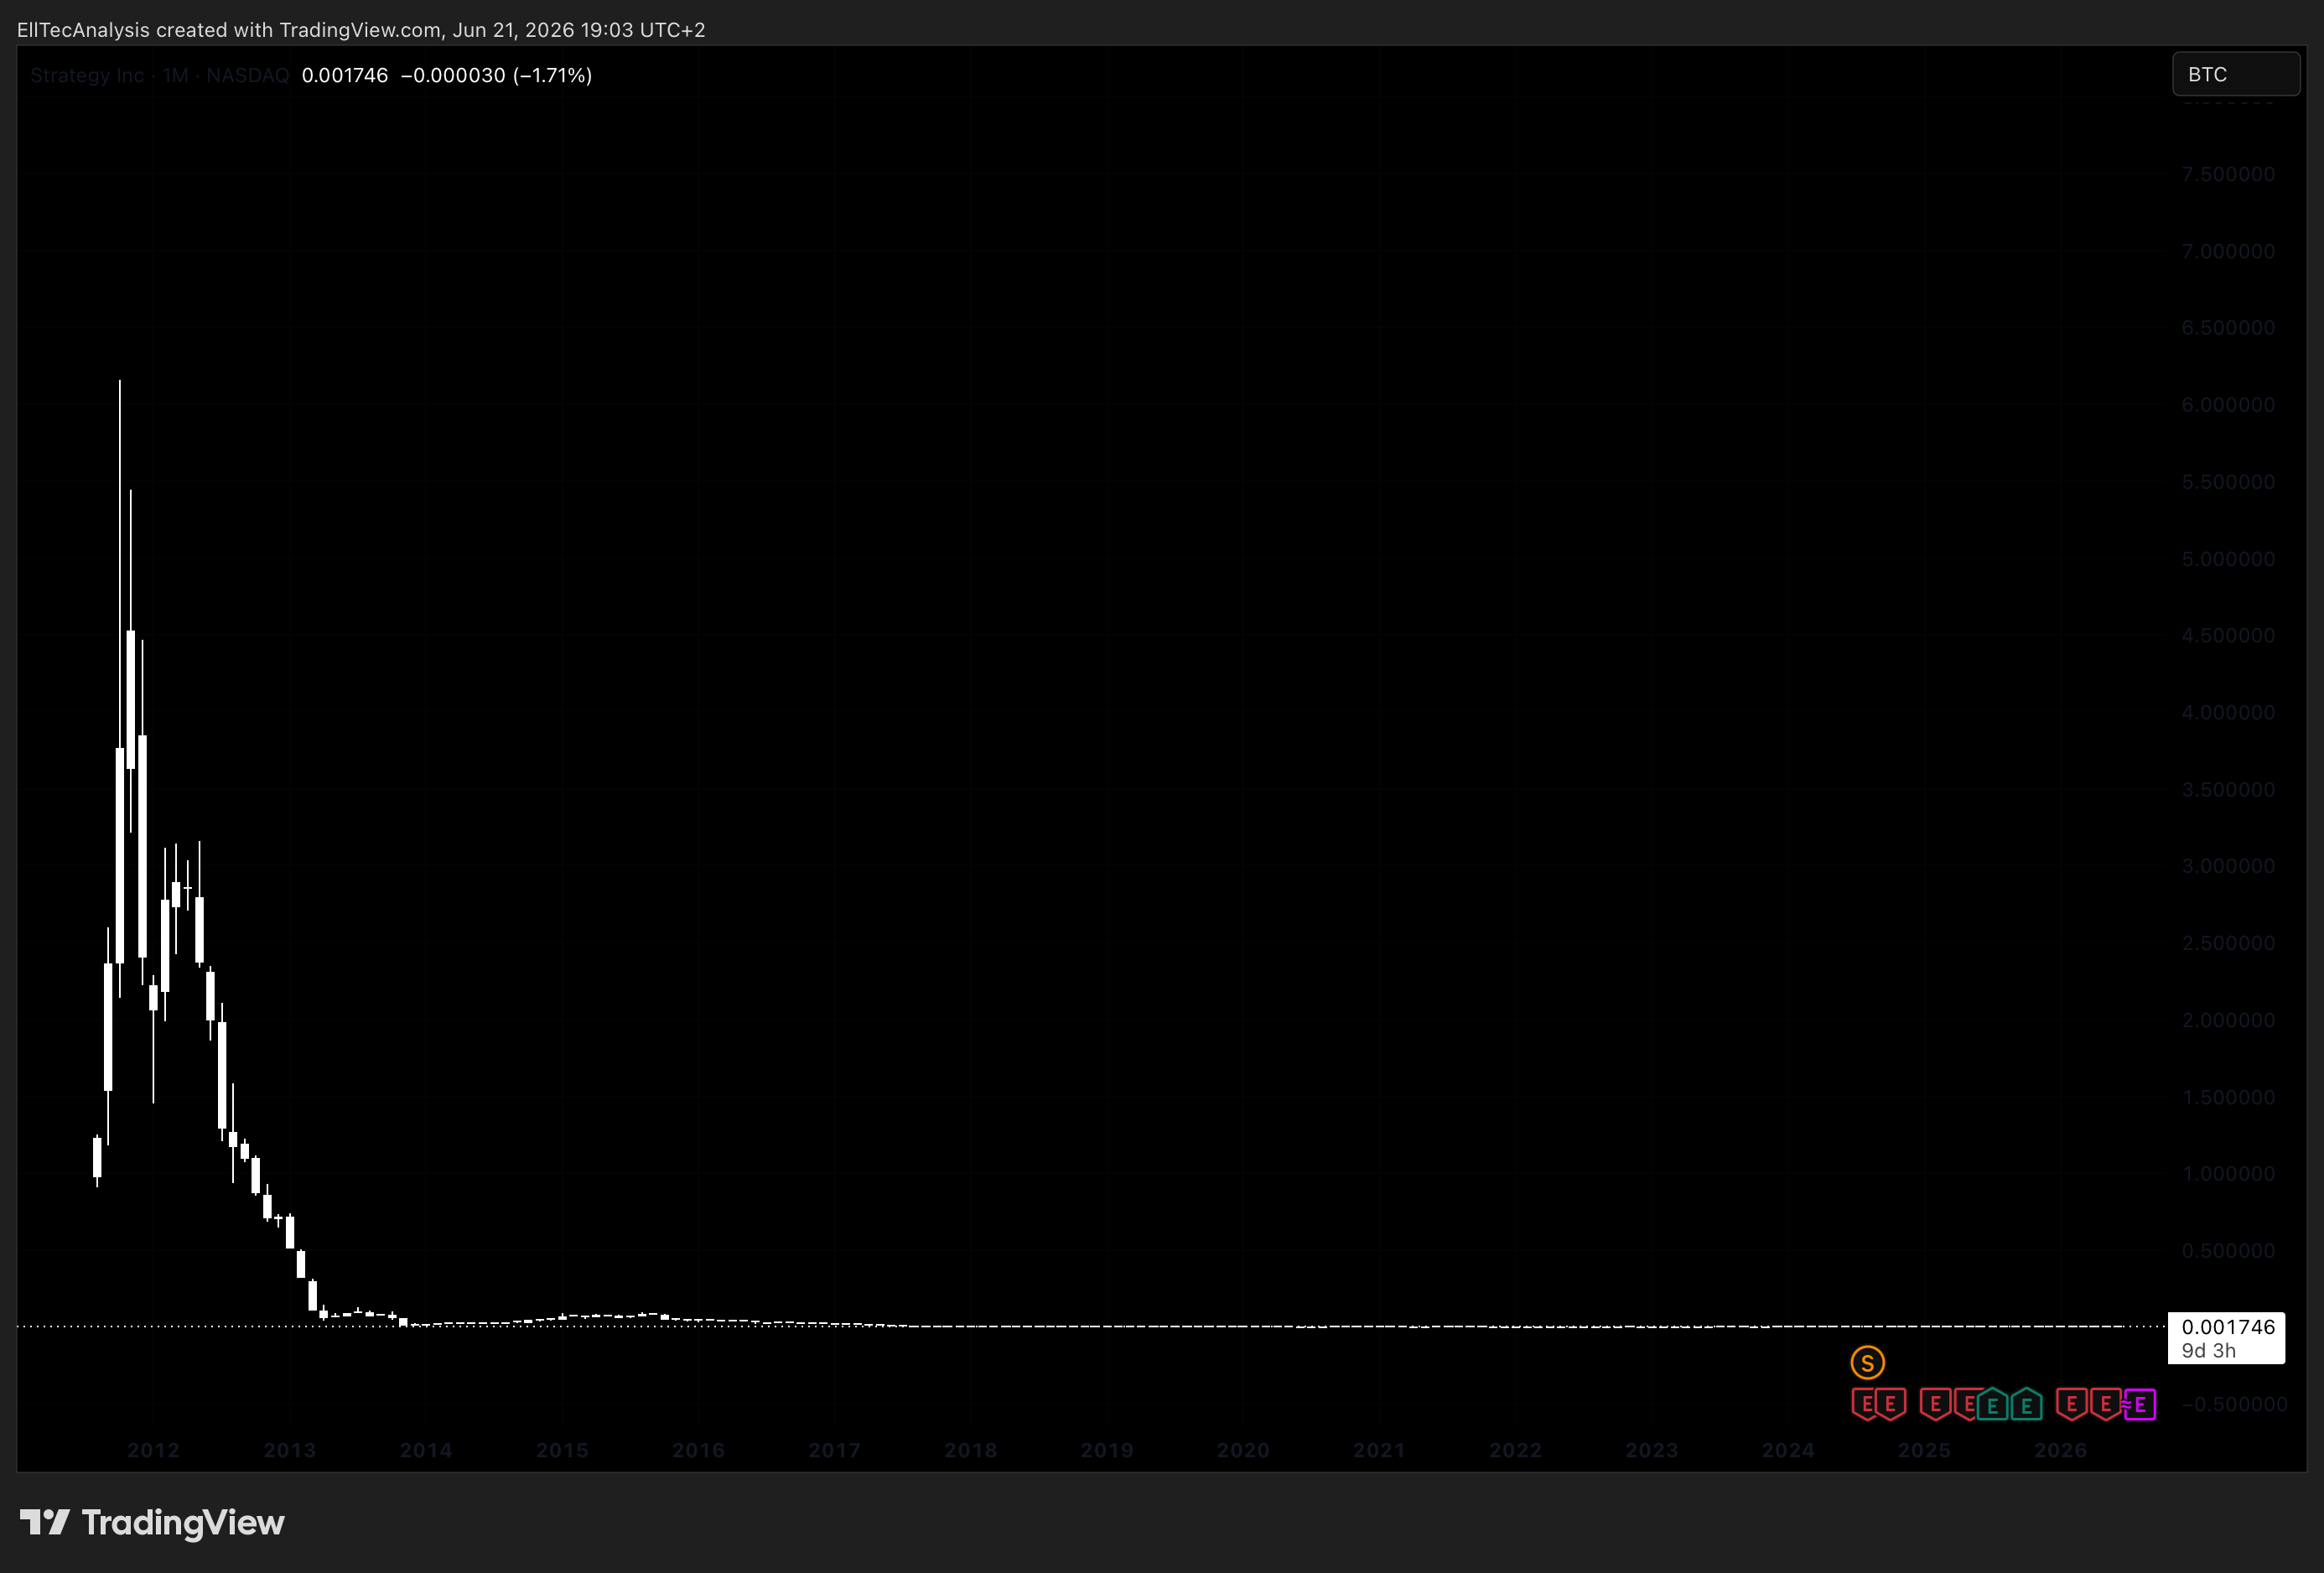
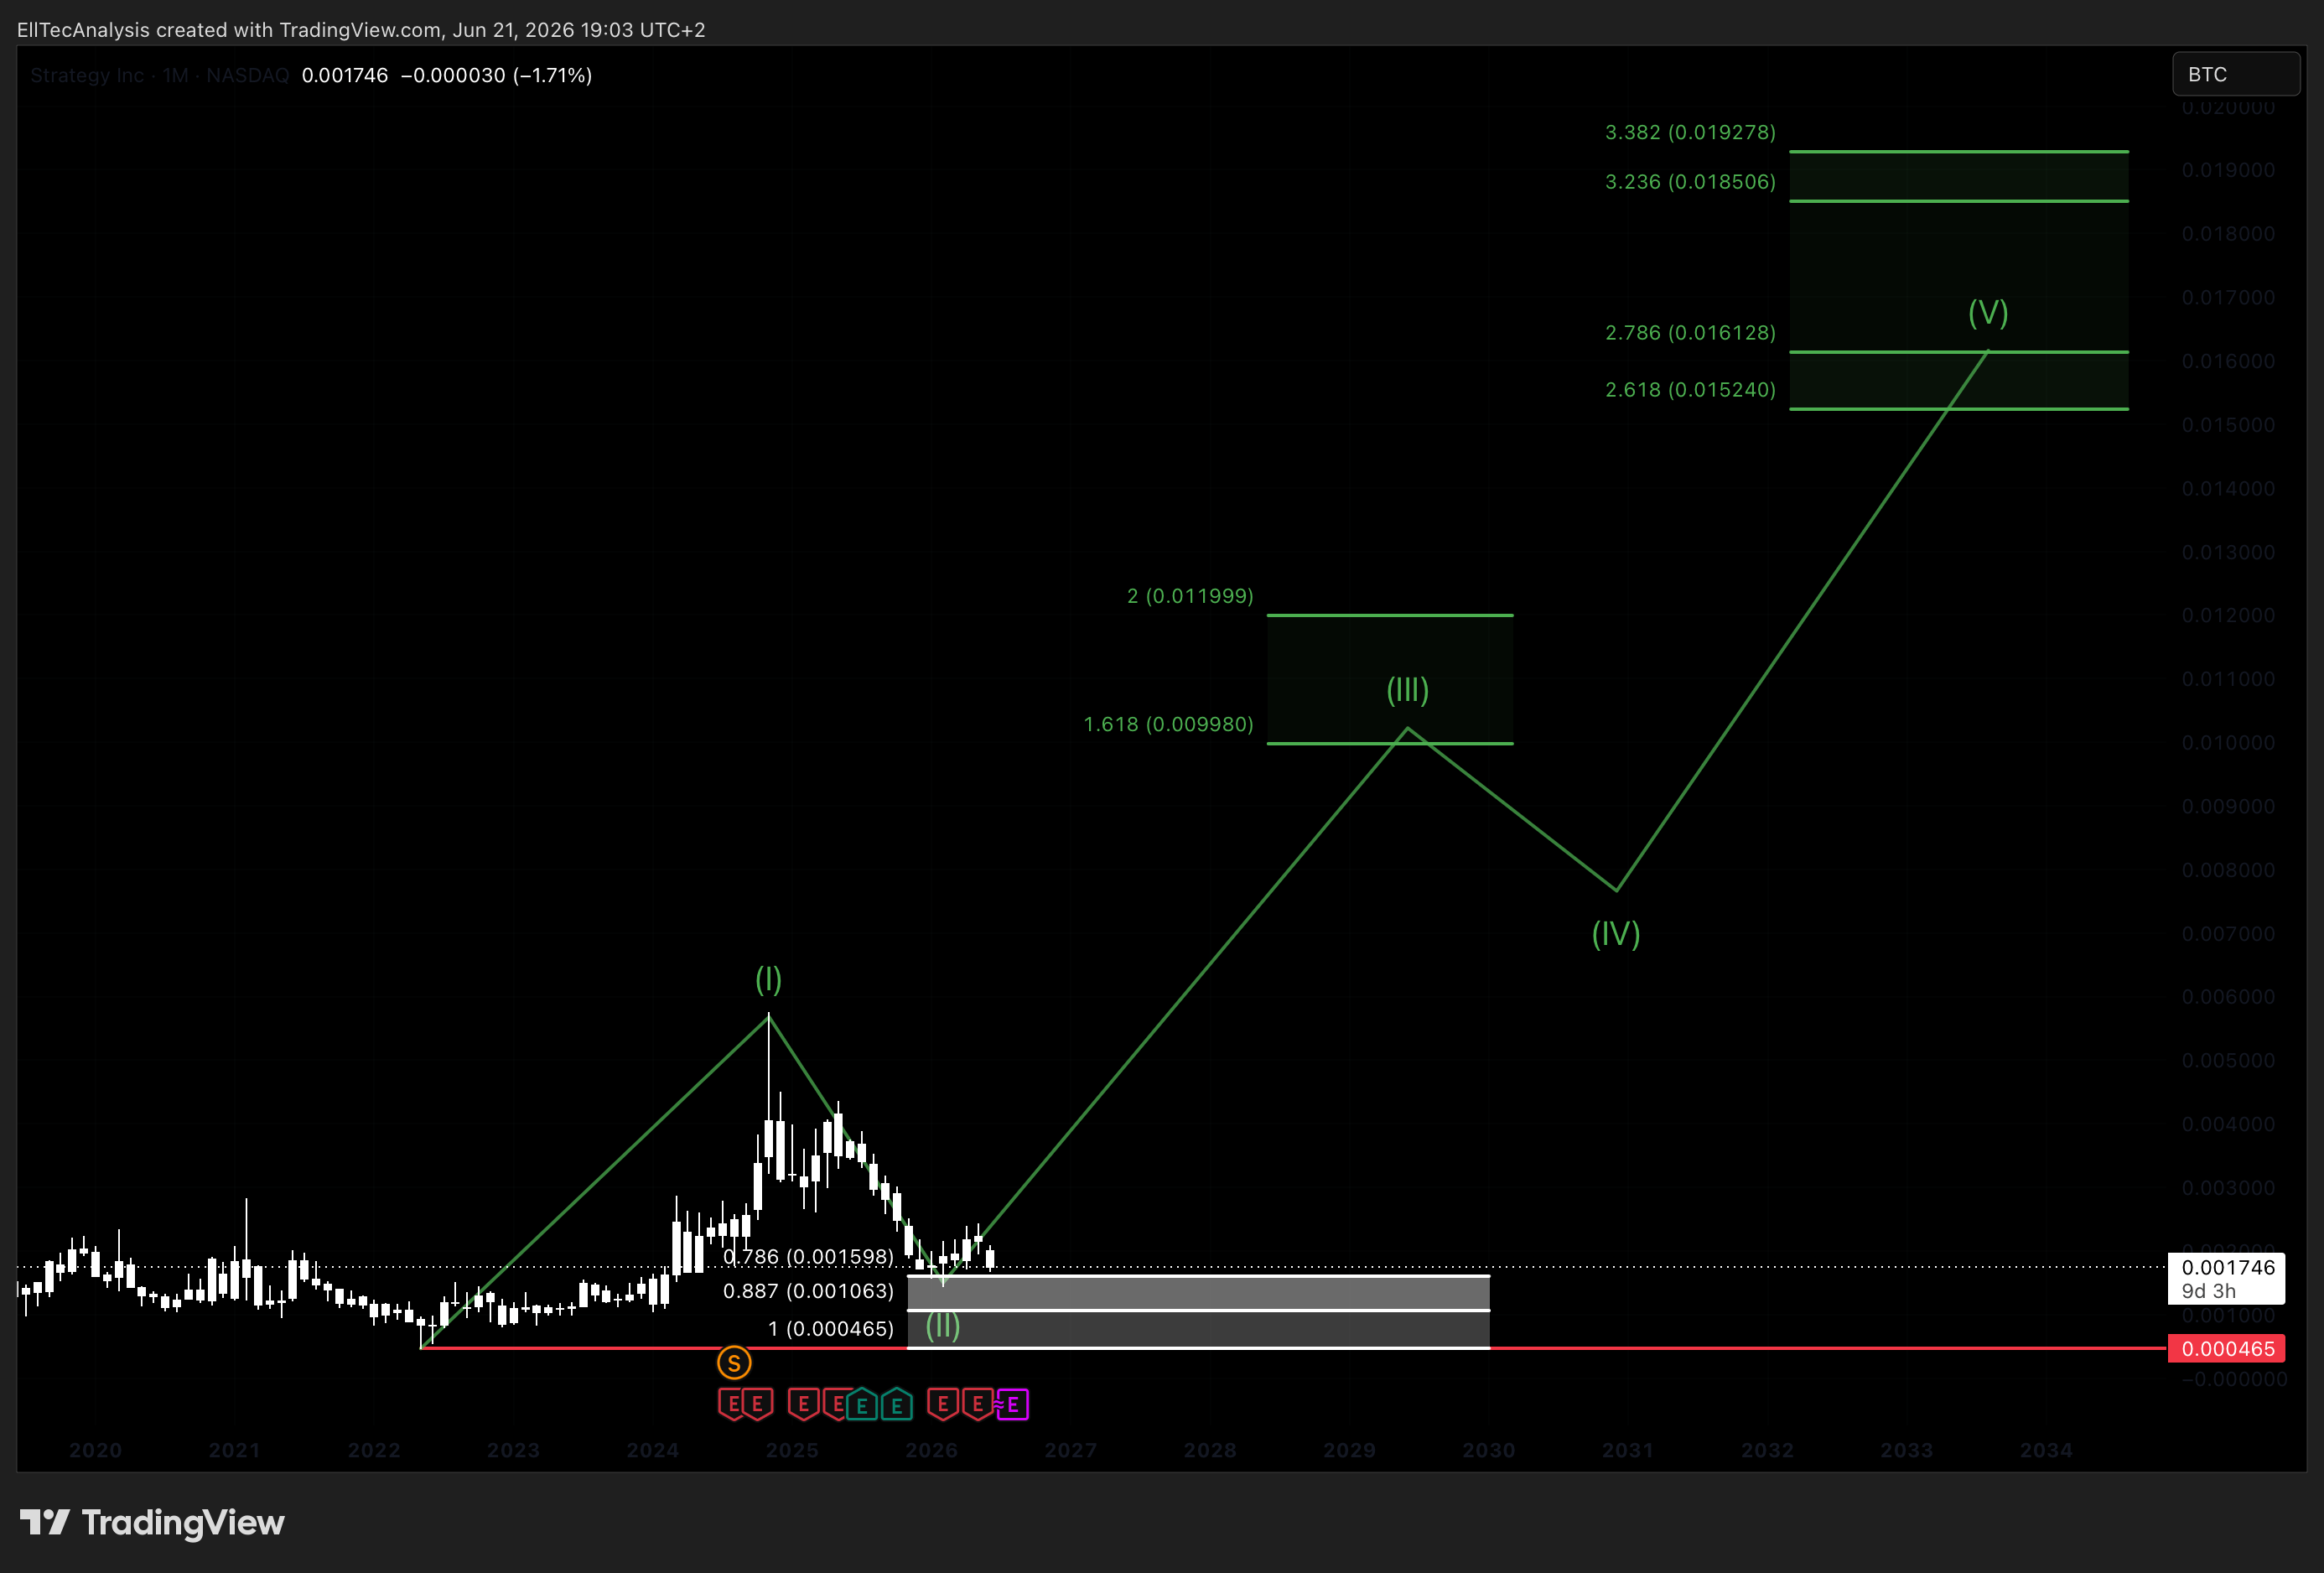
The MSTR/BTC ratio is one of the most informative single charts in assessing Strategy’s relative positioning. When the ratio compresses, Bitcoin is outperforming MSTR in percentage terms, often signaling de-risking from leveraged crypto proxies toward the underlying asset. When it expands, institutional and retail capital is rotating into MSTR for amplified exposure, typically in the early and middle stages of a Bitcoin bull cycle. The ratio has historically found structural support at levels corresponding to the depths of prior bear markets, most notably the 2018–2019 and 2022 cycle lows. In this chart a high probability reversal zone can be calculated, reching from 0.001598 BTC to 0.000465 BTC, a bullish trend reversal could happen in this zone, this would add up to the primary Elliot Wave scenario displayed below.
TOTAL CRYPTO MARKET CAP (TOTAL)
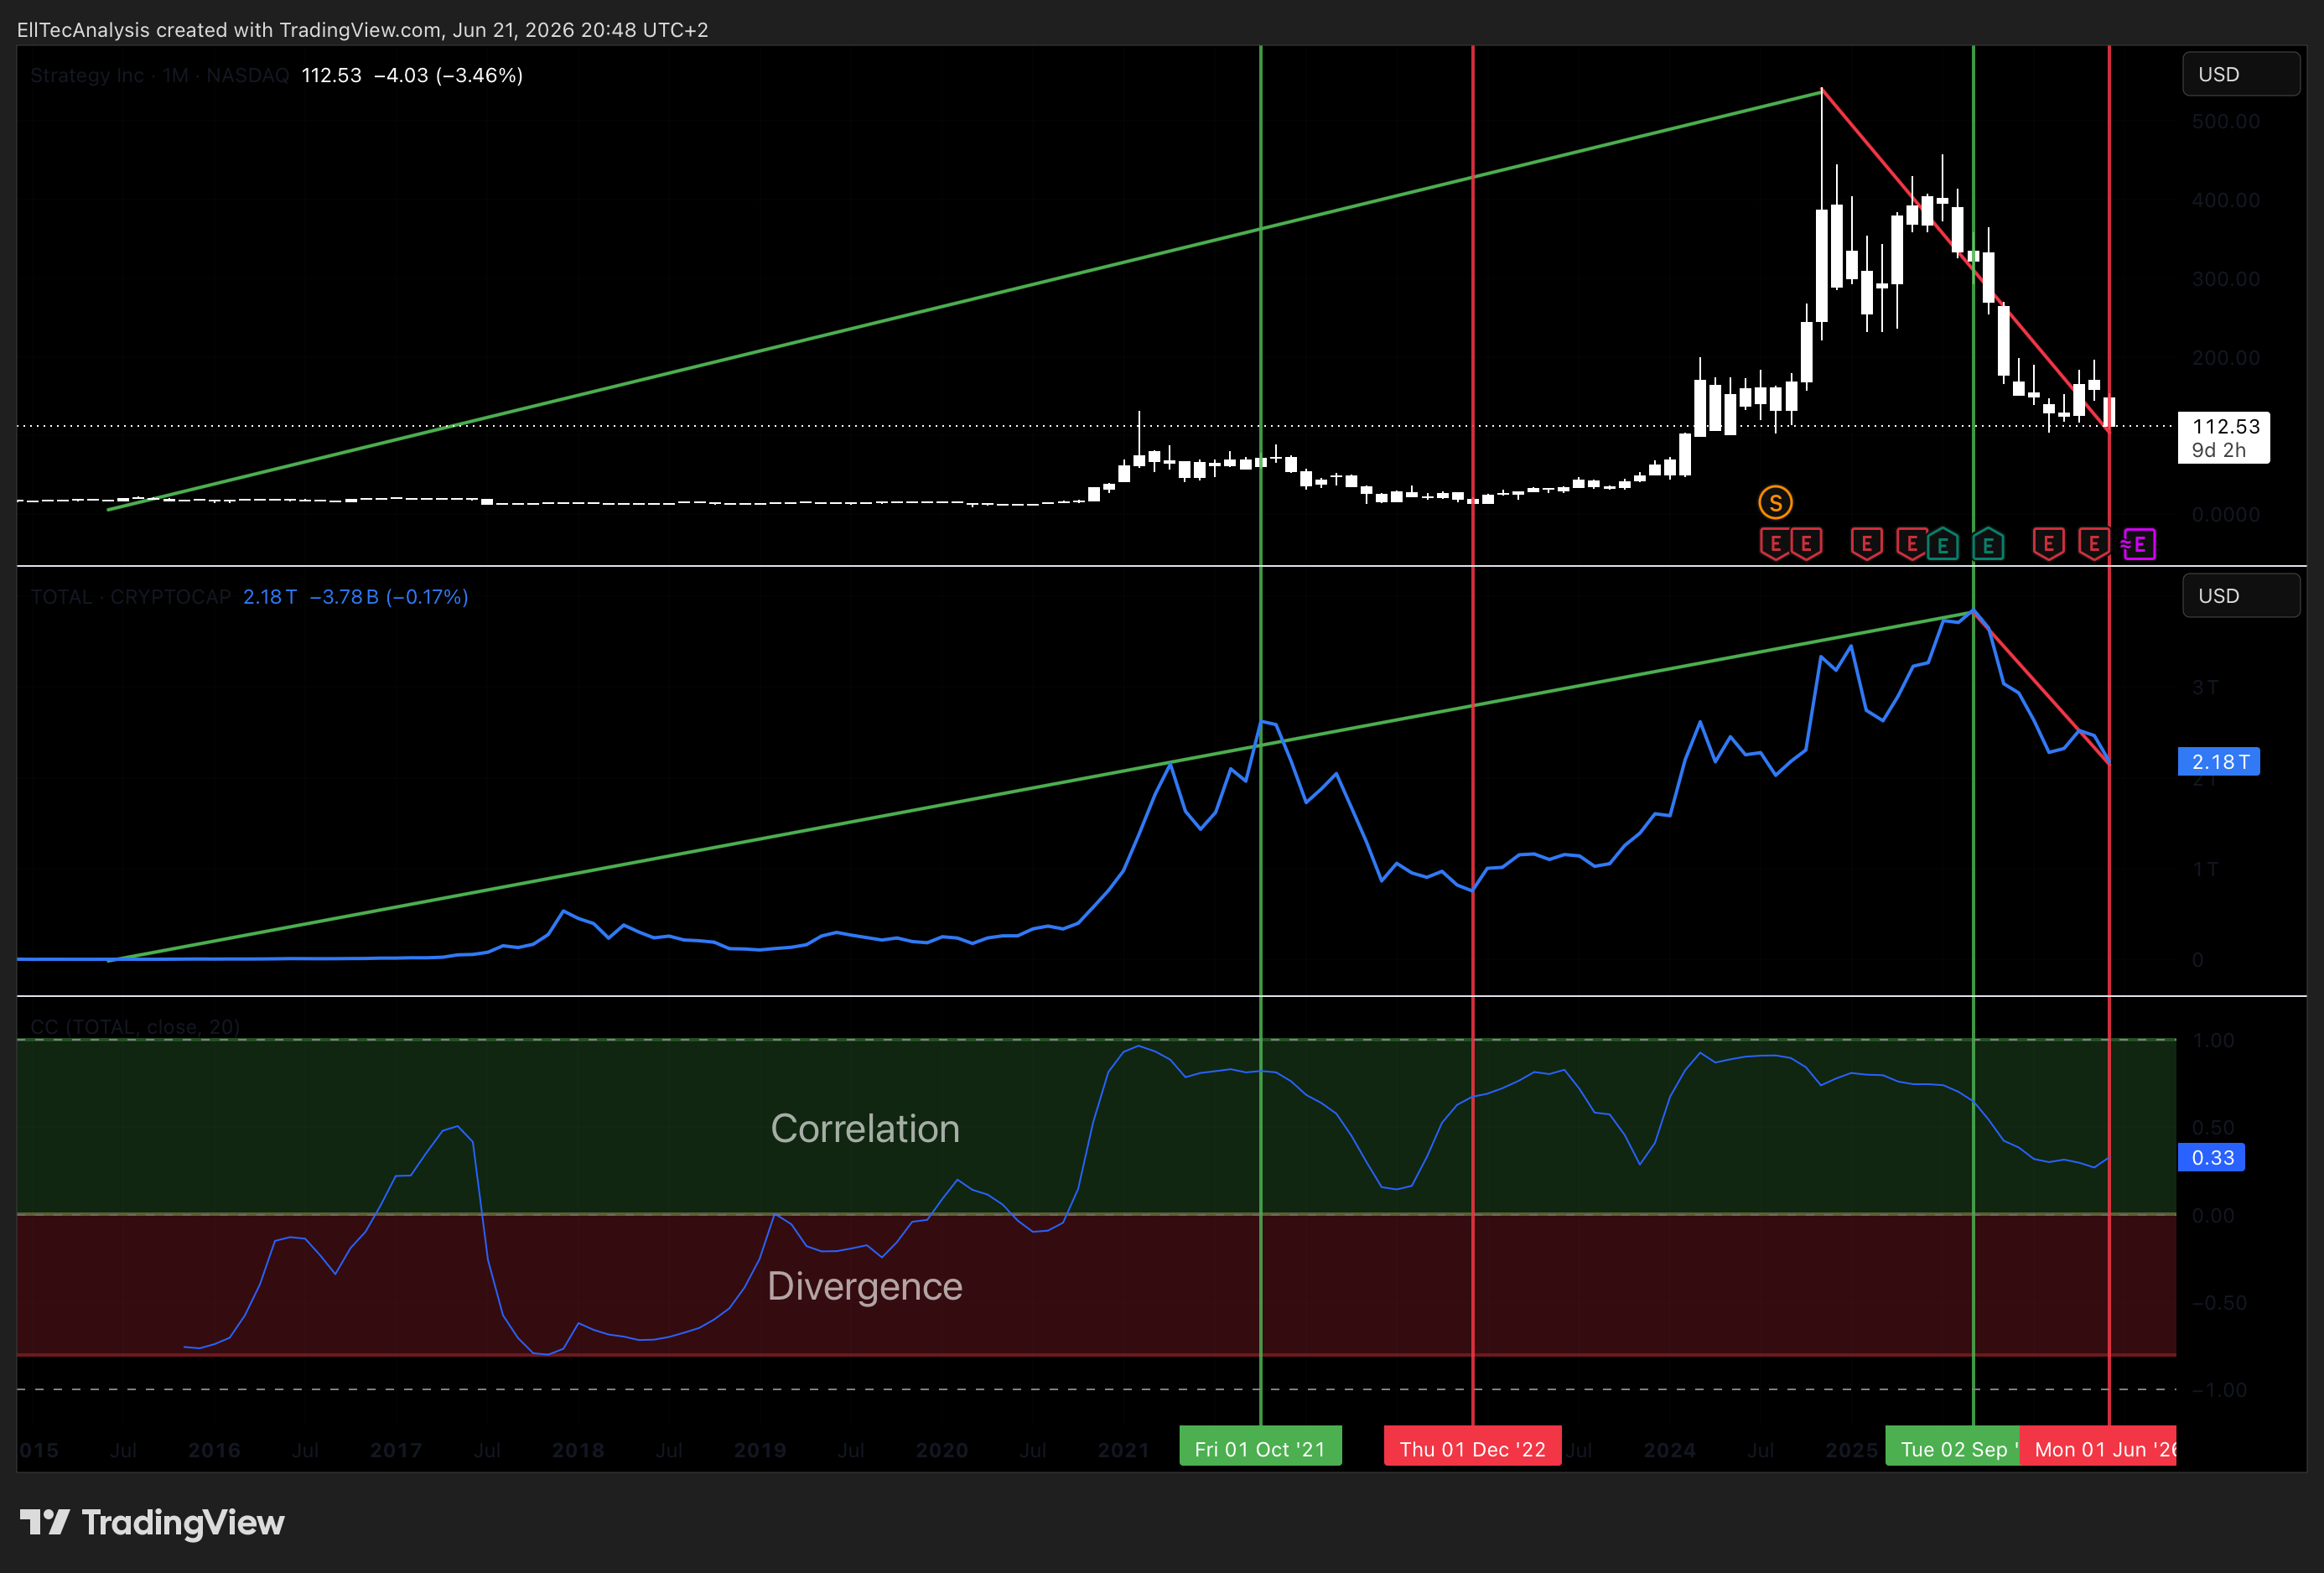
The total crypto market capitalization broadly tracks the risk-on / risk-off regime for digital assets. MSTR’s correlation with TOTAL is strong and positive, reflecting the fact that broader crypto sentiment influences both Bitcoin directly and the premium investors are willing to pay for leveraged Bitcoin exposure through MSTR equity. In contraction phases for TOTAL, MSTR typically sells off with disproportionate force, as institutional risk reduction hits high-beta proxies hardest. In expansion phases, MSTR tends to lead the broader crypto equities space given its scale, liquidity, and the availability of derivatives on its shares.
NASDAQ 100 (QQQ) AND TECHNOLOGY SENTIMENT
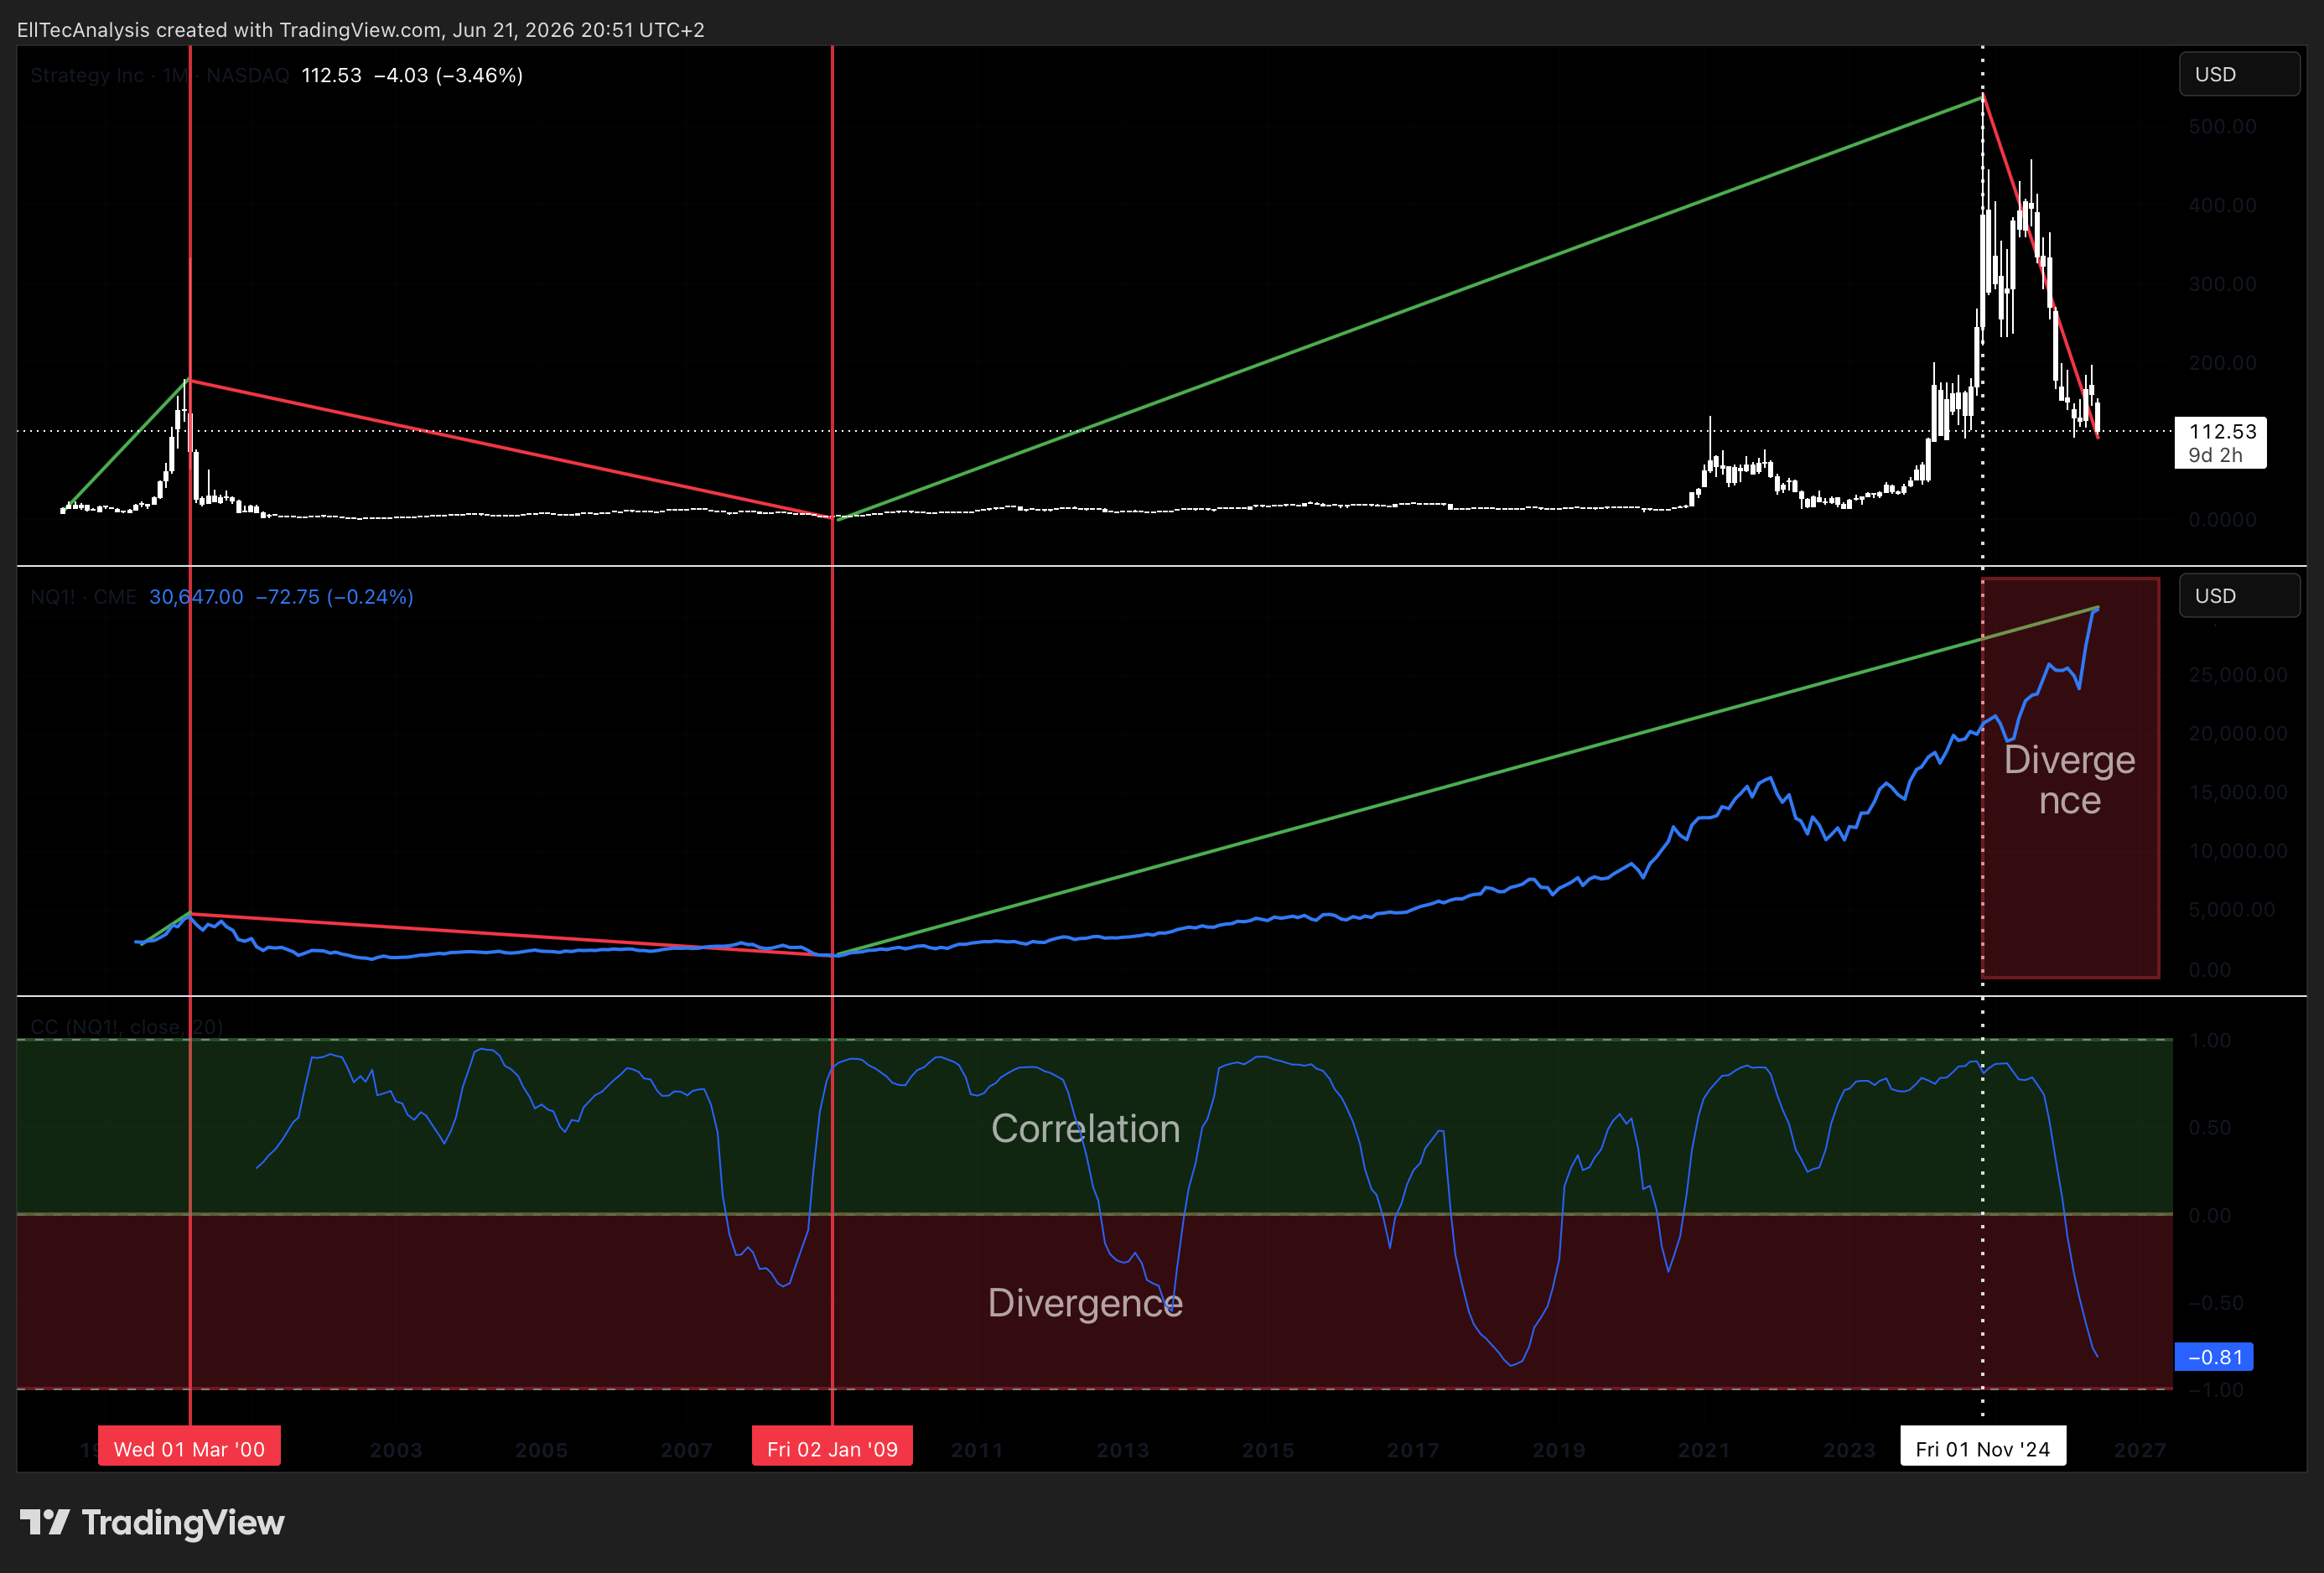
Despite no longer functioning as a software company in any operational sense, MSTR retains a meaningful secondary correlation with Nasdaq technology sentiment. This connection arises partly from index membership and institutional categorization, and partly from the broader risk appetite that simultaneously drives technology multiples and Bitcoin valuations. Overall tech sector risk appetite does influence the mNAV premium via general sentiment spillover. In practical terms, a broad risk-off move in technology is often accompanied by premium compression in MSTR, adding a second layer of headwind on top of any BTC weakness. Since November 2024 Nasdaq and Strategy showed a strong divergence, while the Nasdaq reached new ATHs, Strategy sold off strong. Such a divergence can result in a trend reversal, giving MSTR tailwinds. This would align with the ElliotWave primary scenario displayed below.
More about the Nasdaq 100:

SECTION 03
Seasonality
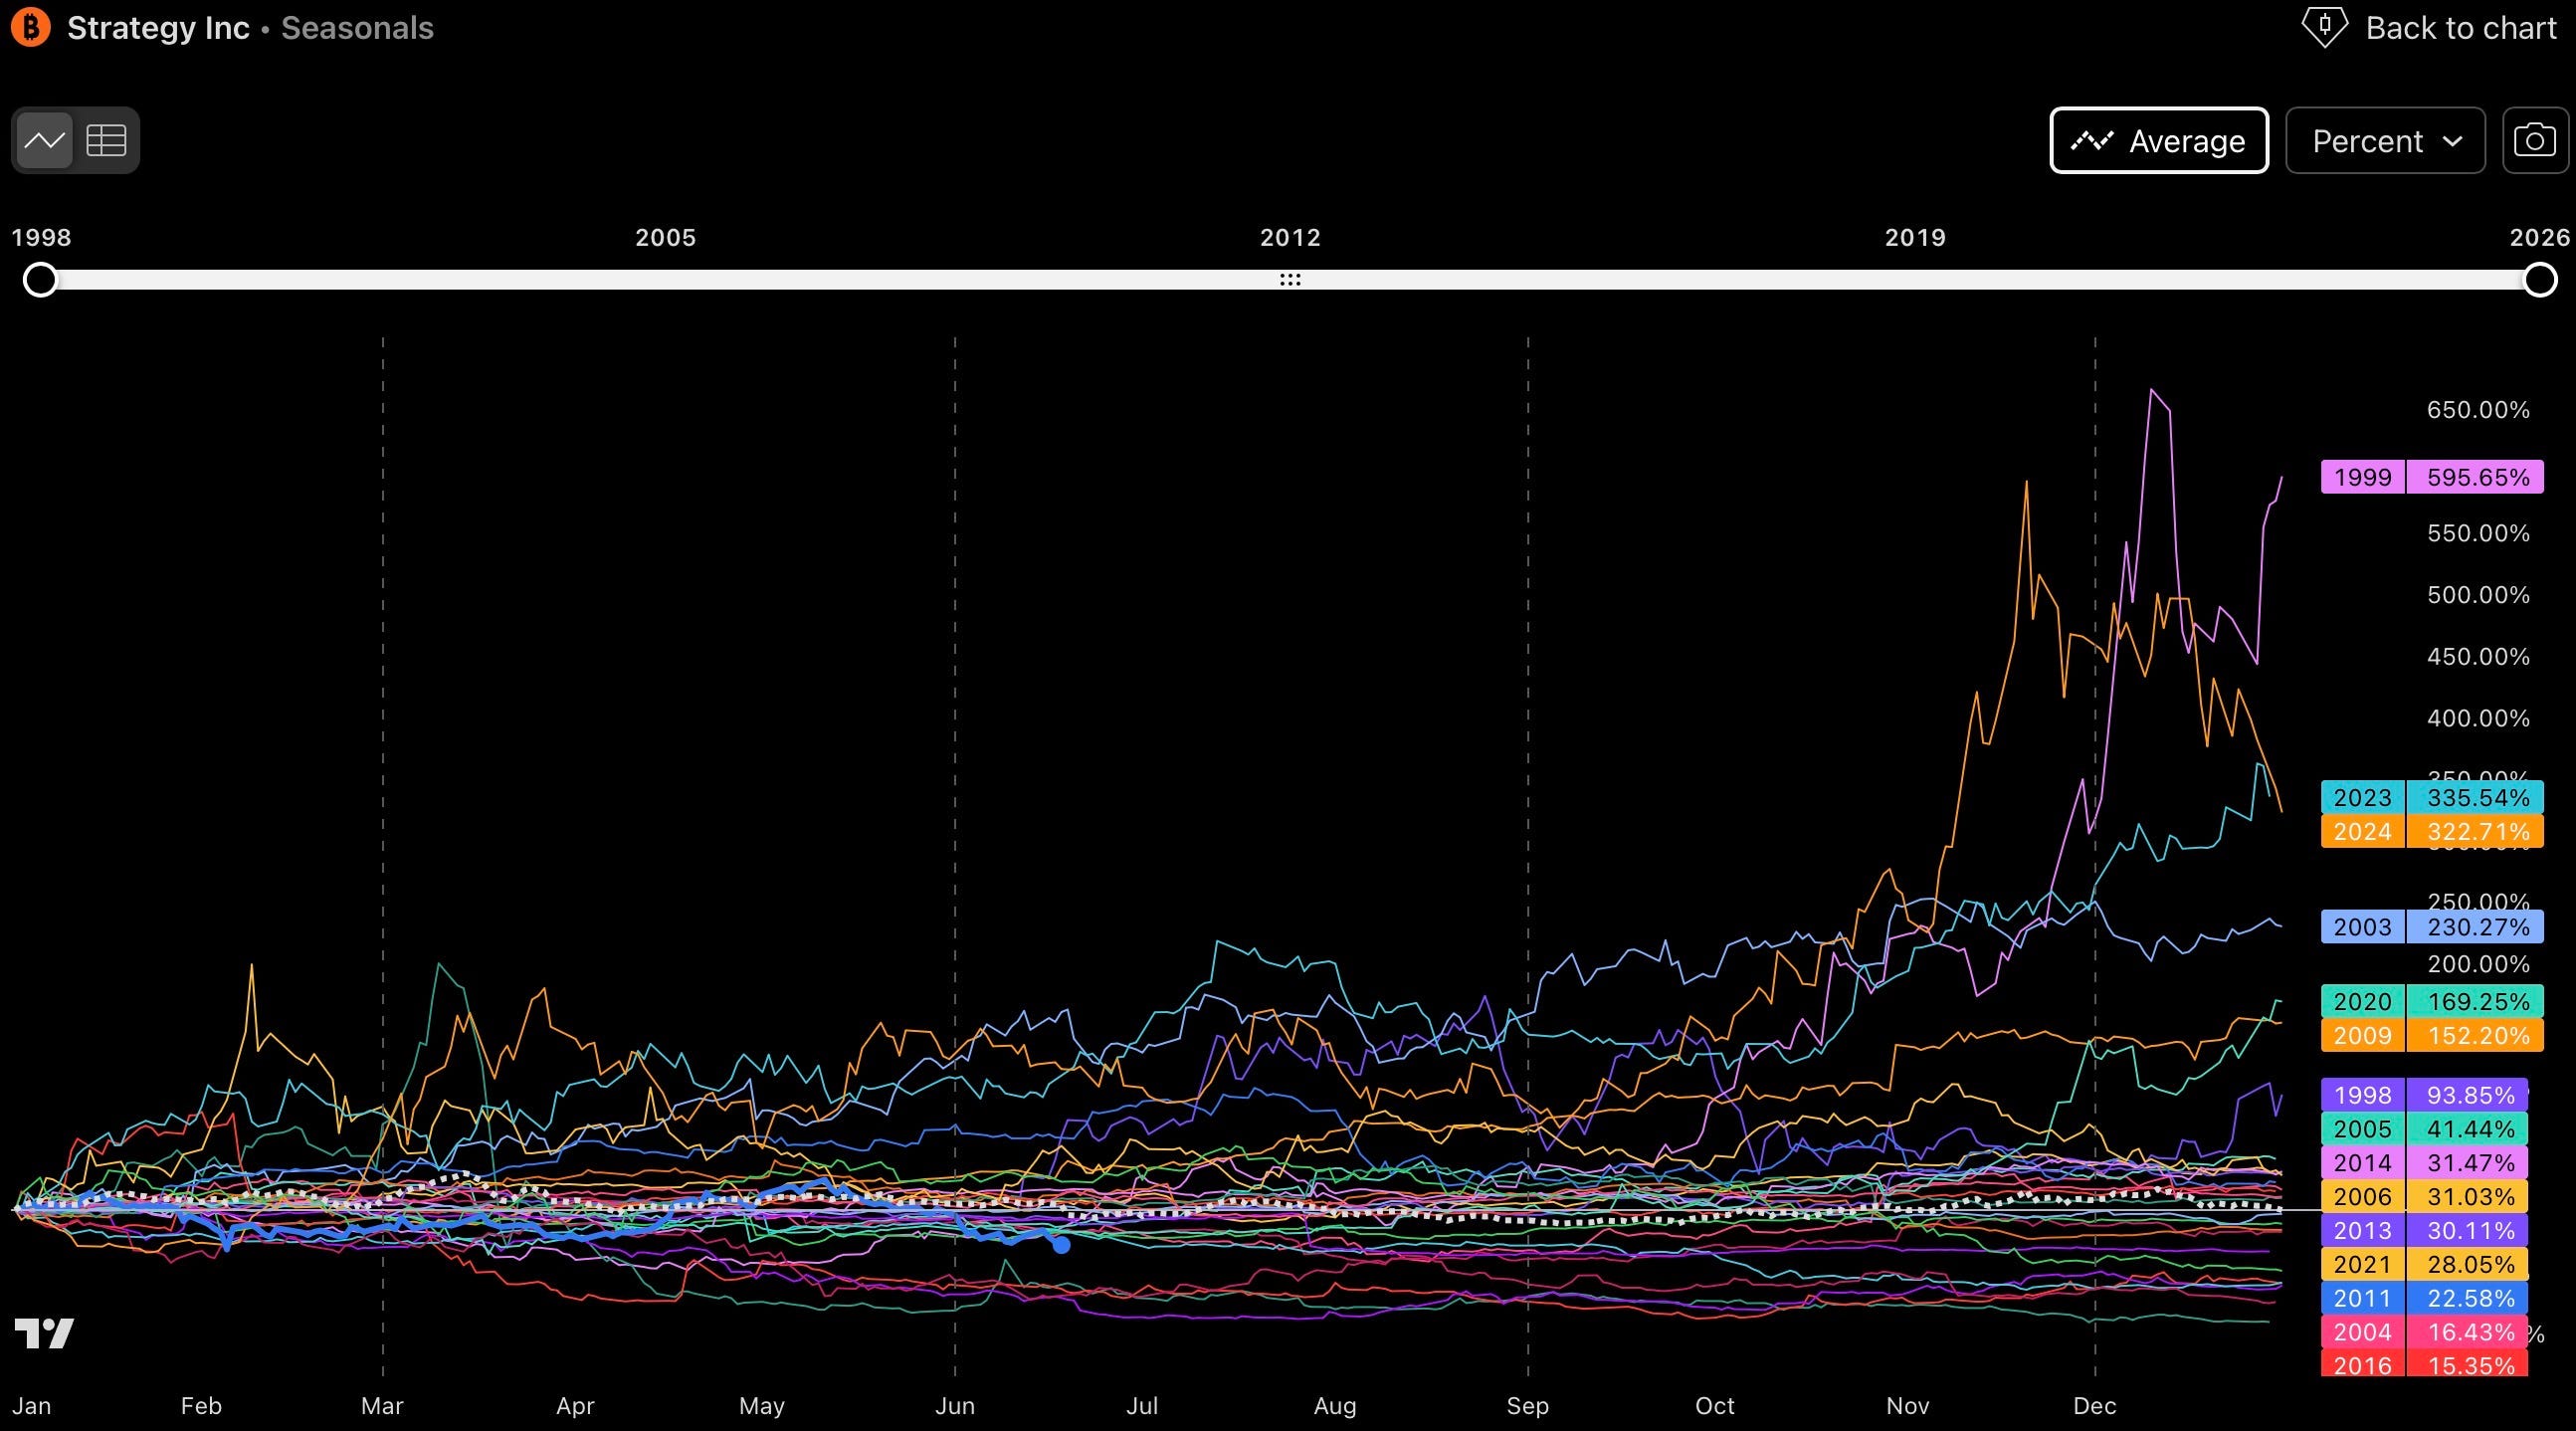
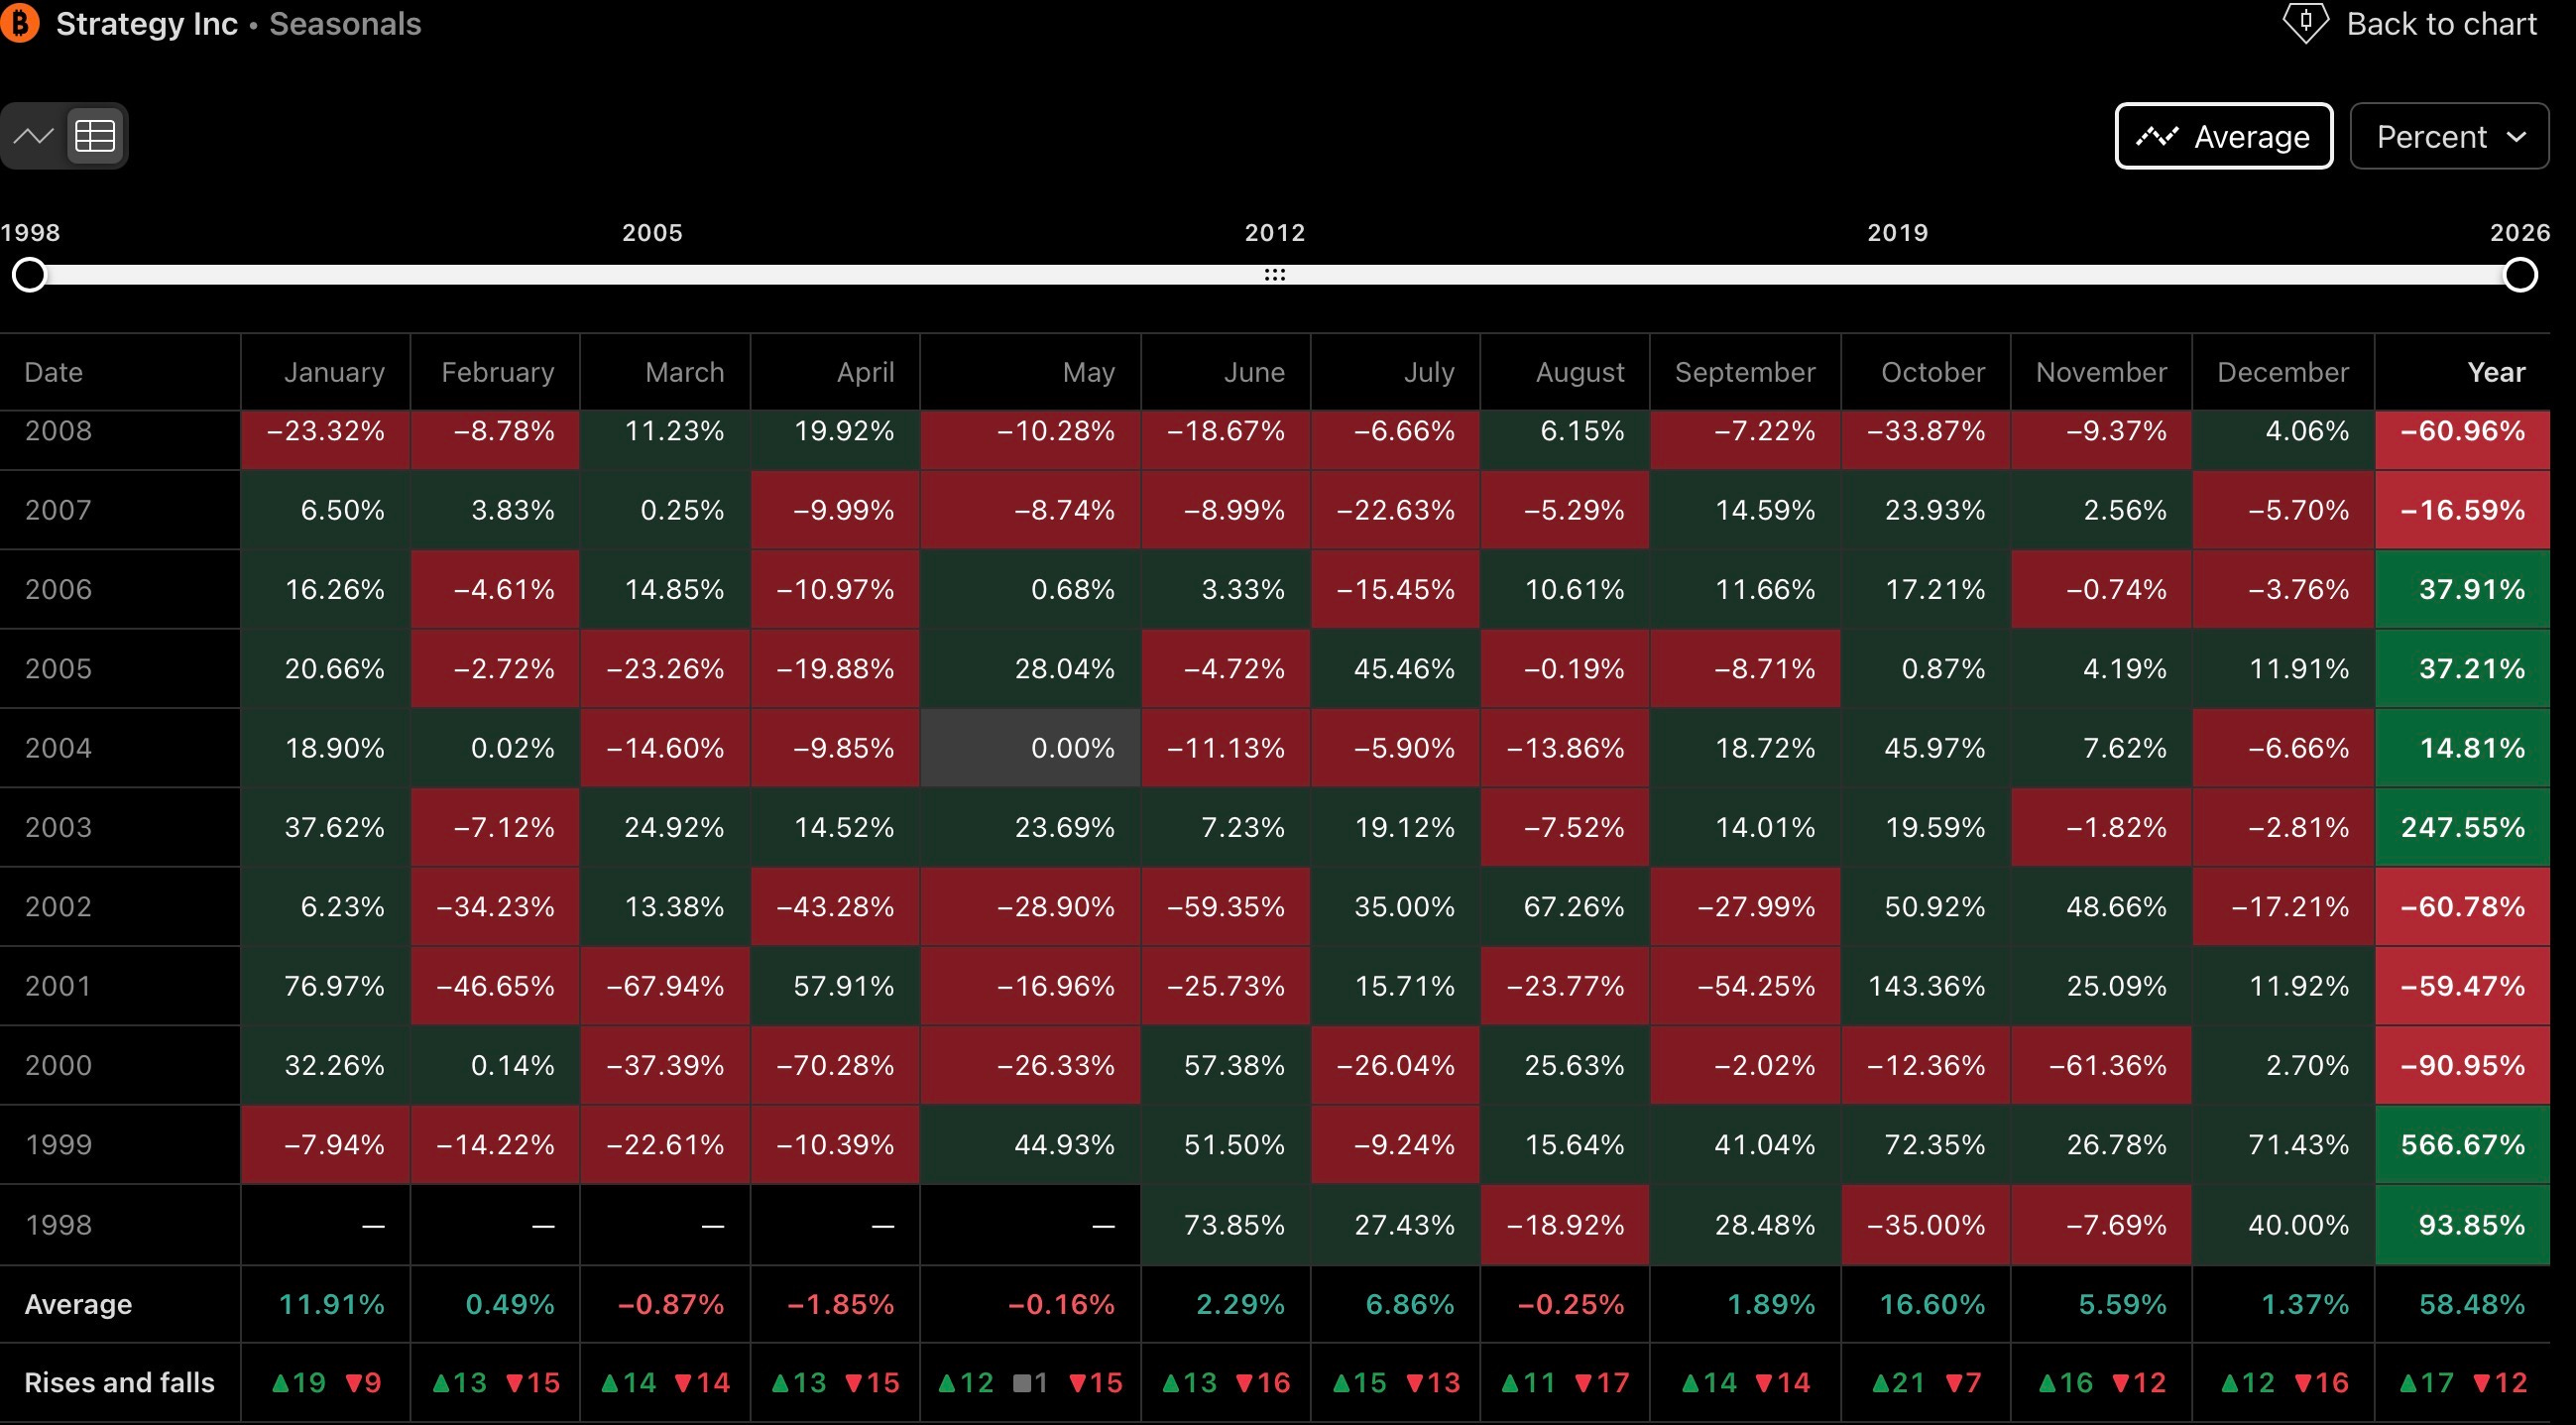
Seasonal analysis of MSTR is particularly instructive given its amplified relationship with Bitcoin’s own cyclical patterns. On a historical average, the months of March through May have delivered relatively weak or flat performance, consistent with mid-cycle consolidation tendencies that also appear in Bitcoin seasonality data across prior cycles. August has historically been a modestly negative month, with average returns near minus 0.25%. This stagnation tendency in the spring and late summer periods is consistent with a period of corrective base-building rather than directional expansion.
The four-month window from October through January has historically been by far the most powerful seasonal phase for MSTR, generating strongly positive average returns in the majority of measured years. October in particular has repeatedly served as an inflection point, both in Bitcoin and in MSTR, where accumulation phases conclude and impulsive expansions begin. This seasonal tendency aligns directly with the primary Elliott Wave expectation: if the current Wave 2 correction completes within the defined target zone over the coming weeks, MSTR would be positioned to begin a Wave 3 expansion heading into the historically strongest seasonal window of the year. A position built during the corrective phase, with the October–January seasonal tailwind in view, maps naturally onto the broader structural thesis.
SECTION 04
