

EllTec Analysis Framework
Market Structure Clearly Explained: A Complete Guide to Every Section of an EllTec Analysis Report


Why This Guide Exists
Readers who follow EllTec Analysis regularly will notice that every report, whether it covers an airline, a semiconductor name, or a cryptocurrency, is built from the same fixed structure: fundamentals, correlations, seasonality, technical analysis, alternative scenarios, trade planning, risk assessment, a conclusion, and a disclaimer. That structure is not a formatting habit. Each section exists to answer a specific question, in a specific order, and the order itself carries meaning. This article walks through every section in detail: what it measures, why it is built the way it is, what each ratio and each Fibonacci level actually represents, and how the pieces connect into a single argument rather than nine separate opinions. Read this once, and every EllTec report afterward will make considerably more sense.
The Logic of the Architecture
An EllTec report moves from the general to the specific and from the abstract to the actionable. It opens with fundamentals because price structure means very little without knowing what is actually driving the asset underneath it: a textbook-perfect wave count on a company with deteriorating margins and an unsupportive balance sheet is a much weaker thesis than the same count on a company whose financials are strengthening. From there, correlations and seasonality widen the lens to the asset’s relationship with the broader macro environment and the calendar, since almost nothing trades in true isolation. Only once that context is established does the report narrow into the Elliott Wave and Fibonacci framework, which answers the single most specific question in the entire piece: where, precisely, does this asset currently sit within its own structural cycle. Alternative scenarios then stress-test that structural read against the possibility of being wrong. Trade planning converts the surviving thesis into a concrete, staged action plan, and risk assessment tells the reader how much conviction that plan deserves relative to everything else in a portfolio. The conclusion ties all of it back together, and the disclaimer keeps the boundary between analysis and advice explicit. Every section builds on the one before it, which is why the order is fixed rather than stylistic.
Section 1: Fundamentals, the “Why”
The fundamentals section exists to answer one question directly: is this asset’s price action currently happening in a supportive financial environment or a hostile one. Rather than opening with company history or narrative color, EllTec leads with concrete valuation and financial ratios, each followed by a plain evaluative read, because ratios are comparable, sourceable, and falsifiable in a way that narrative is not.
Price-to-Earnings (P/E) and forward P/E
The P/E ratio divides price by earnings per share and shows how many years of current profit it would take, at the present rate, to earn back the purchase price. It works best for mature, consistently profitable businesses and becomes unreliable when earnings are negative, near zero, or distorted by one-off items. The forward P/E replaces trailing earnings with consensus estimates for the year ahead, and the relationship between the two numbers is itself informative: a forward multiple meaningfully below the trailing one signals the market is pricing in earnings growth, while the reverse signals an expected slowdown.
Price/Earnings-to-Growth (PEG) ratio
The forward P/E divided by the expected earnings growth rate, the PEG ratio folds growth directly into the valuation multiple rather than treating price and growth as two separate reads. A PEG below 1.0 suggests the multiple is not yet fully pricing in the growth on offer, while a PEG comfortably above 1.0 suggests that growth is already generously reflected in the price, leaving less room for error if growth disappoints.
Price-to-Sales (P/S)
This divides price by revenue per share and becomes the more useful valuation anchor whenever earnings are negative, break-even, or unusually volatile, which is common in early-growth companies and in cyclical businesses caught in a trough. Its limitation is that it says nothing about whether that revenue is actually profitable.
Price-to-Book (P/B)
Price divided by book value per share. This ratio carries real weight for asset-heavy sectors such as banks, insurers, and industrials, where the balance sheet closely approximates economic value, and carries much less weight for asset-light, intangible-driven businesses such as software or branded consumer companies, where book value systematically understates the true economic worth of the business.
EV/EBITDA
Enterprise value (market capitalization plus debt, minus cash) divided by earnings before interest, tax, depreciation, and amortization. Because it is neutral to capital structure, it allows a fair comparison between companies that carry very different levels of debt, and it is the standard multiple used in cross-border and M&A comparisons for exactly that reason.
Debt/Equity
Total liabilities divided by shareholder equity, a direct measure of financial leverage. A high ratio means the business relies heavily on borrowed capital, which amplifies both the upside and the downside, and becomes a more urgent concern in a rising-rate or tightening-liquidity environment than in an easy one.
Current ratio
Current assets divided by current liabilities, a straightforward liquidity check on whether a company can meet its near-term obligations without raising new capital or selling long-term assets. A ratio comfortably above one suggests short-term solvency is not a live concern; a ratio below one warrants a closer look at the components before drawing conclusions.
ROE, ROA, and ROIC
Return on Equity divides net income by shareholder equity and measures how efficiently shareholder capital is converted into profit, though it must always be read alongside leverage, since debt alone can inflate it. Return on Assets divides net income by total assets and strips out that leverage distortion, giving a cleaner read on how efficiently the underlying asset base generates profit. Return on Invested Capital divides after-tax operating profit by total invested capital (debt plus equity) and is arguably the single most important profitability metric for long-term compounding, because a business earning consistently more on its invested capital than that capital costs is the clearest quantitative signature of a durable competitive advantage.
Margins: gross, operating, and net
Gross margin reflects pricing power and cost efficiency at the most basic level. Operating margin folds in operating expenses and is often the cleanest single read on managerial execution. Net margin folds in interest, tax, and one-off items, and reflects what actually reaches shareholders per dollar of revenue. The direction of these margins over time matters more than their absolute level: expanding margins typically signal an improving competitive position or growing operating leverage, while contracting margins are frequently an early warning sign that precedes a valuation reset by several quarters.
Consensus growth estimates and forward multiples
Analyst consensus for revenue and EPS growth, expressed as a year-over-year percentage, translates the current valuation into a forward-looking picture. A demanding multiple can still represent good value if consensus growth is strong enough for the business to grow into that multiple within a year or two, whereas the identical multiple against decelerating growth estimates is a warning sign rather than a comfort.
Section 2: Correlations, the “Context”

No asset trades in true isolation. A meaningful share of an asset’s day-to-day and week-to-week variance is explained by its relationship to broader macro factors rather than by its own idiosyncratic news flow, and the correlations section exists to quantify those relationships so the technical picture that follows can be read against the right backdrop.
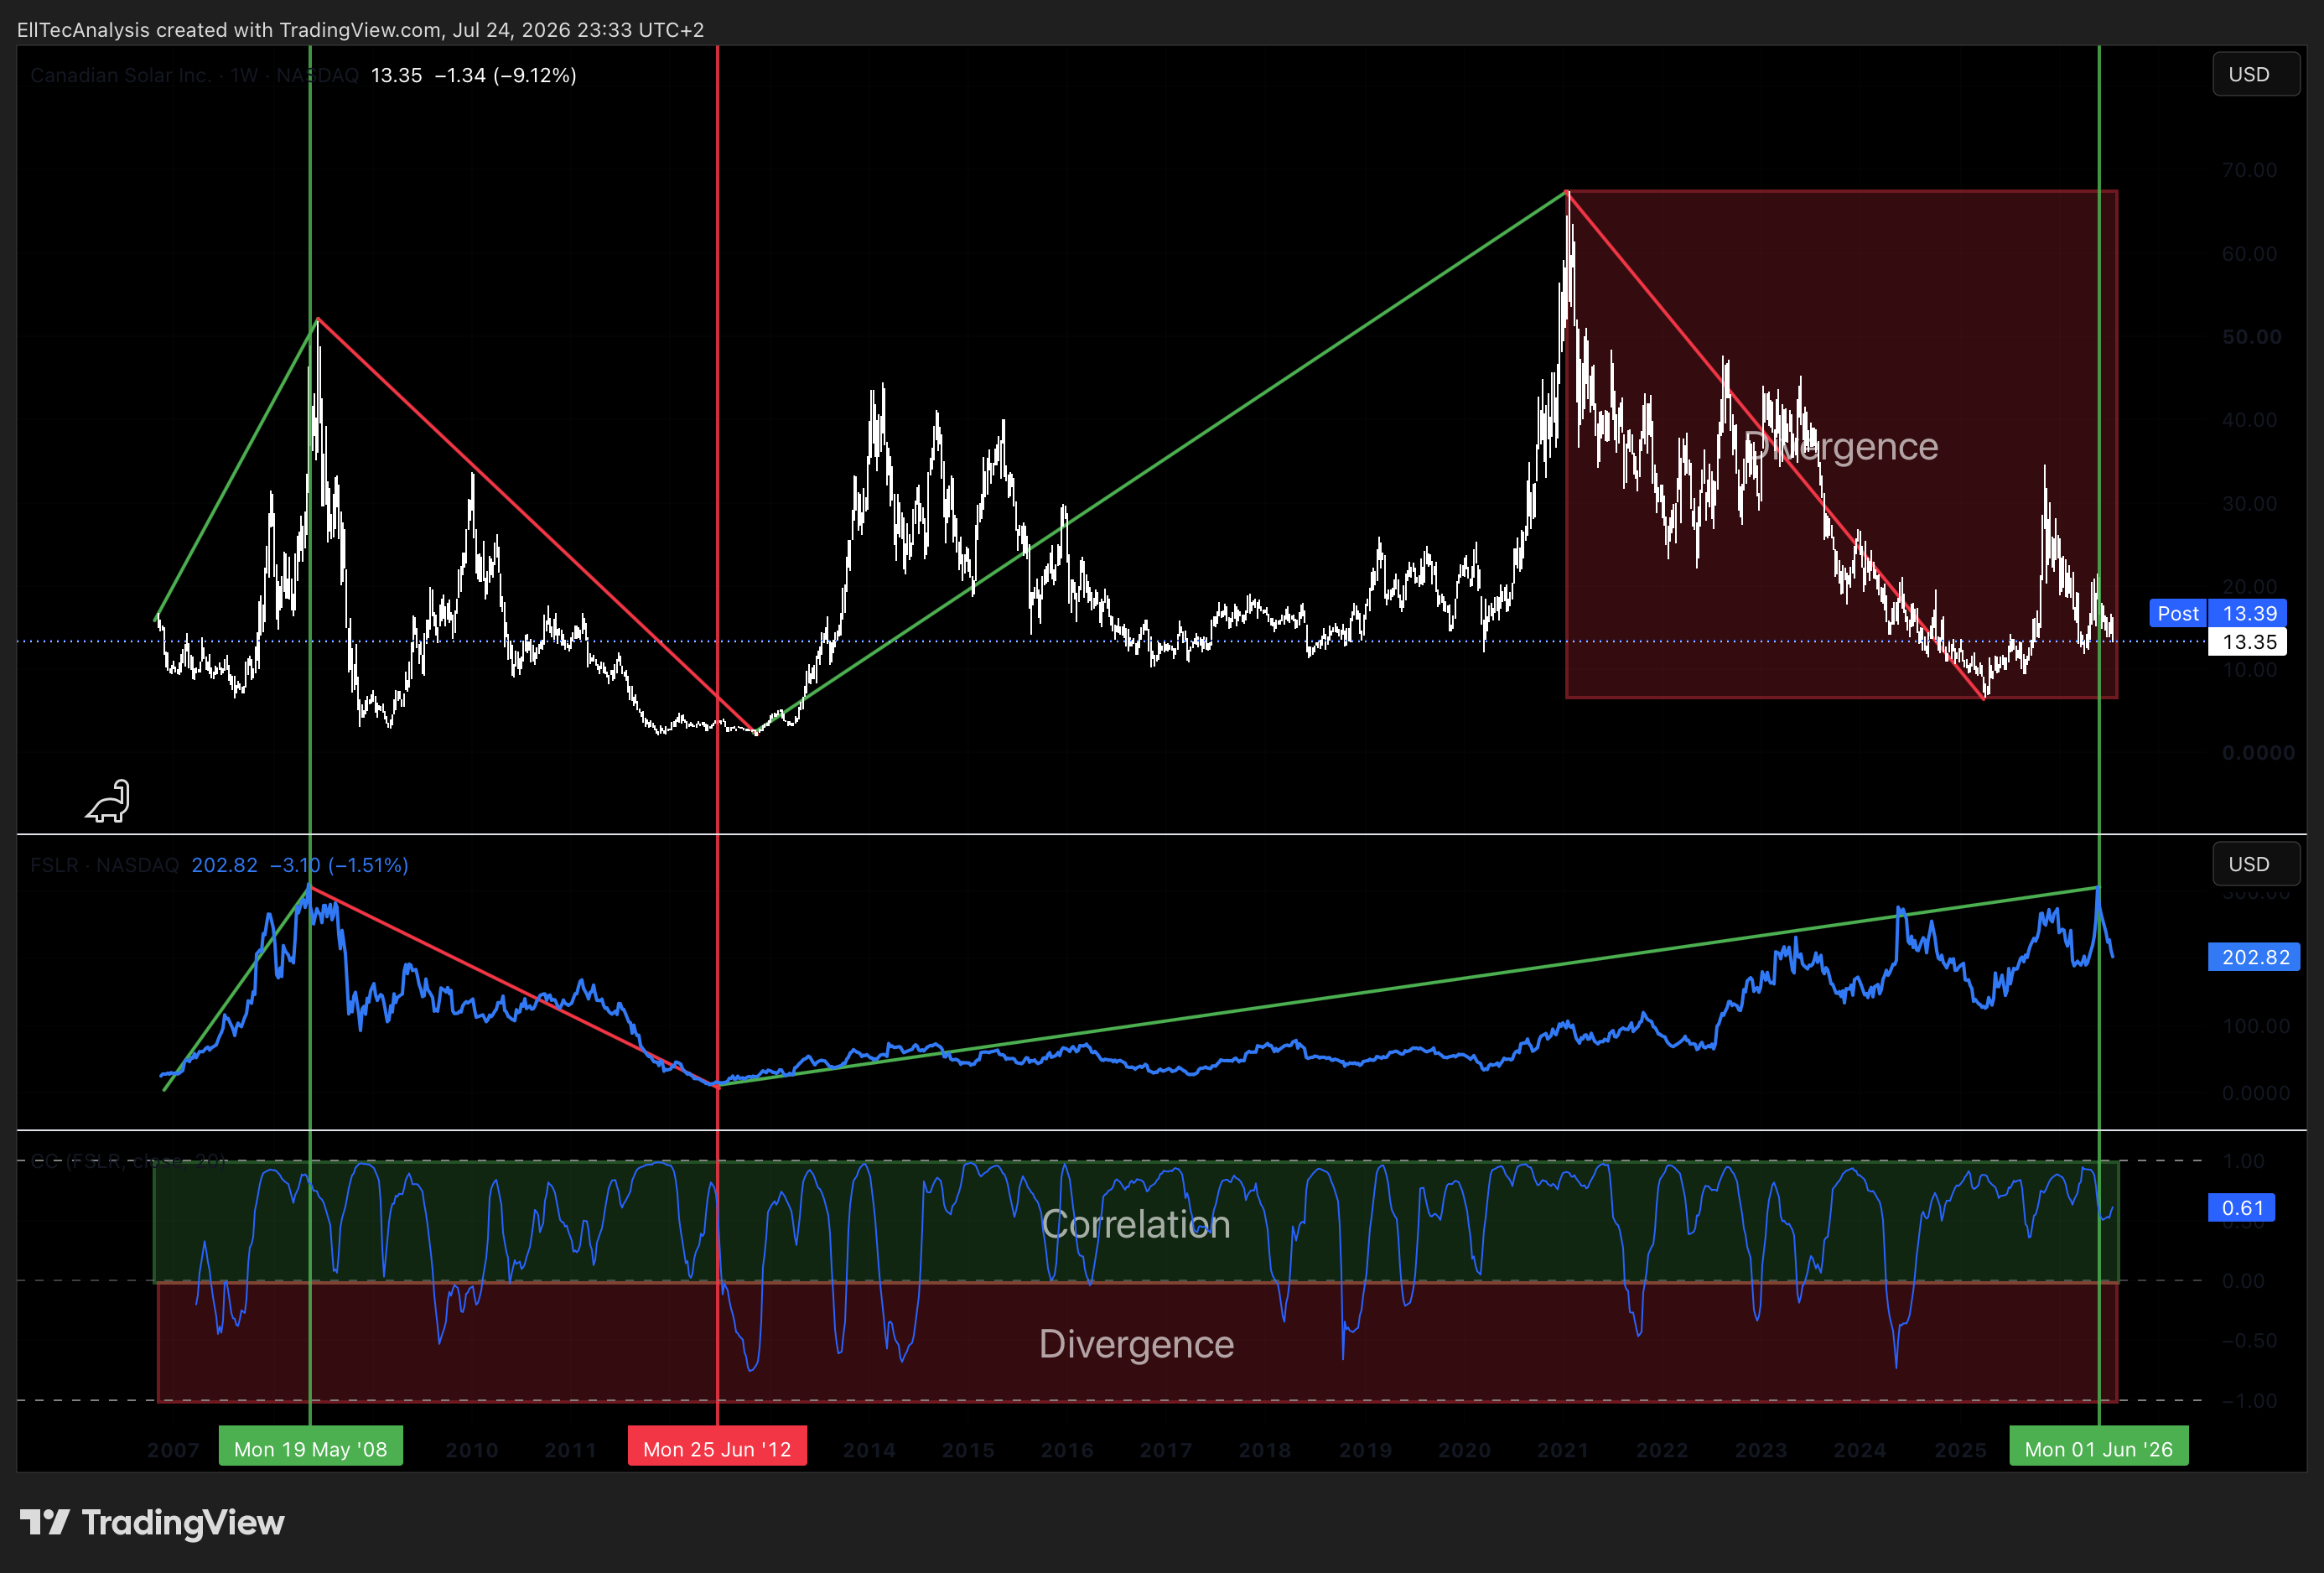
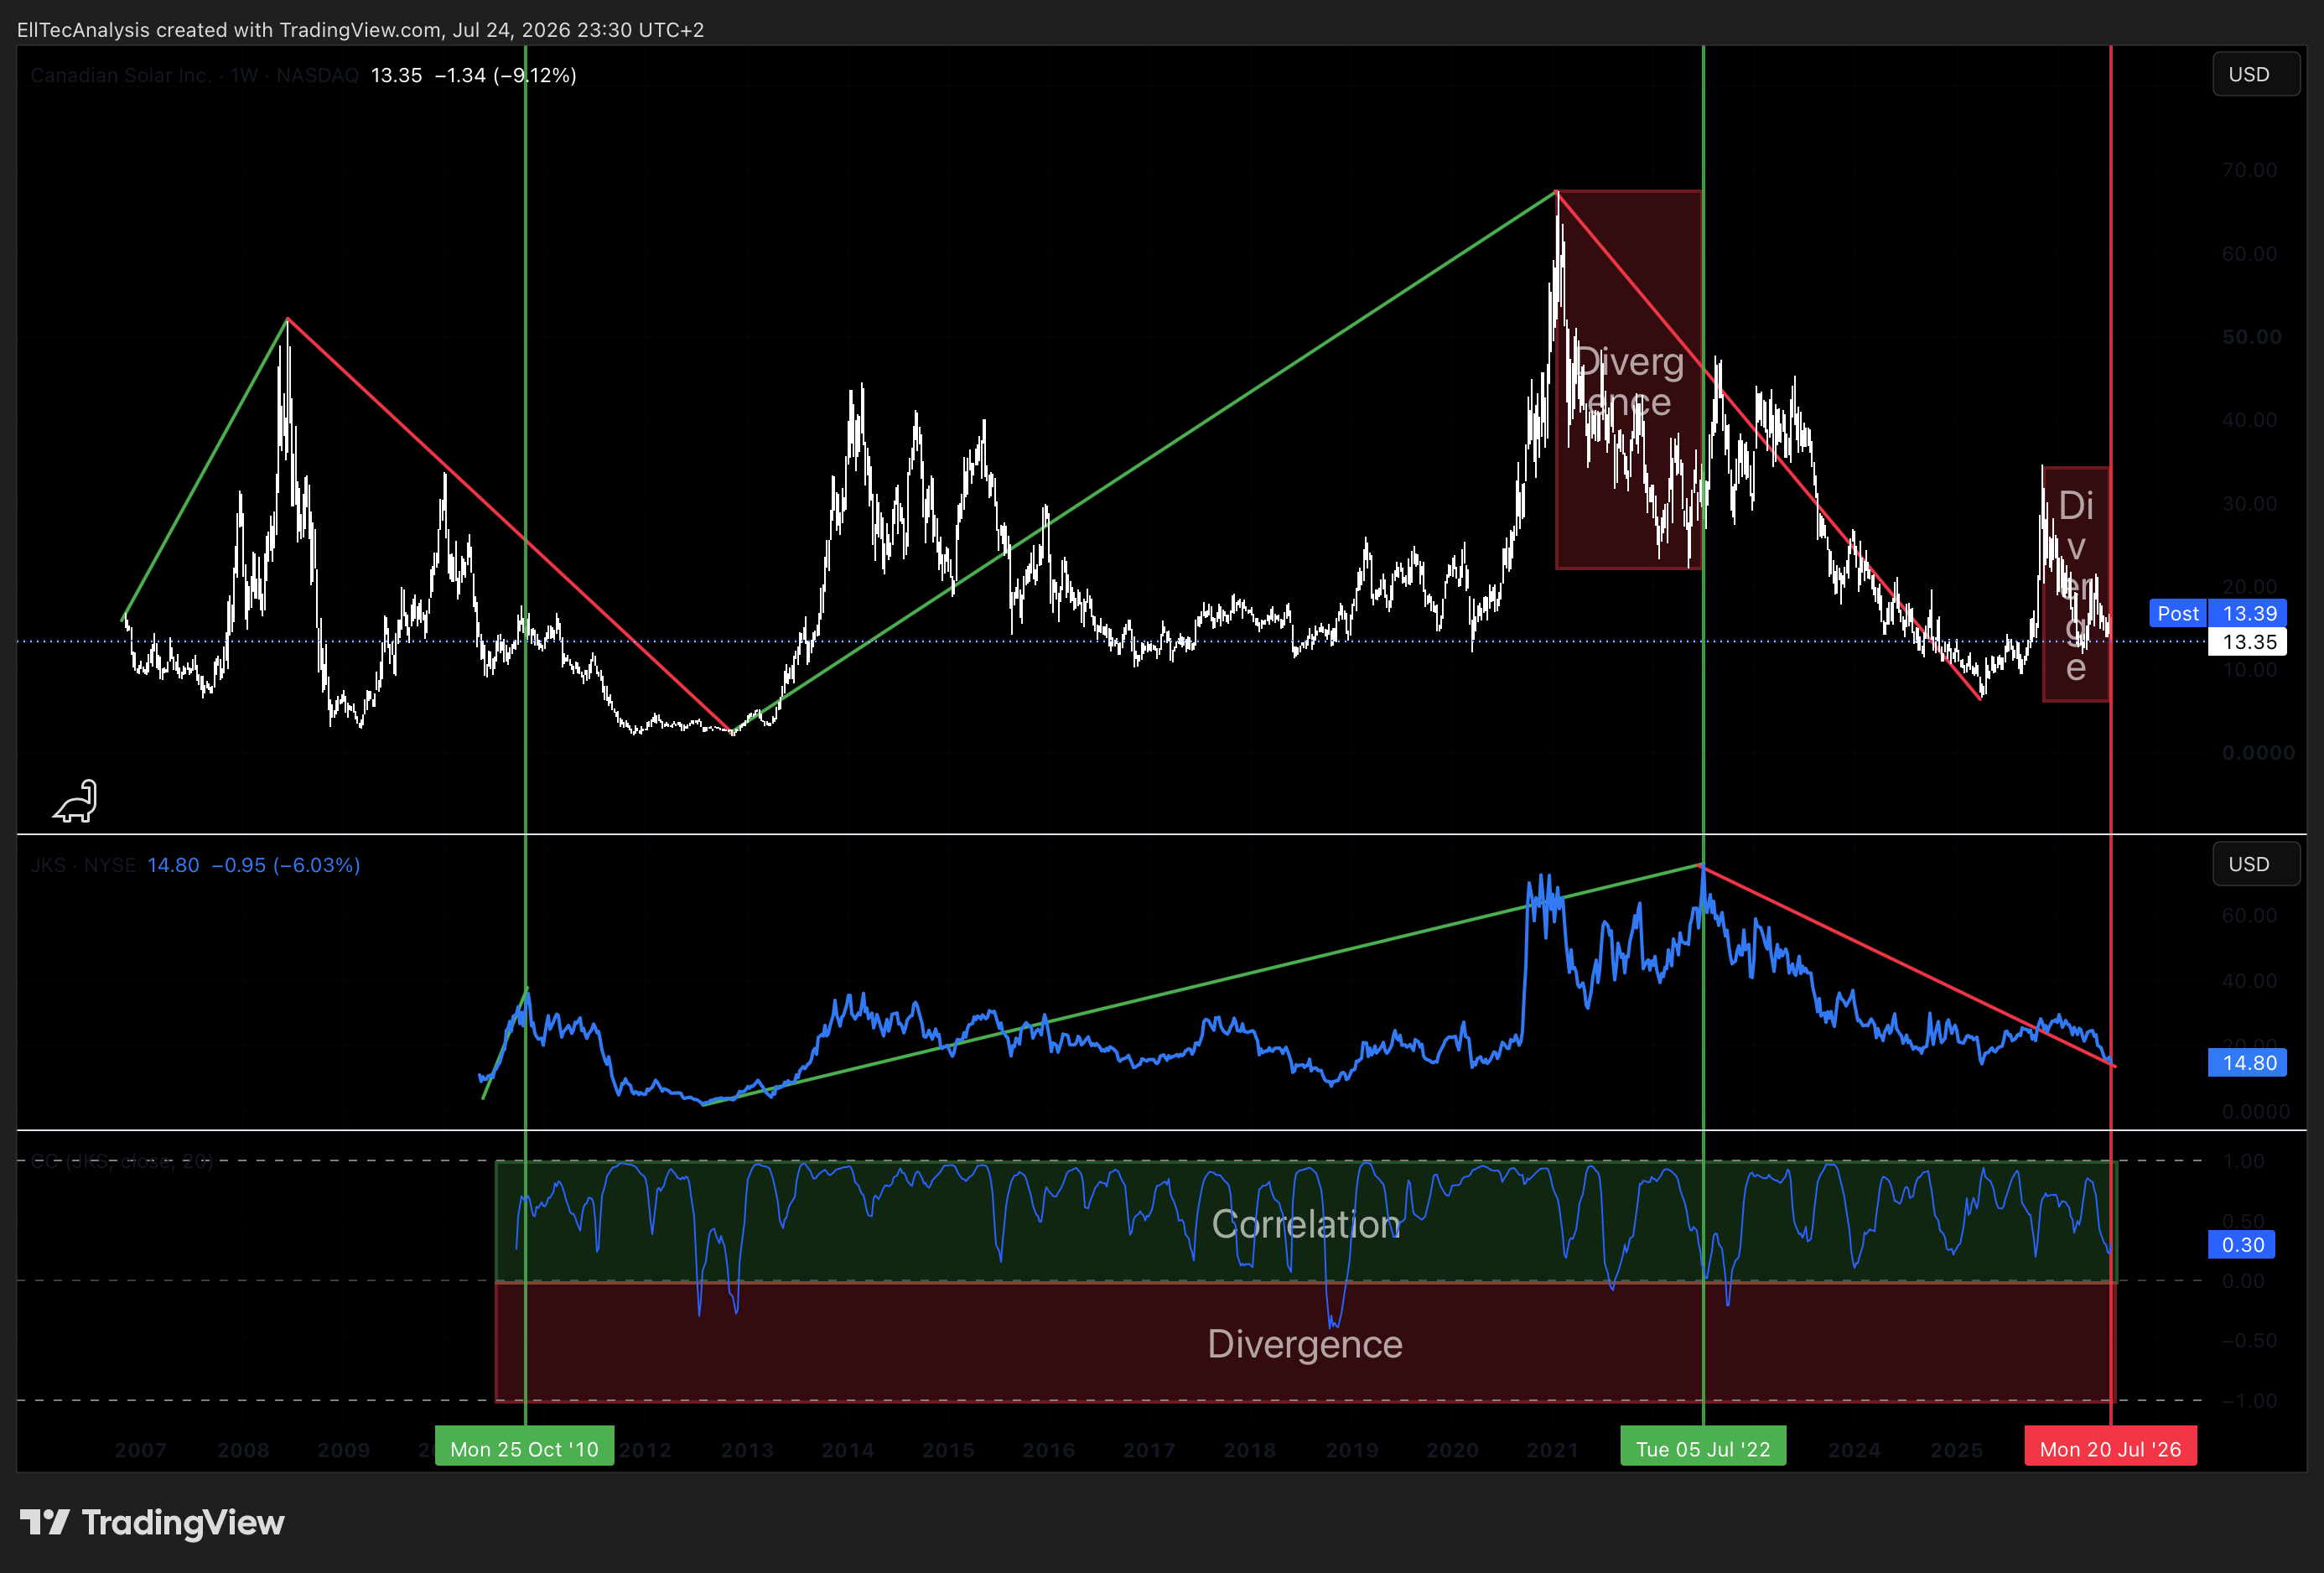
A correlation coefficient runs from minus one, meaning perfectly inverse, through zero, meaning no linear relationship, to plus one, meaning perfectly aligned. EllTec calculates these on a rolling basis rather than as a single fixed number, because correlation regimes shift over time: an asset can move in lockstep with a given factor for months and then decouple entirely once the underlying macro driver changes. A rolling window lets a reader see not only the direction of a relationship but its current strength and how stable that strength has been recently.
The correlation families that appear most often are risk sentiment, capturing whether the asset behaves as a growth-sensitive instrument that rises with broad optimism and falling volatility, or as a defensive one that benefits when sentiment sours; the US Dollar Index, since many assets, particularly commodities and emerging-market instruments, carry a structural inverse relationship to the dollar because a stronger dollar tightens global financial conditions; the relevant commodity complex or sector-specific input, which transmits directly into margins for the businesses that depend on it; and, less directly but often as an earlier warning, credit spreads, sovereign risk premia, or sector-specific flow data, which tend to move ahead of broader risk-asset weakness by days or weeks.
The most important use of this section is spotting divergence. When an asset stops behaving the way its usual correlations would predict, that break is frequently one of the earliest tells that a new structural phase, and potentially a new Elliott Wave degree, is beginning.
Section 3: Seasonality, the Cyclical Tilt
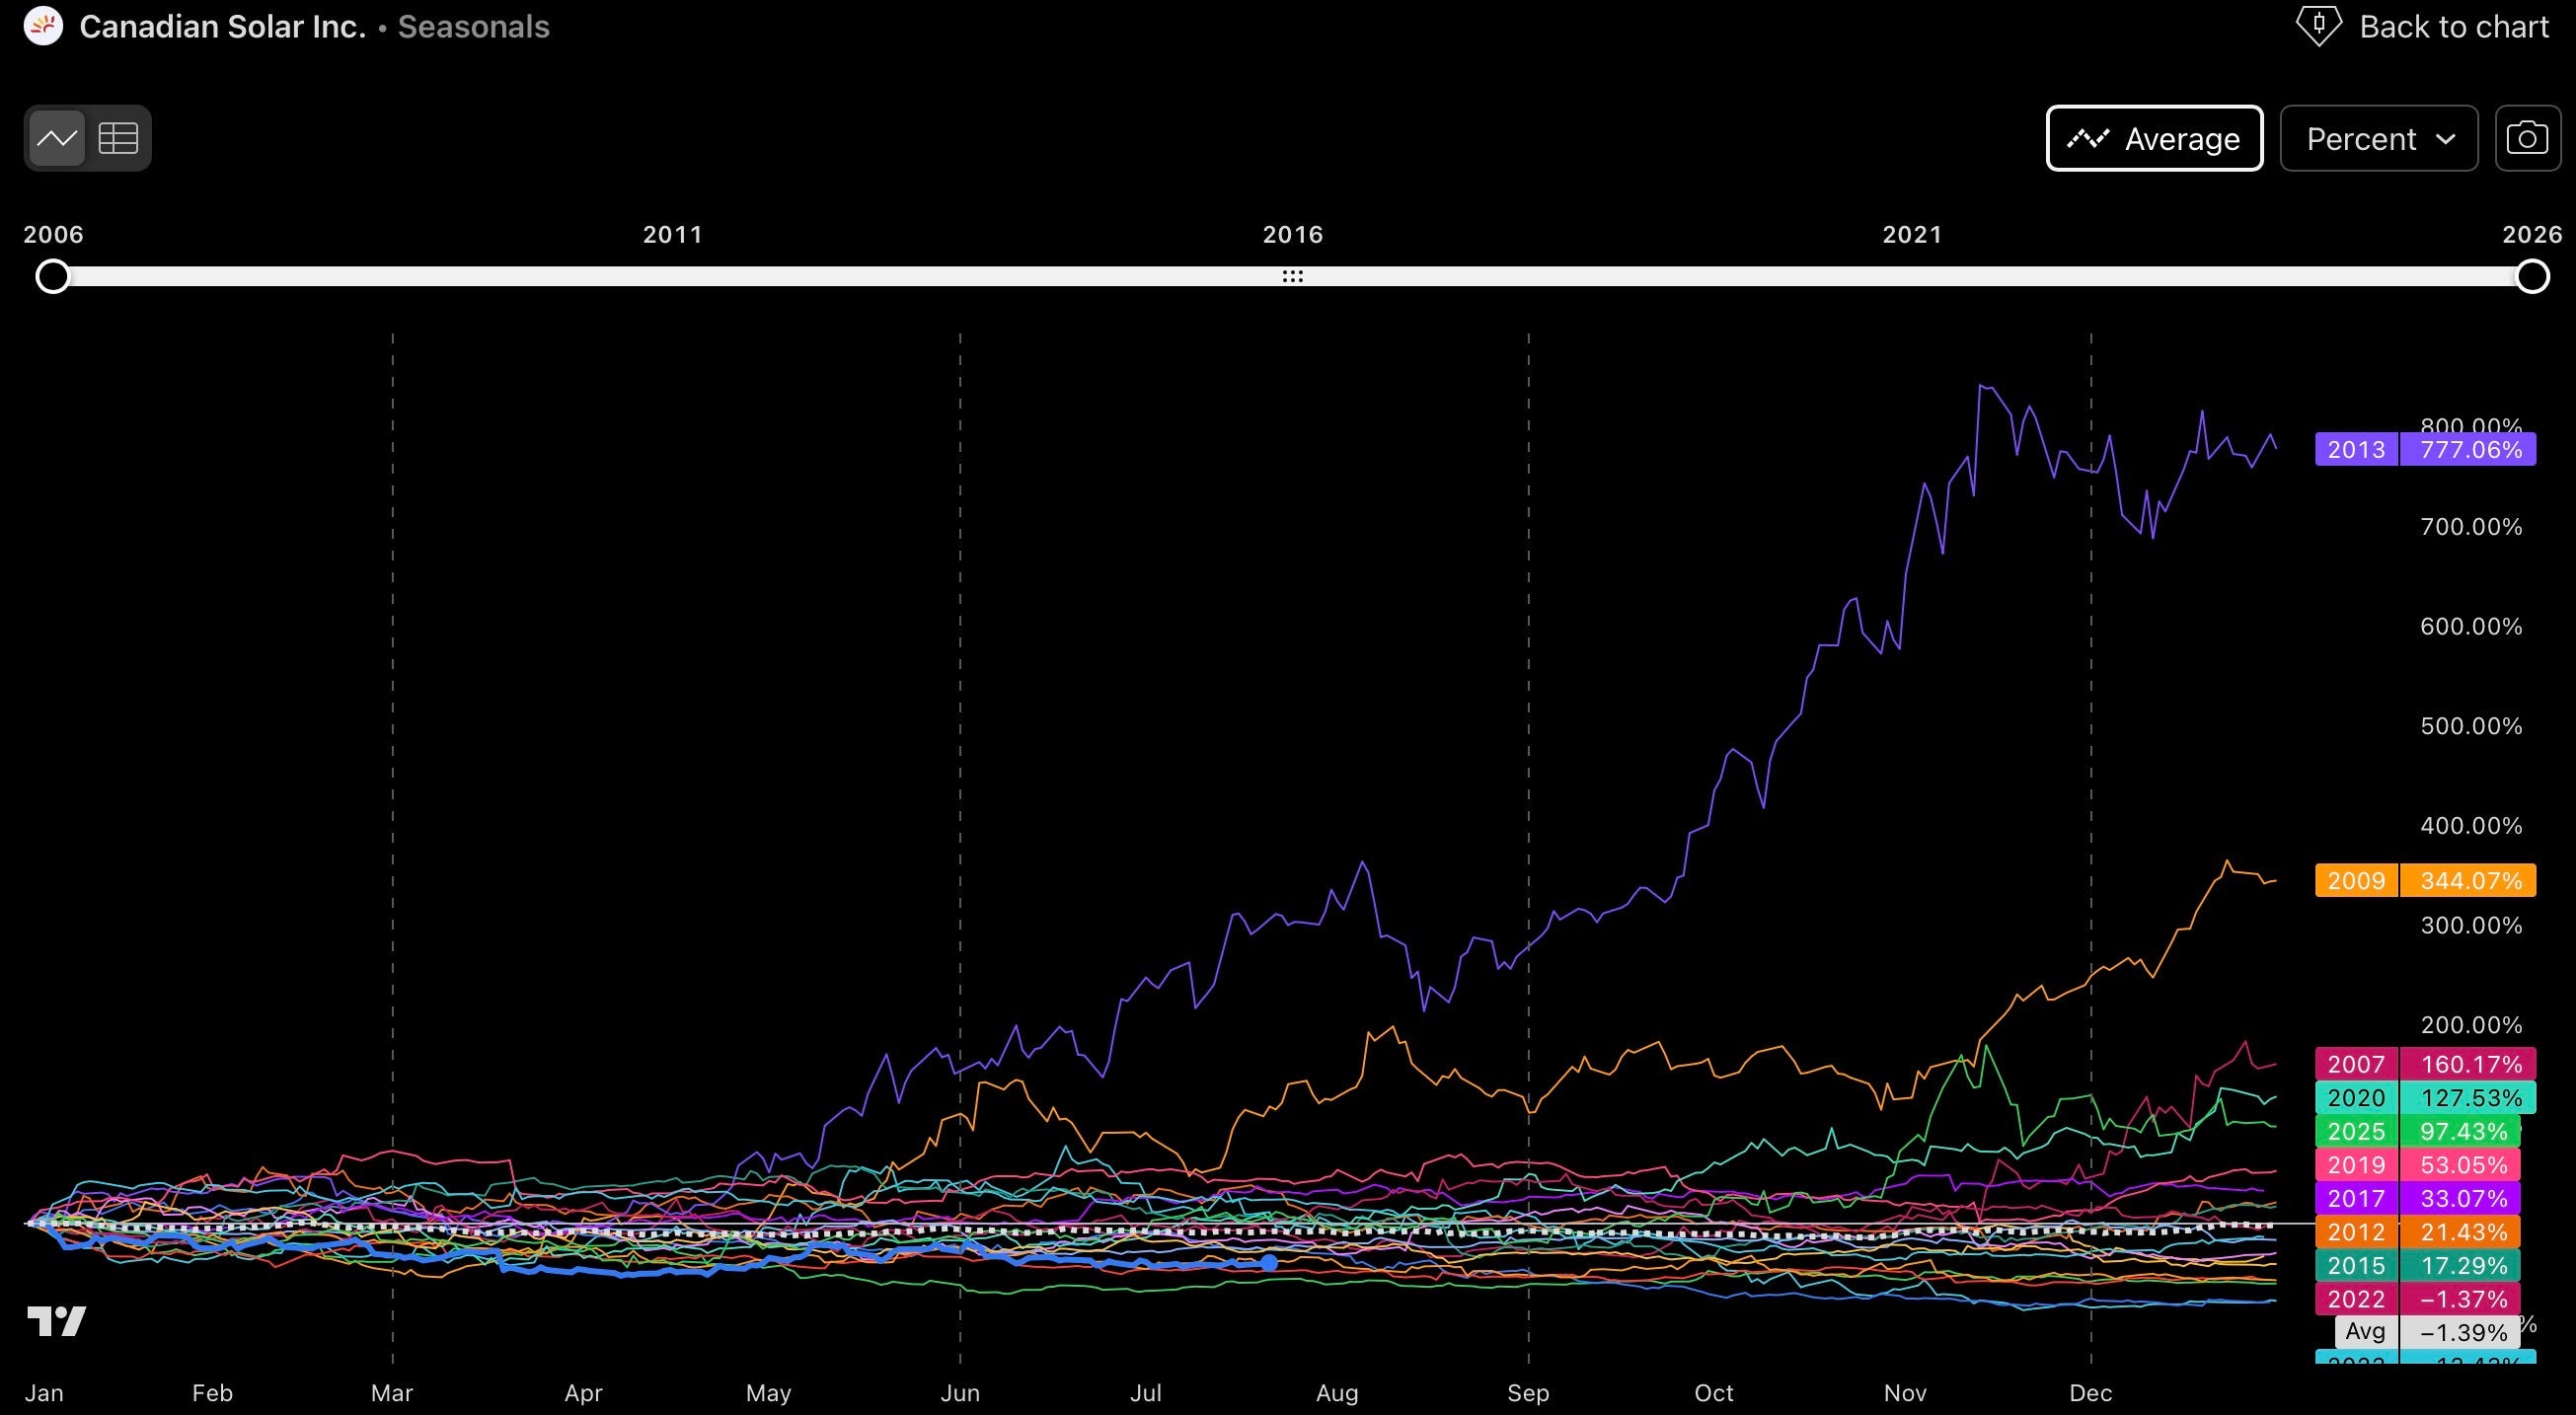
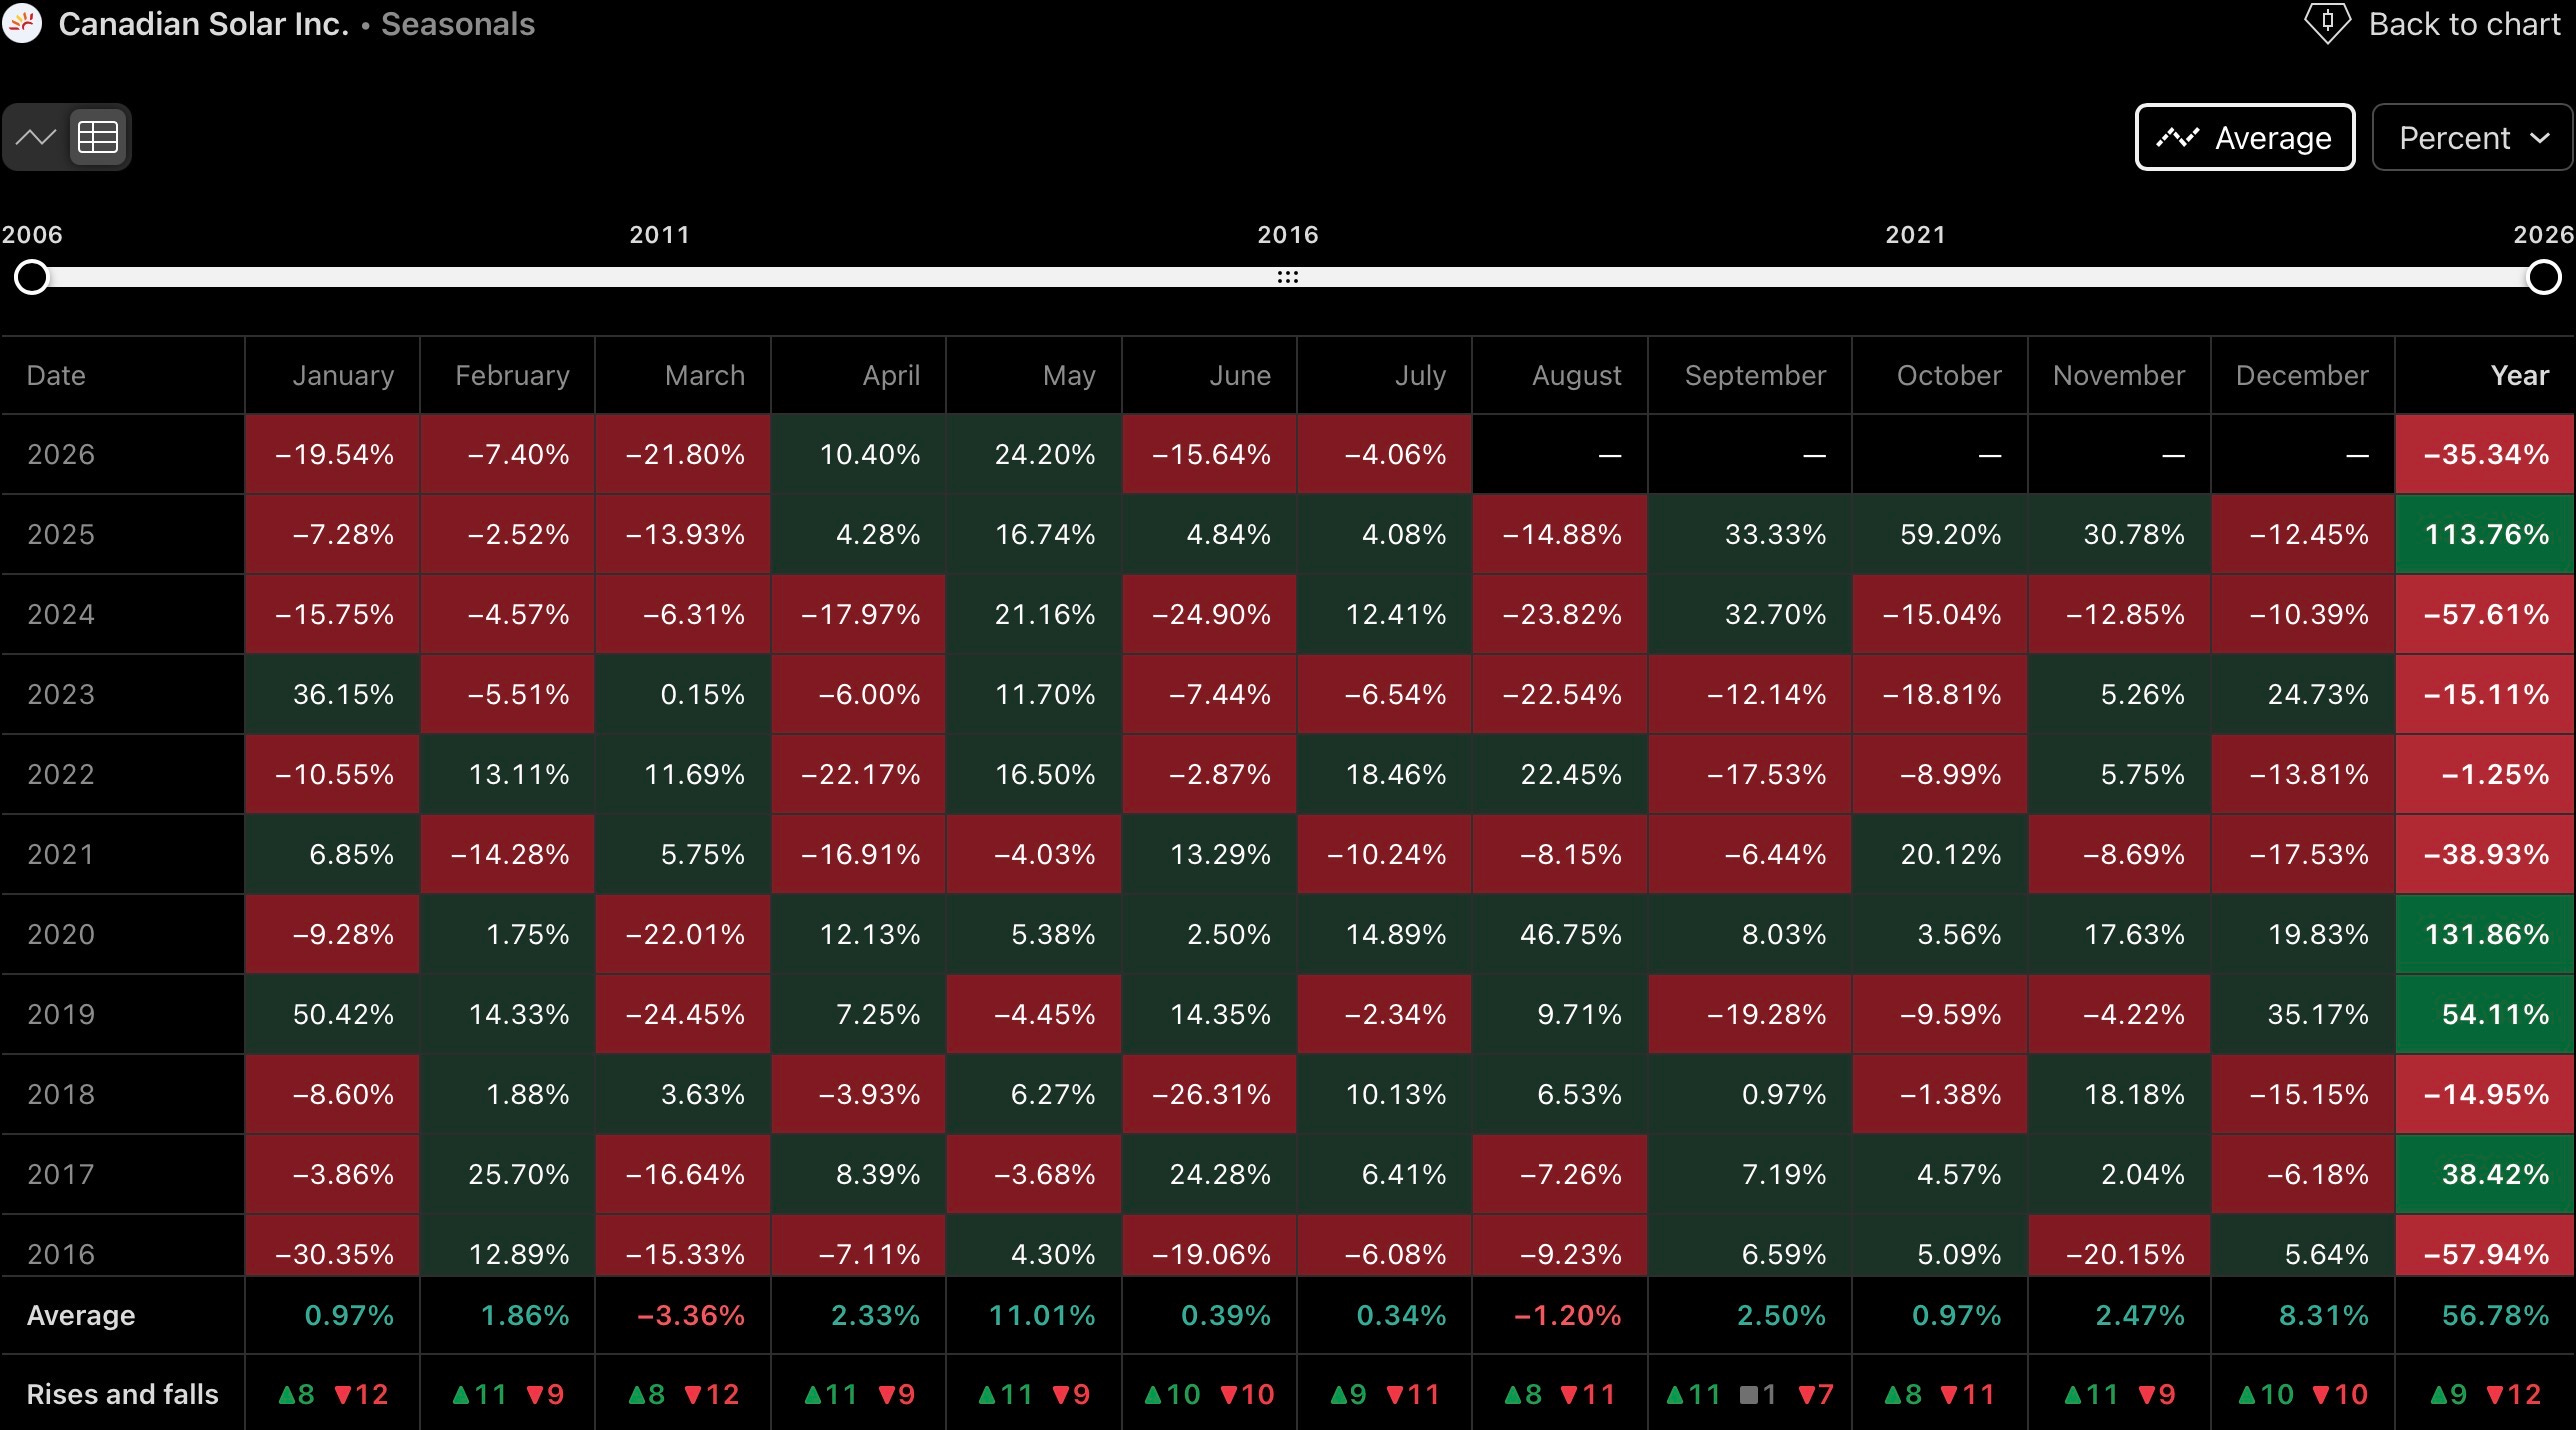
Where a report includes a seasonality read, it is omitted entirely when EllTec Analysis judges the asset does not have a meaningfully reliable pattern, it is derived from that asset’s own historical average performance across a specific calendar window, measured over as many years of data as are available. Seasonality is folded into the broader read as a probabilistic tilt: something that nudges conviction up or down when the fundamental and technical pictures are already pointing in a given direction, rather than a standalone trigger. This distinction matters because sample sizes are inherently limited, a handful of decades at most for most tradable assets, and because macro regimes change enough over time that a pattern which held reliably in one decade can weaken or disappear in the next.
Section 4: Technical Analysis, the “Where”
4.1 ELLIOTT WAVE ANALYSIS
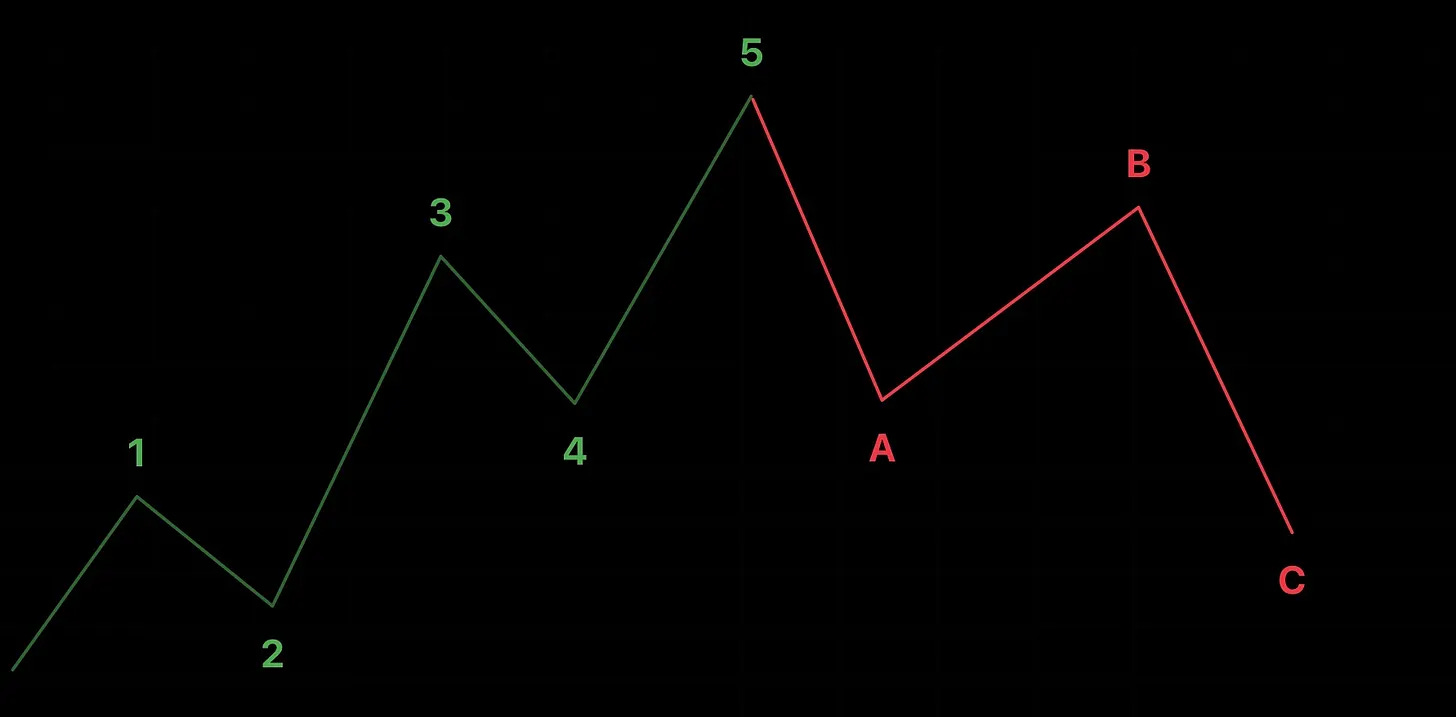
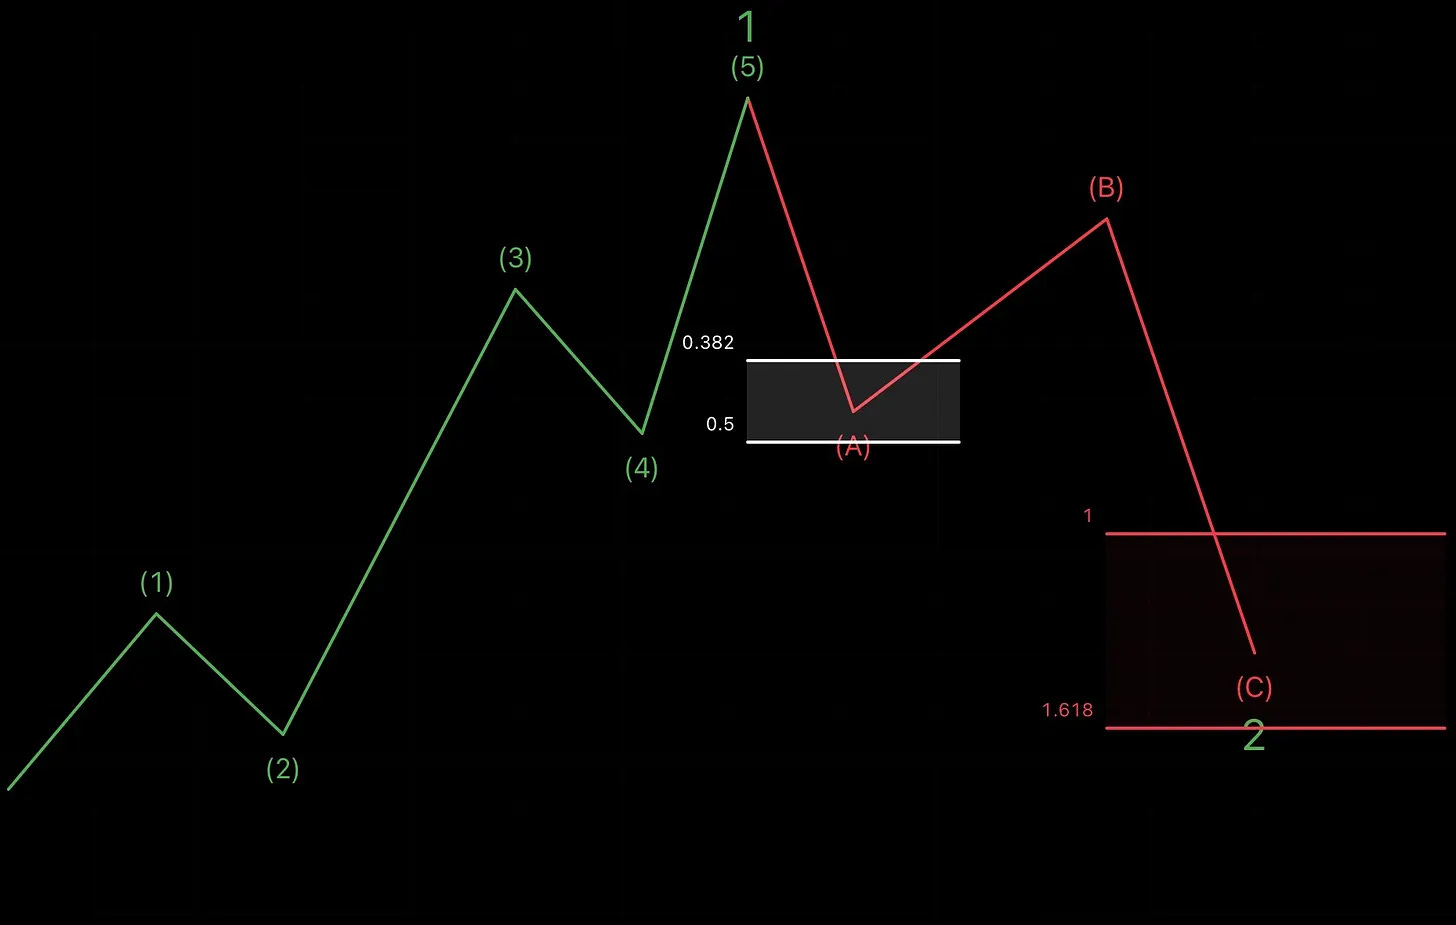
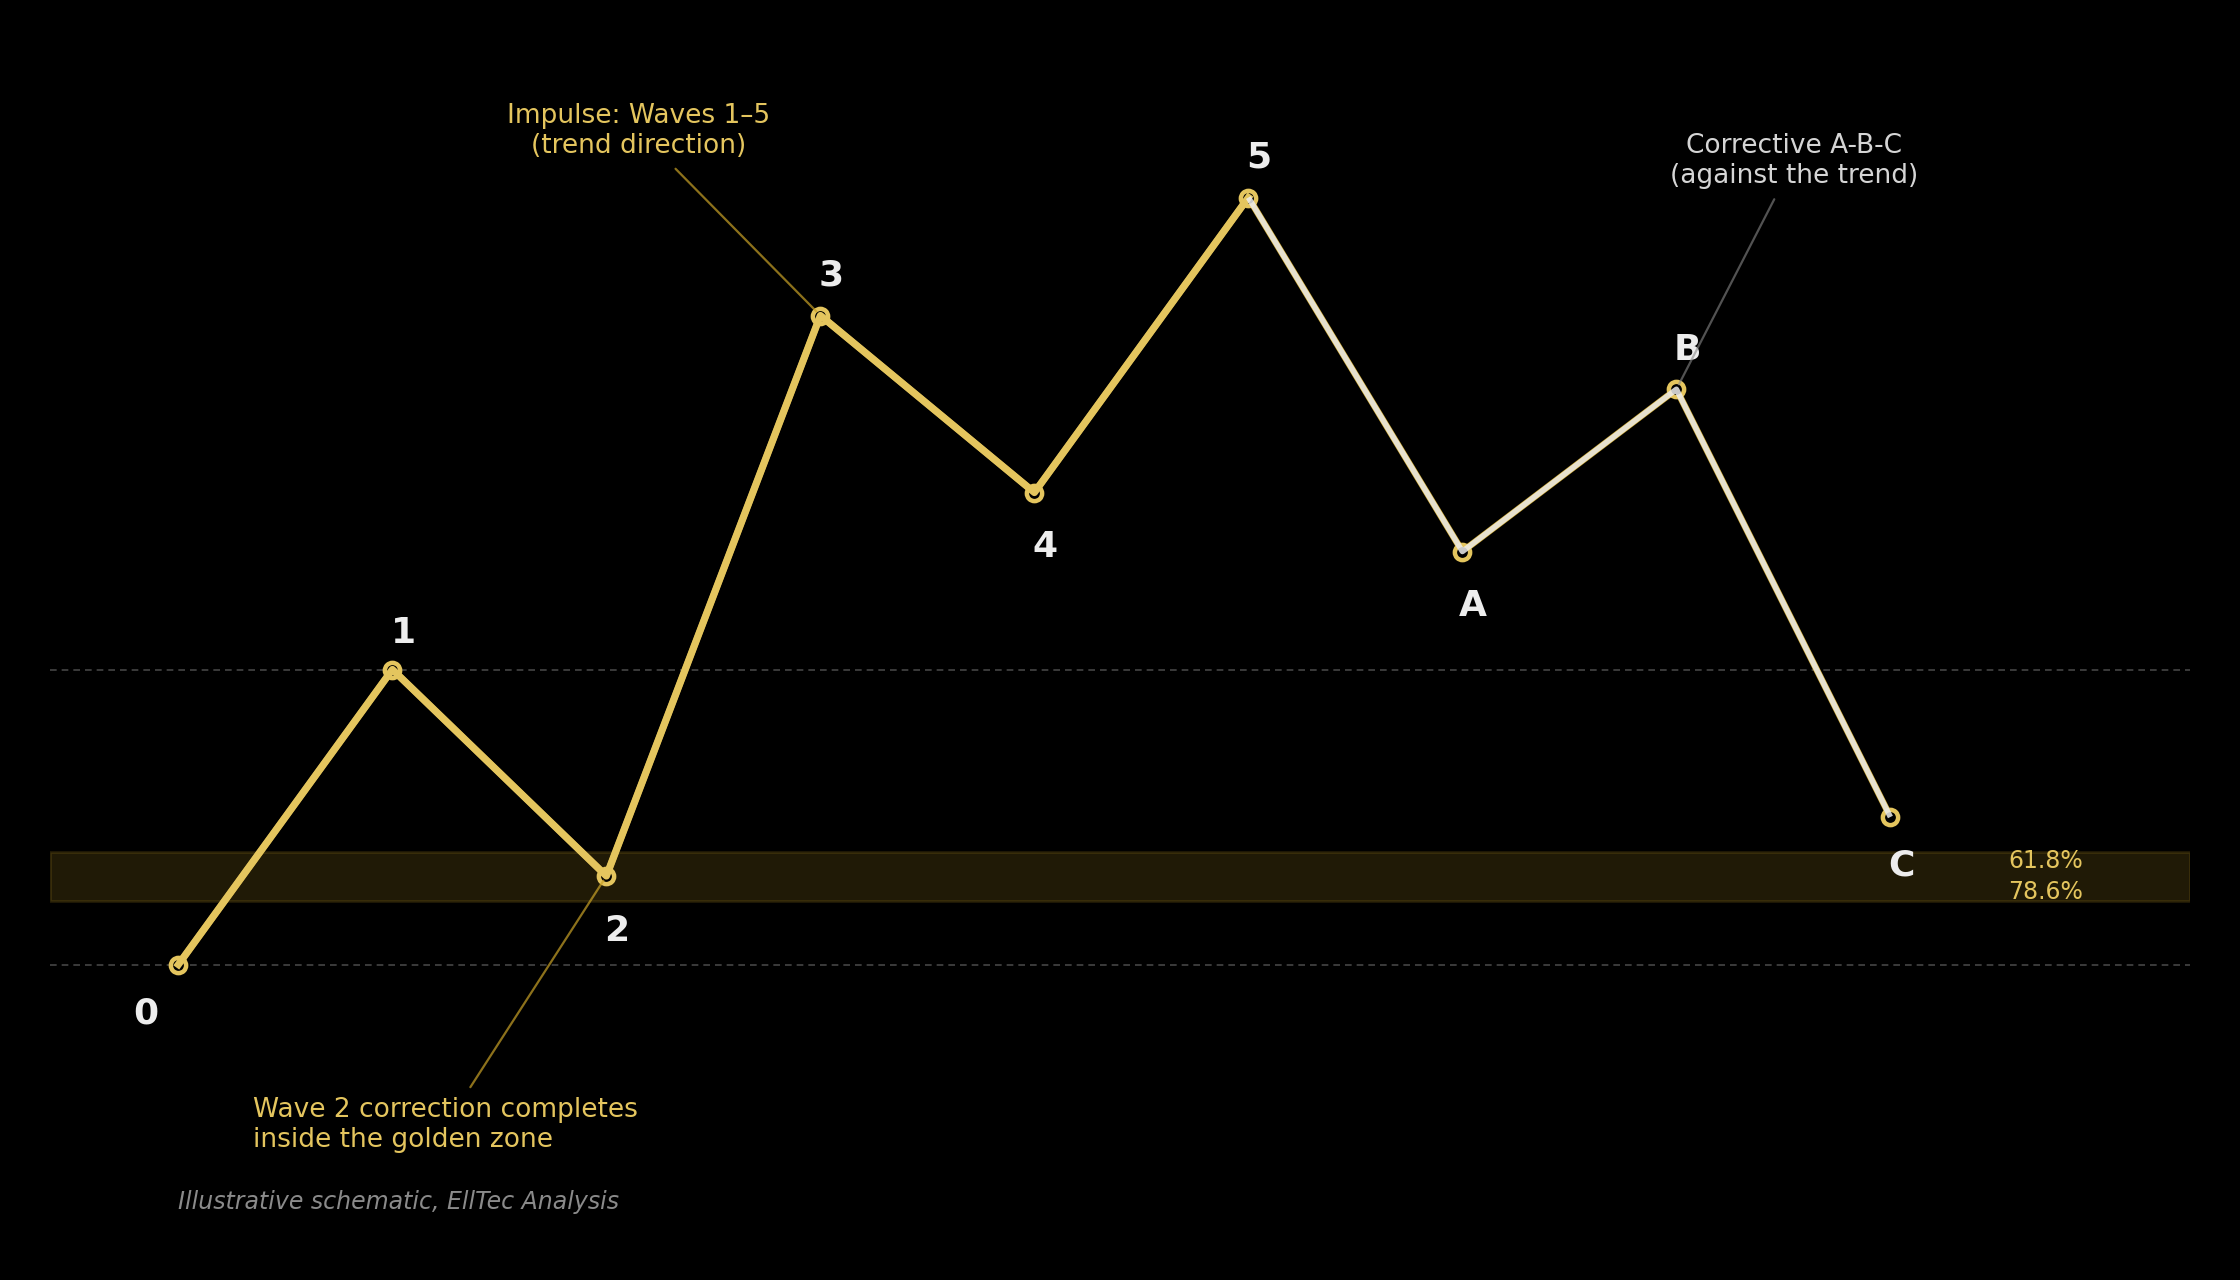
Elliott Wave Theory rests on the observation that collective market psychology, the alternating current of optimism, doubt, and capitulation that drives crowd behavior, tends to unfold in repeatable structural patterns rather than randomly. In the direction of the prevailing larger trend, price tends to move in five waves, labeled 1 through 5. Three of these, waves 1, 3, and 5, move with the trend, and two, waves 2 and 4, move against it as corrective pauses. Once that five-wave impulse completes, price then corrects the entire move in three waves, labeled A, B, and C, or in a more complex combination of such structures, before the next impulse begins.
This pattern is fractal. The same 5-3 structure repeats at every degree, from multi-decade Grand Supercycle waves down to Minuette waves that complete within hours, and each larger wave is itself built from smaller waves following the identical pattern. This is why an EllTec technical section usually shows a higher-degree chart alongside an intermediate and a lower-degree chart: the reader is looking at the same fractal structure at three different levels of magnification, not three unrelated charts.
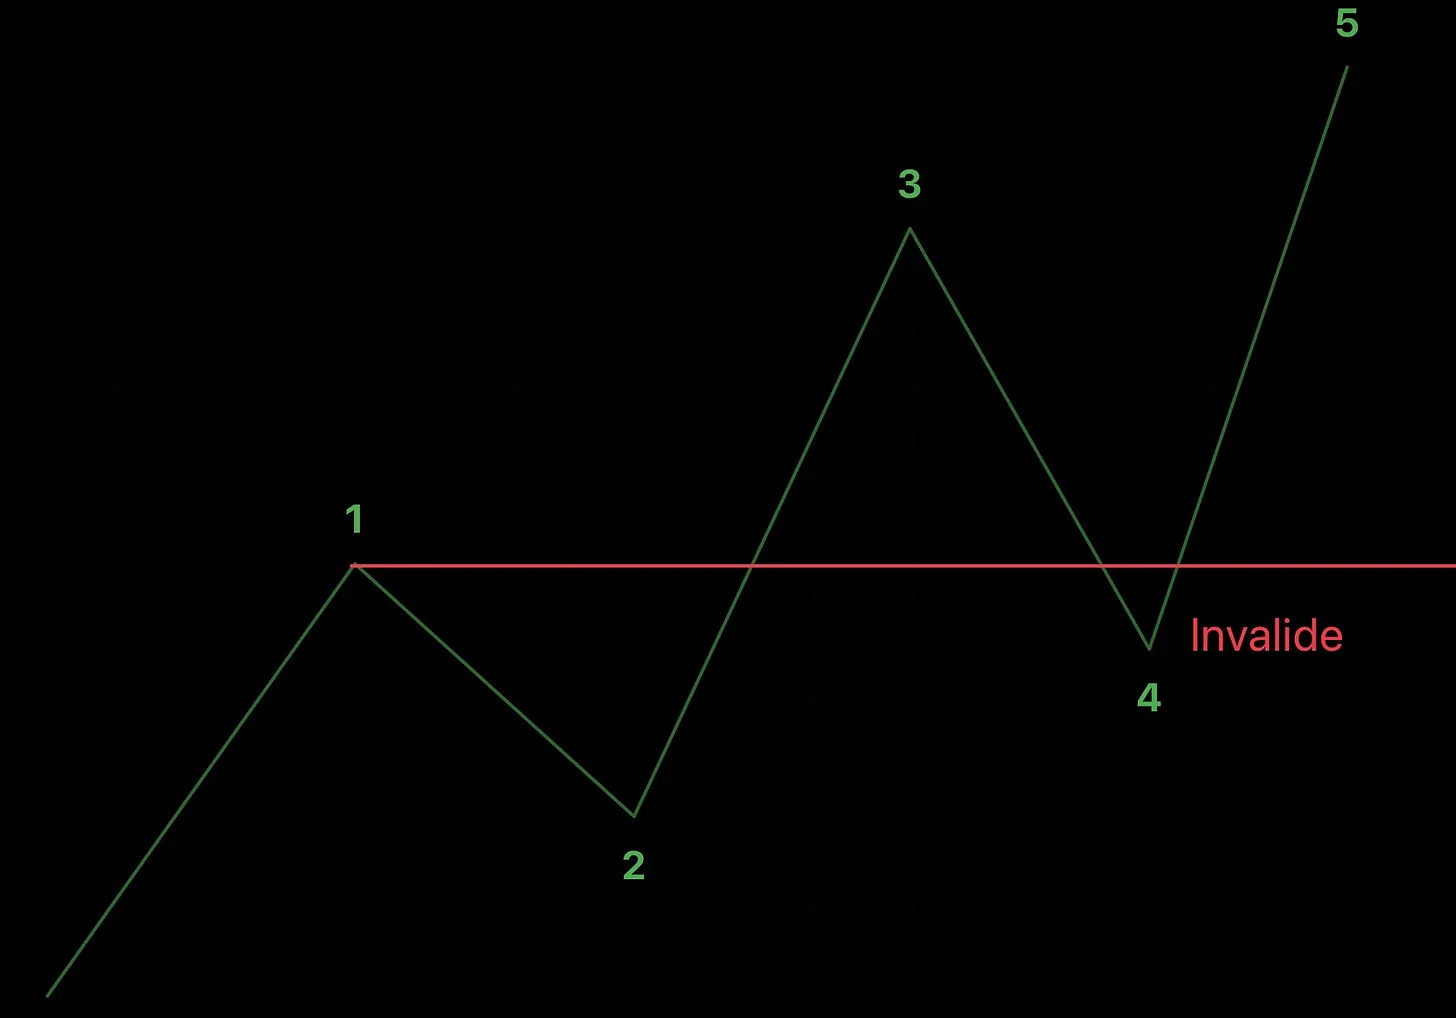
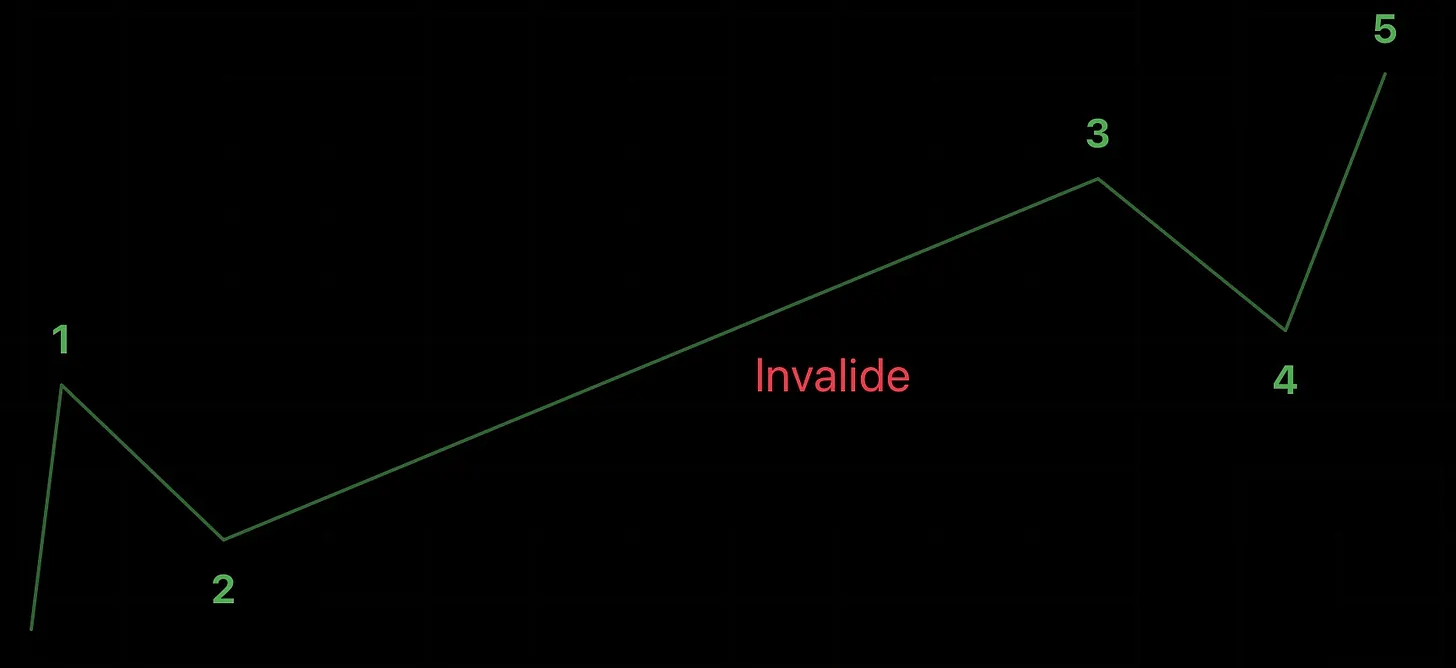
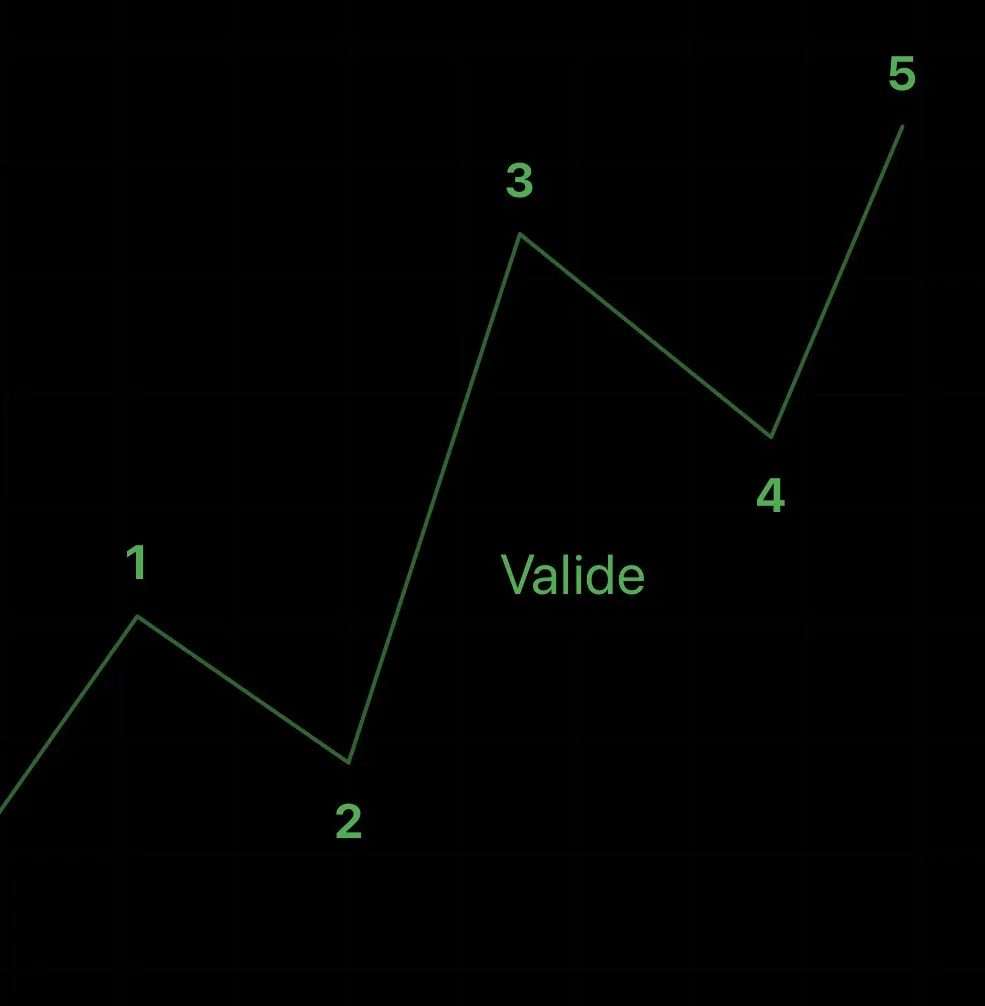
Three rules define whether a wave count is structurally valid at all, rather than simply preferred. Wave 2 can never retrace more than one hundred percent of wave 1, meaning it cannot travel back beyond the point where wave 1 began. Wave 3 can never be the shortest of waves 1, 3, and 5. Wave 4 cannot overlap wave 1’s price territory in a standard impulse, with the single exception of diagonal patterns, a specific impulse variant built for exhaustion phases. Alongside these rules sit two strong tendencies rather than hard laws: alternation, meaning wave 2 and wave 4 tend to take visibly different forms, and equality, meaning wave 5 often approaches the length of wave 1, particularly when wave 3 has already extended strongly.
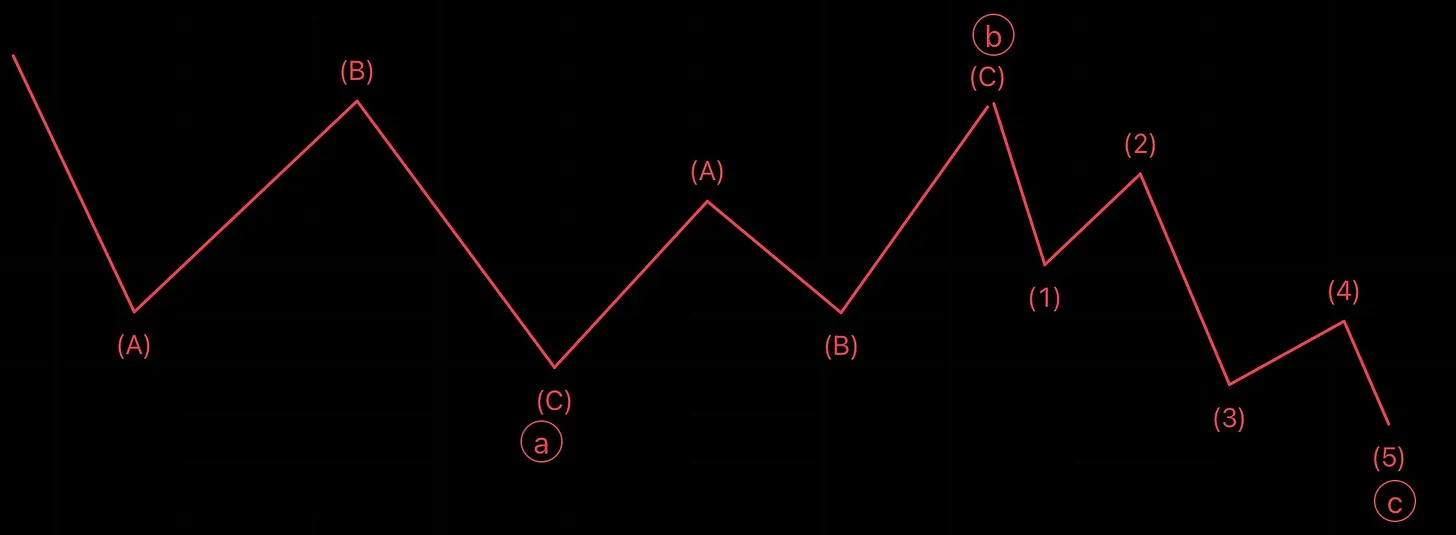
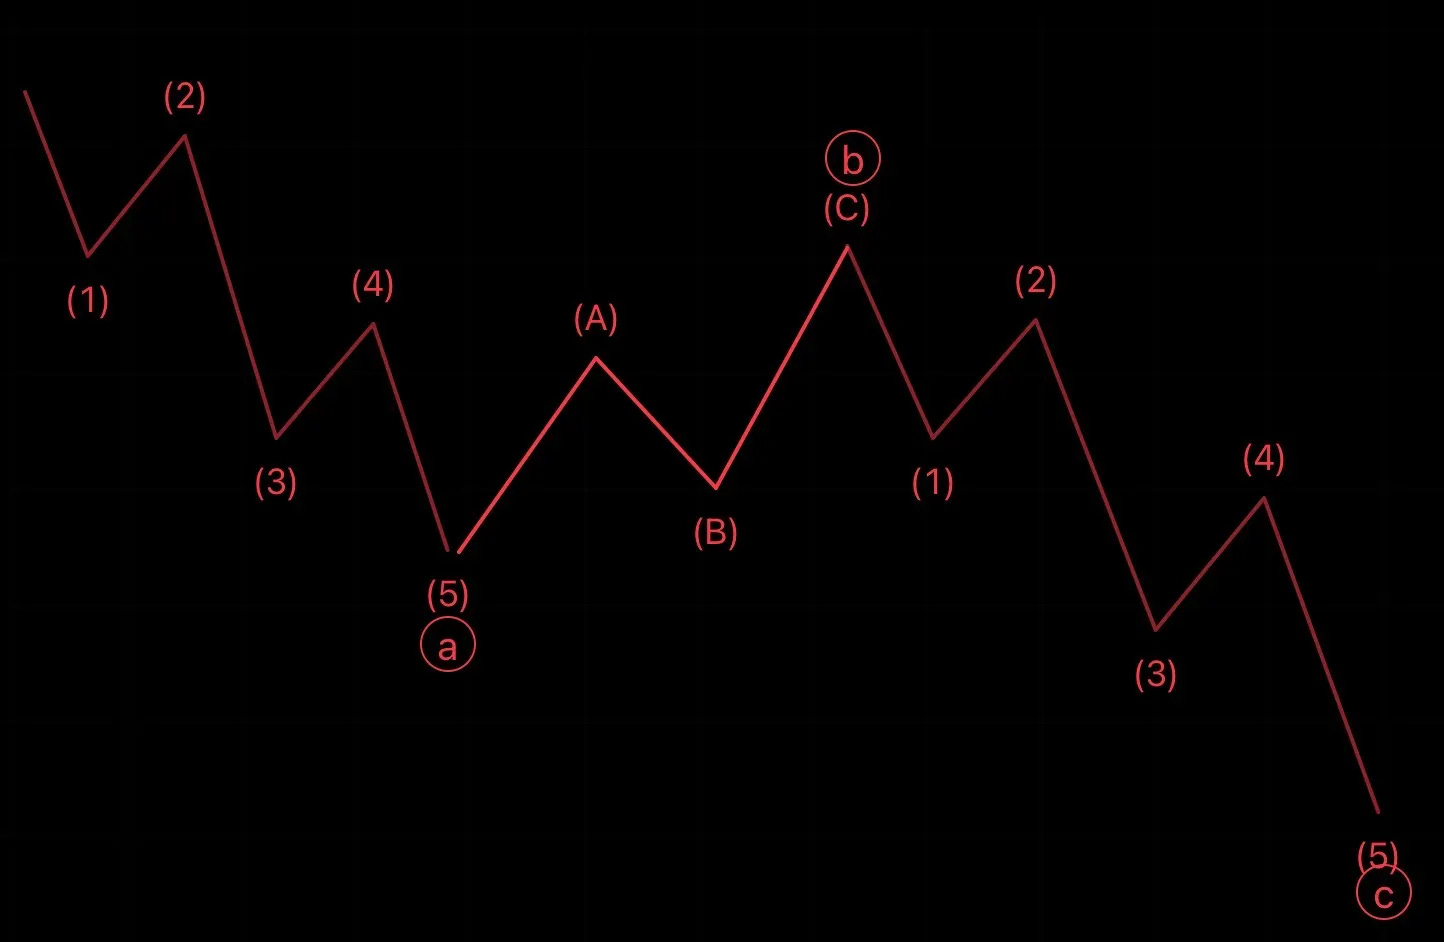
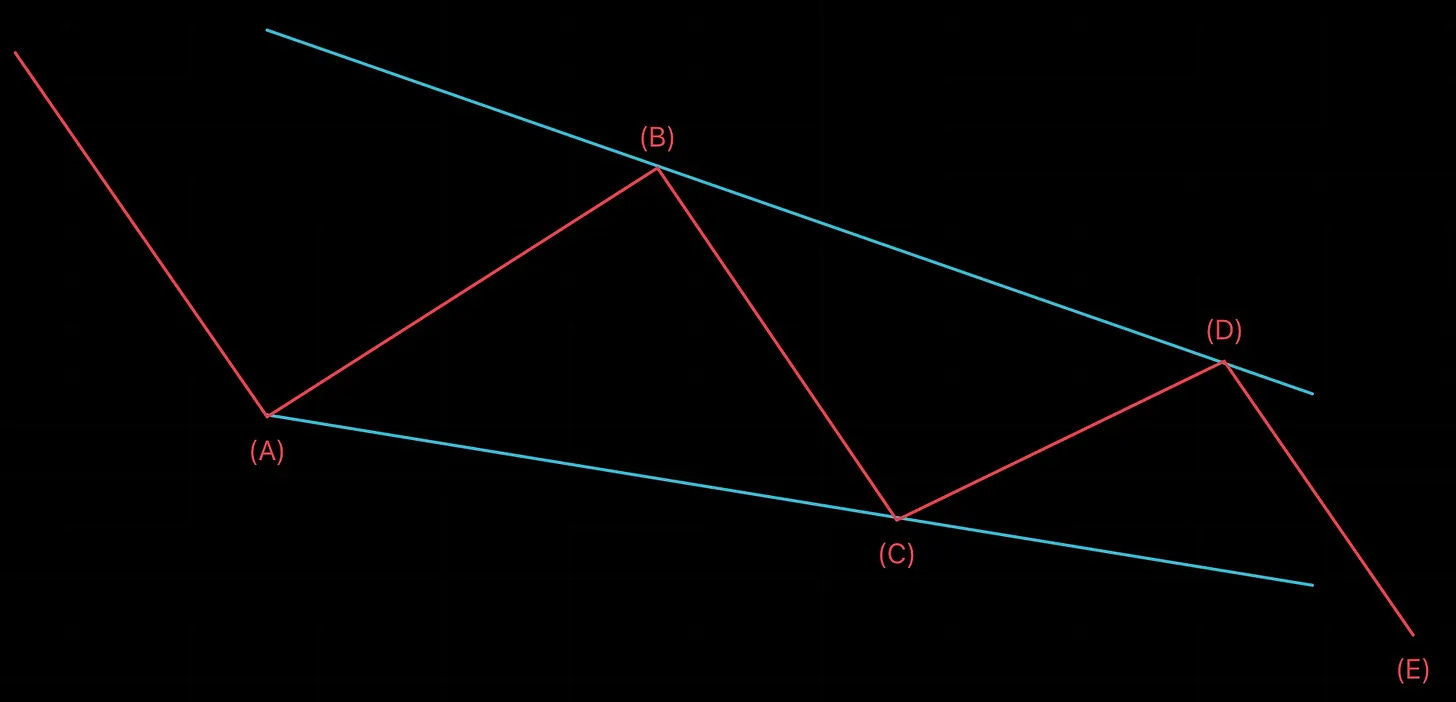
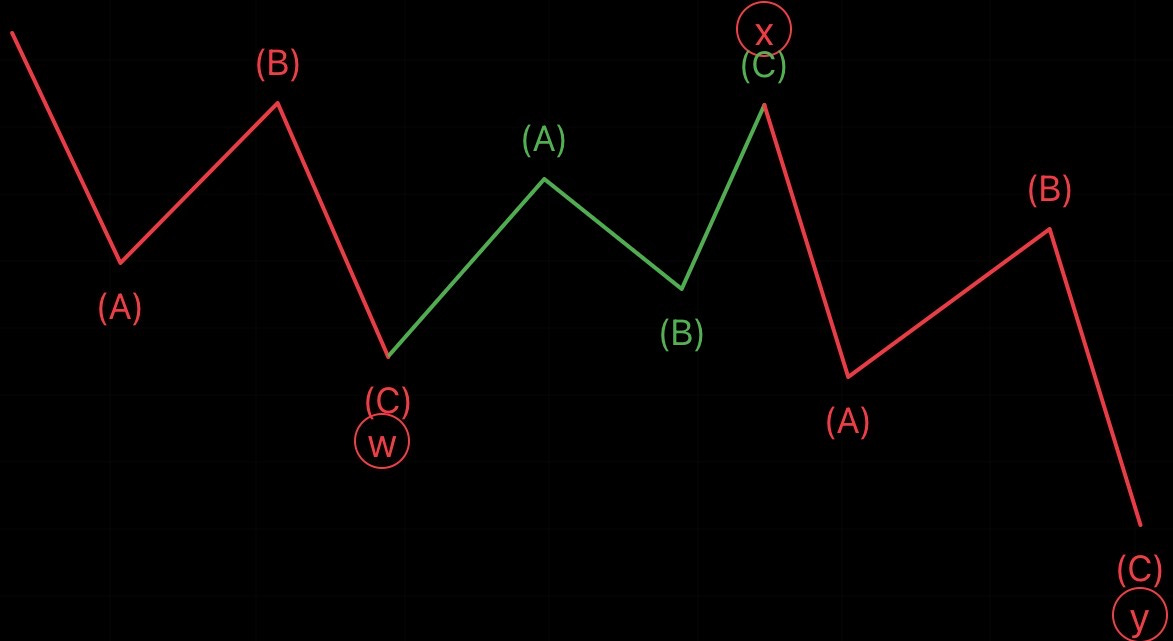
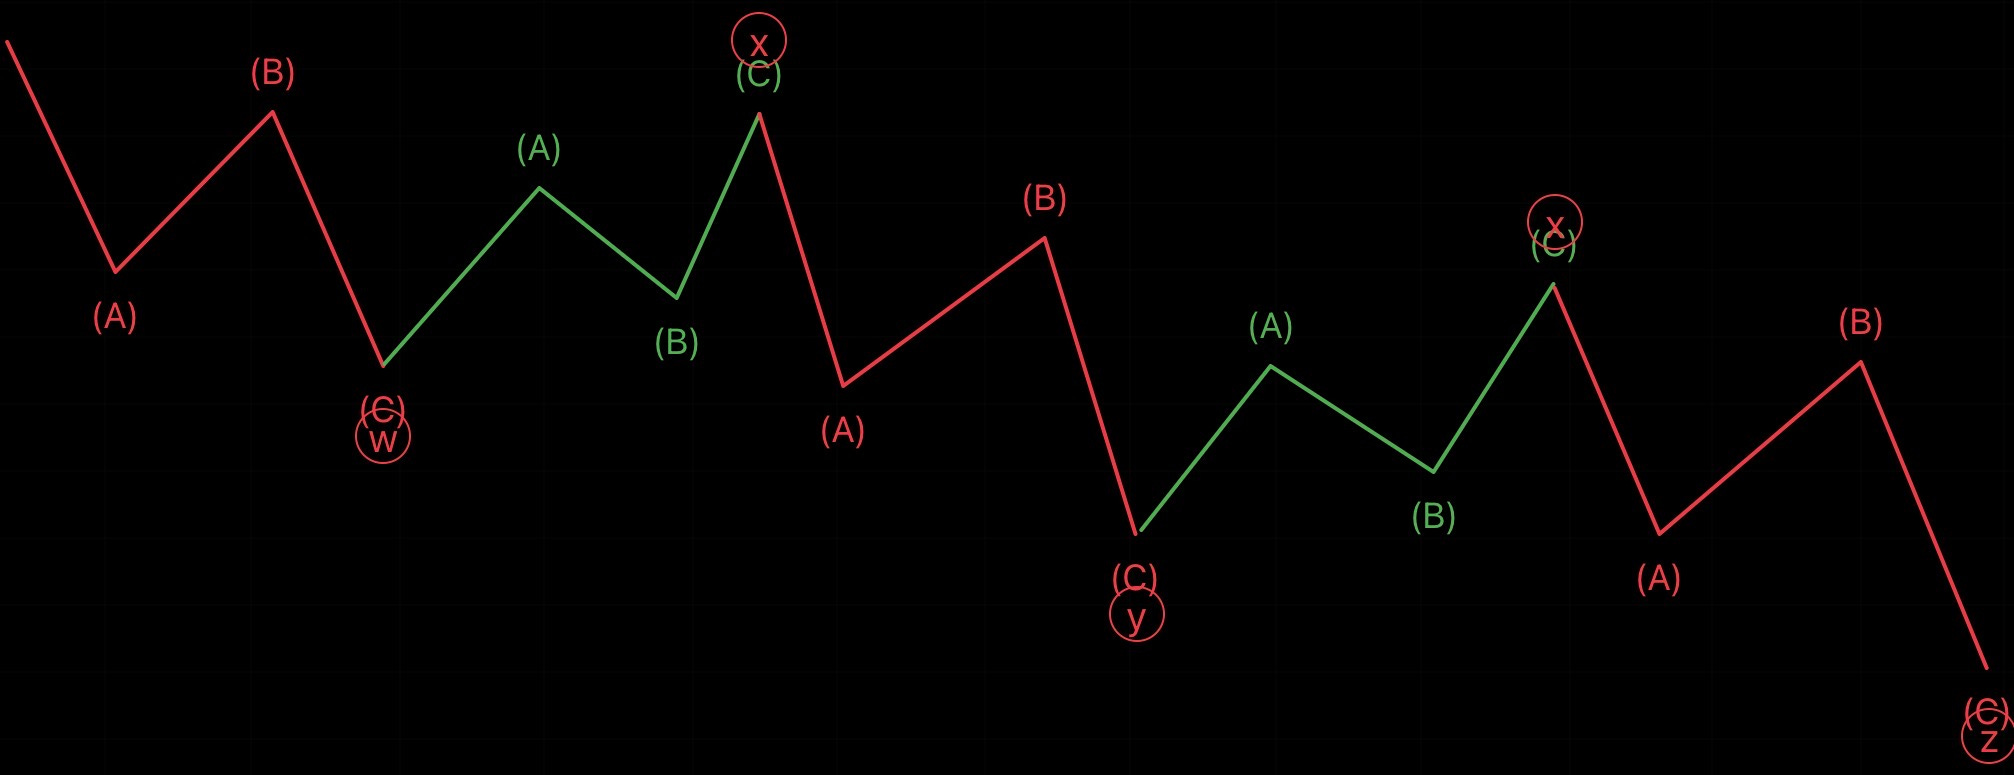
Not every correction takes the simple three-wave zigzag form. A correction can also unfold as a flat, a sideways three-wave structure with a different internal proportion, or as a triangle, a contracting or expanding sideways pattern typically found in a wave 4 position or as a final structure before a trend resumes. Corrections can also combine two or three of these simpler patterns into a single larger structure, labeled W-X-Y for a combination of two corrective legs joined by a linking X wave, or W-X-Y-X-Z for three corrective legs joined by two X waves. When an EllTec report references a completed WXYXZ structure, it means the correction in question was unusually complex and prolonged rather than a single clean zigzag, and complex corrections of this kind tend to mark higher-degree turning points and exhaust the prior trend’s pressure more thoroughly than a simple correction would.
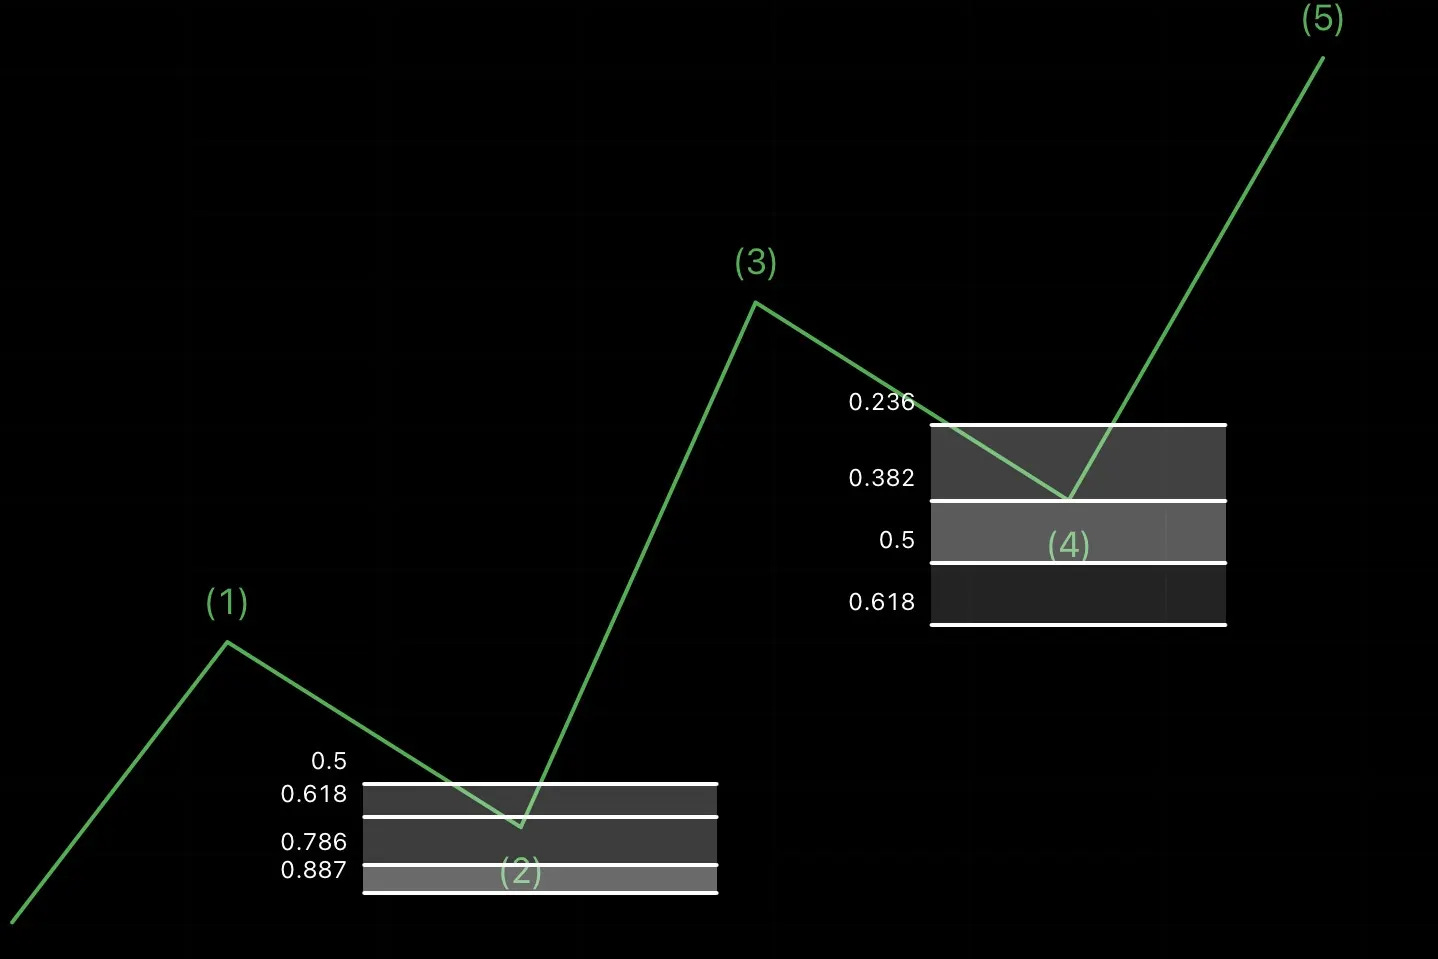
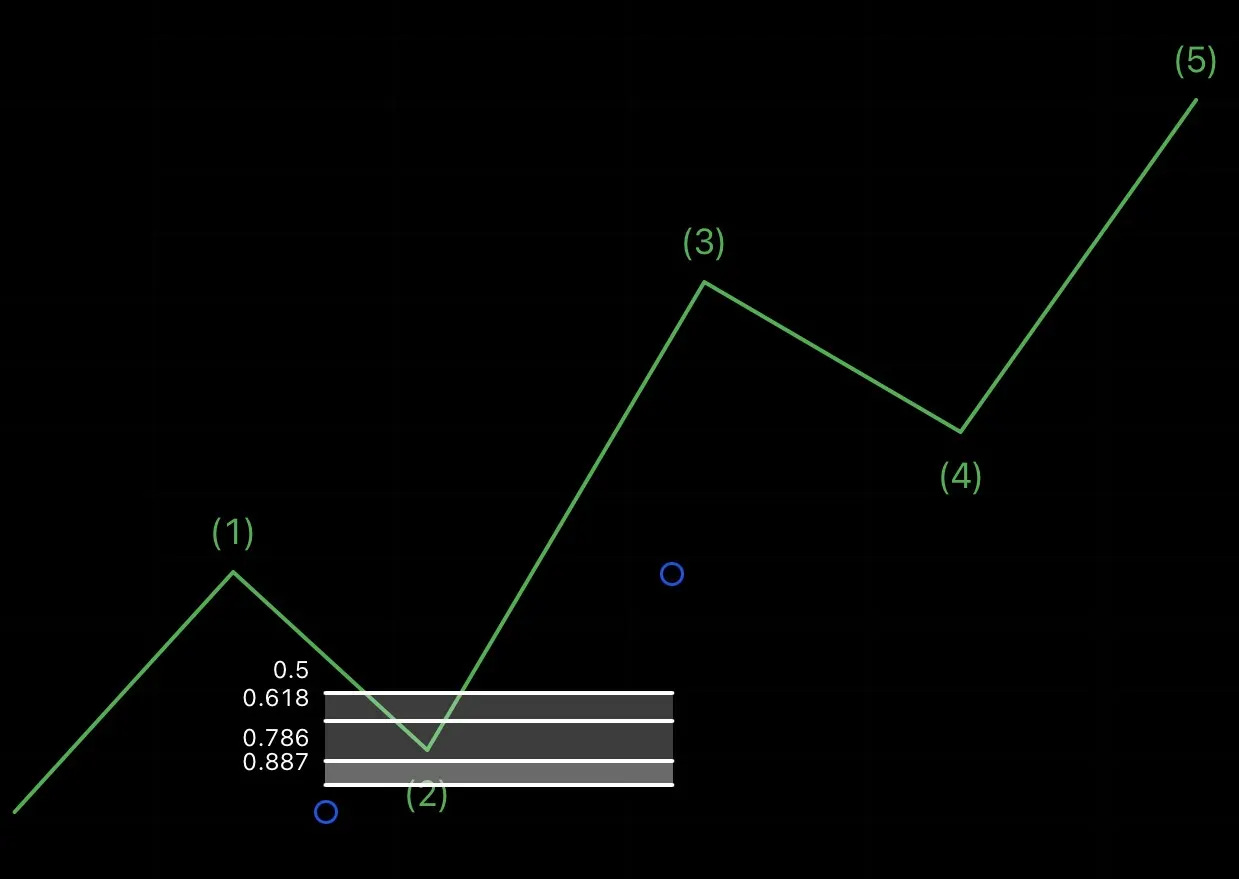
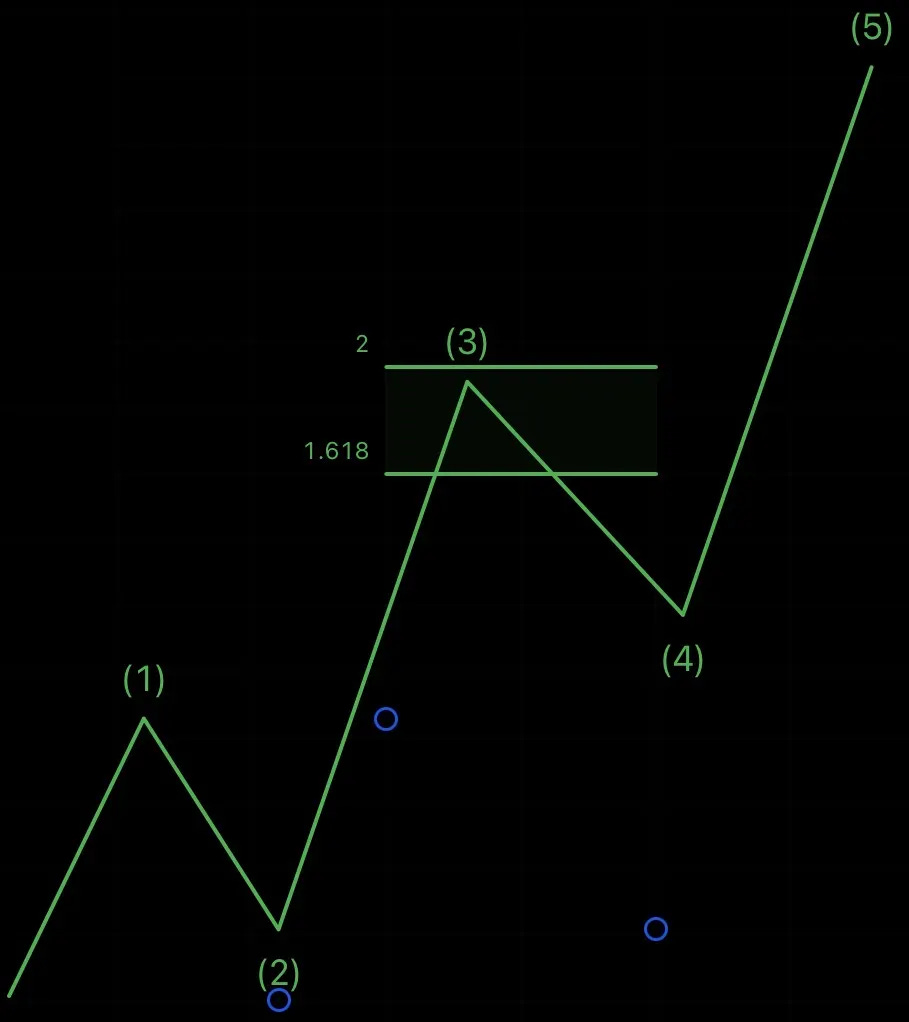
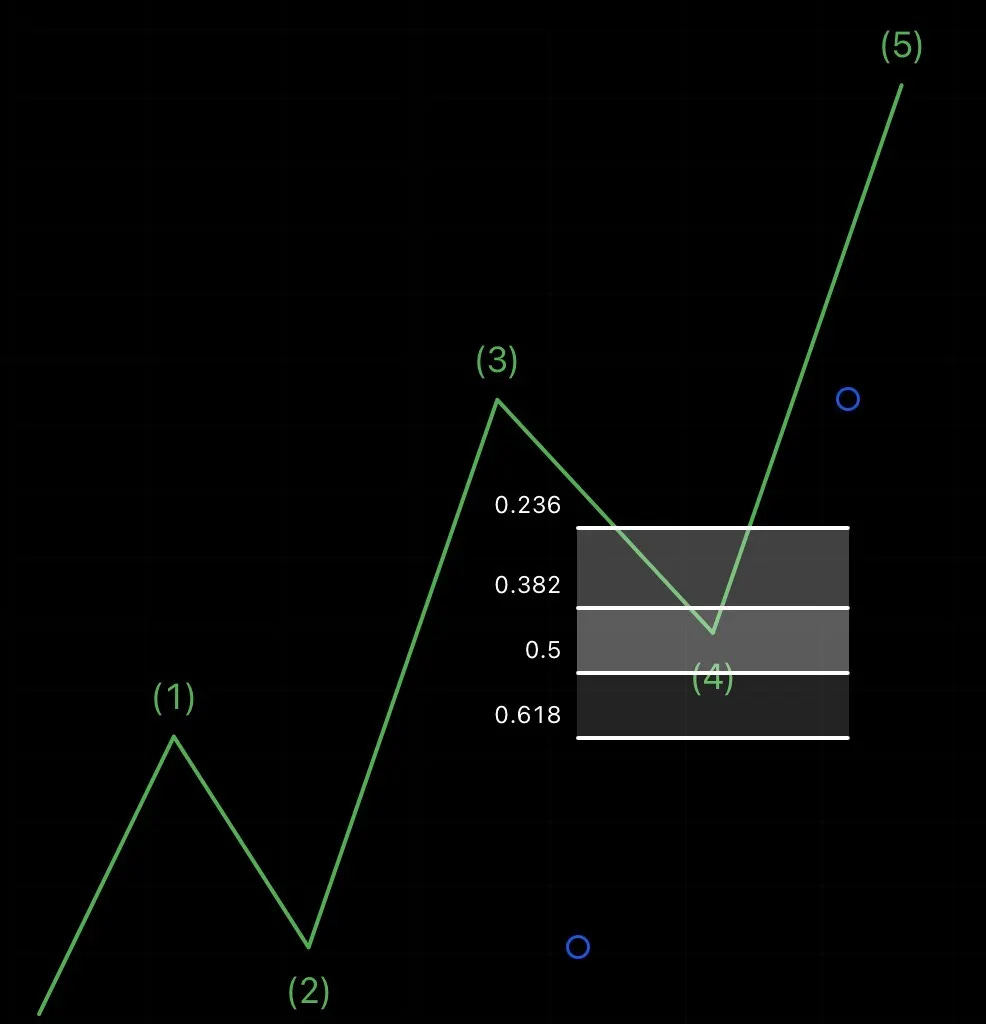
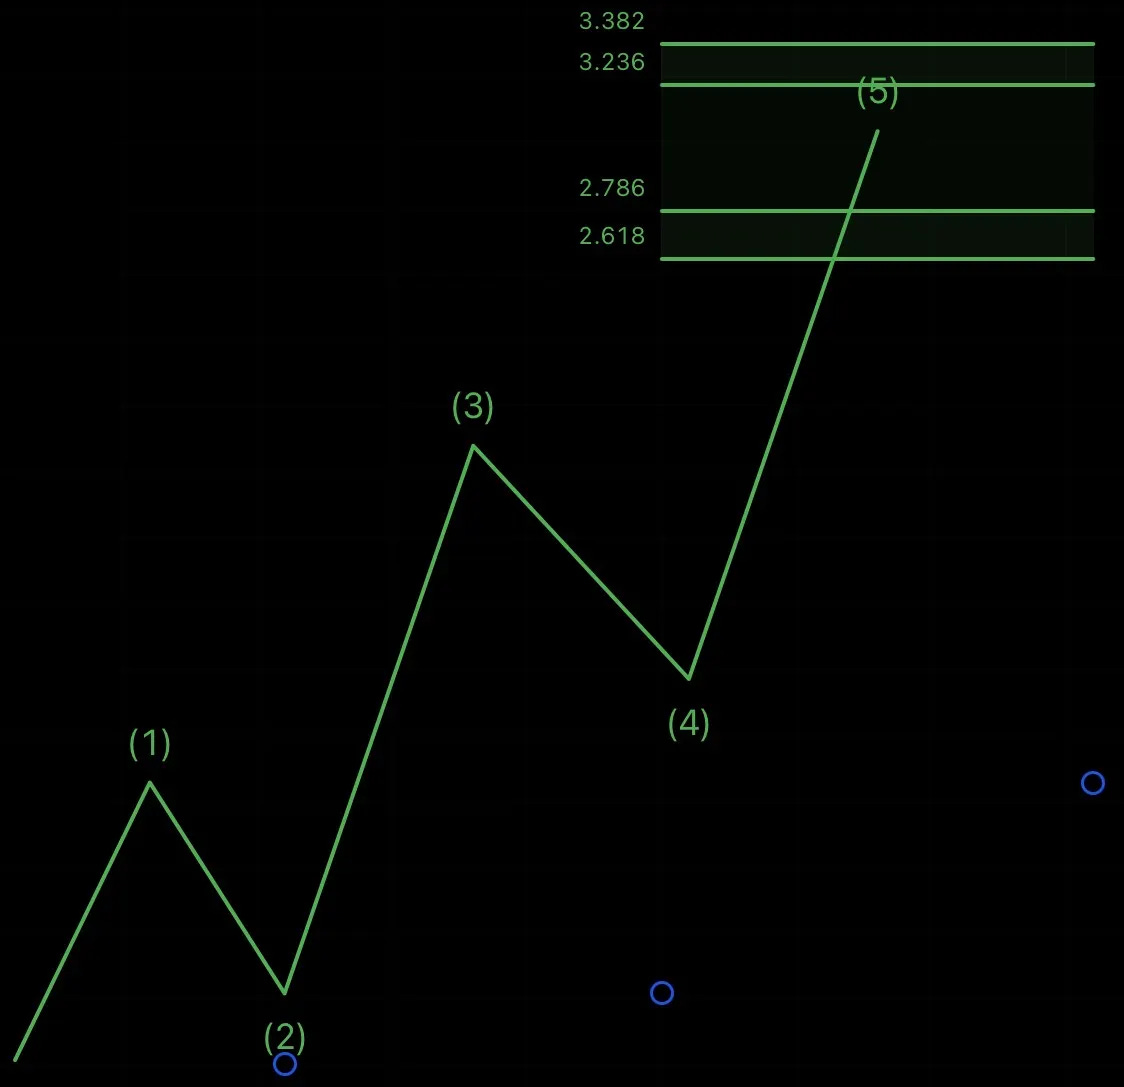
Fibonacci mathematics is not a separate add-on to Elliott Wave analysis, it is embedded in it. Ralph Elliott observed, and decades of subsequent analysis across a wide range of markets have confirmed, that the price relationships between waves cluster around ratios derived from the Fibonacci sequence and its associated golden ratio, approximately 0.618 and its inverse 1.618. This reflects the same proportional relationship that recurs throughout natural growth patterns, and in markets it shows up as a statistical tendency for corrections to retrace a Fibonacci-ratio portion of the preceding move, and for impulse waves to extend by a Fibonacci-ratio multiple of an earlier wave in the same sequence.
Retracement levels and extension levels measure two different things. Retracement levels, most commonly 23.6%, 38.2%, 50%, 61.8%, 78.6% and 88,7%, measure how much of an already-completed move a correction gives back. Extension levels, most commonly 1.272, 1.618, 2.618, 3.382, and 4.236, measure how far an impulse wave is likely to travel beyond a prior reference wave in the same sequence. Every “Target Zone” quoted in an EllTec report as a specific price range is simply one or more of these ratios translated into an actual price, applied to a specific, named prior wave.
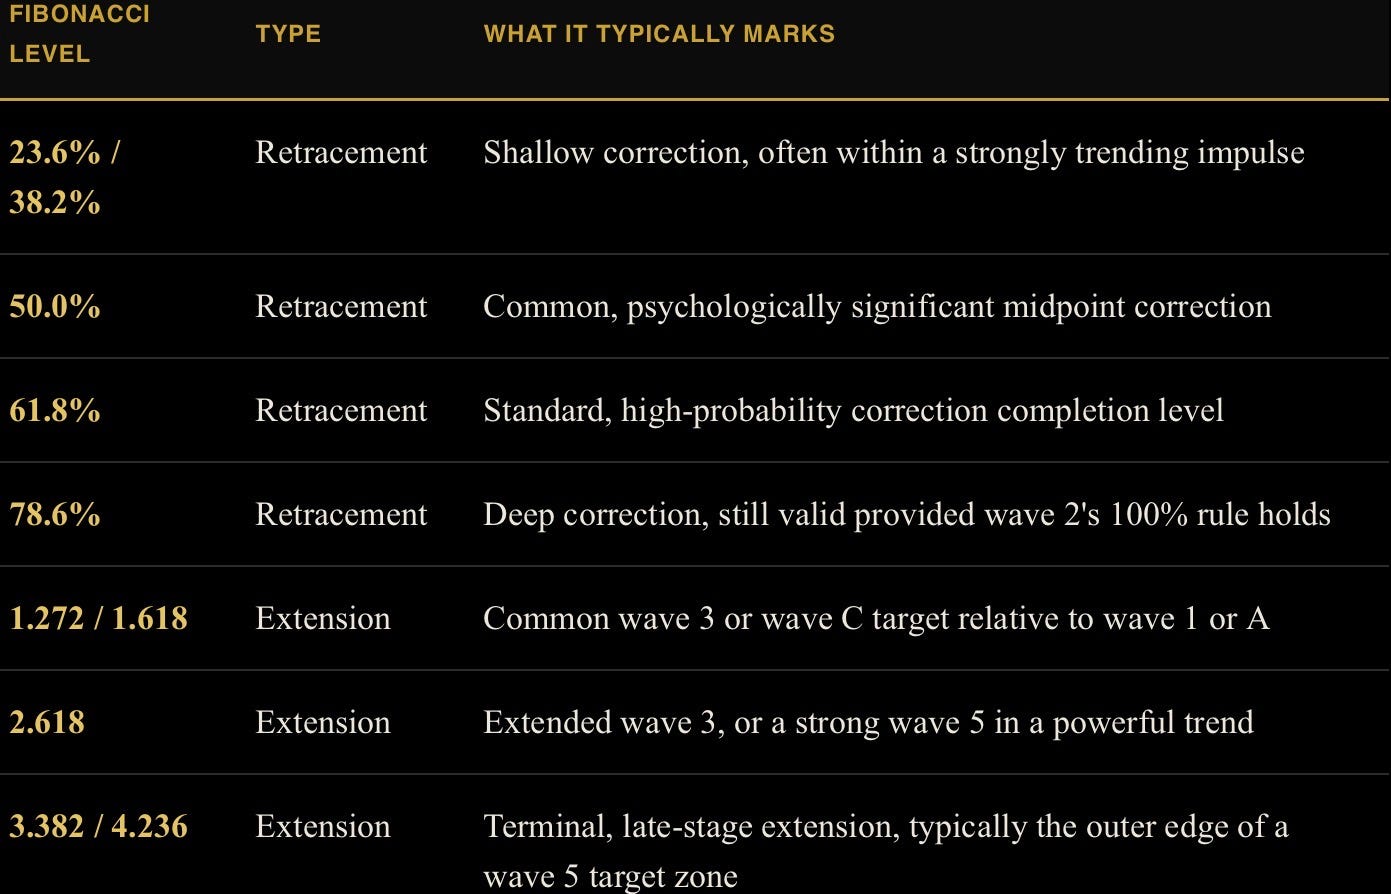
The area between the 61.8% and 78.6% retracement levels is treated as the highest-probability completion zone for a corrective wave 2, and occasionally for a deep wave 4, because a correction that reaches this deep while still respecting wave 2’s rule demonstrates that the prior structural extreme has already absorbed a meaningful amount of opposing pressure without the count being invalidated. This is why EllTec’s trade plans so consistently frame their laddered entries around exactly this zone rather than around a single price.
The diagram below illustrates the basic shape referenced throughout every technical section: a five-wave impulse in the direction of the trend, a wave 2 correction completing inside the golden zone, and a three-wave corrective sequence following the impulse’s completion.
More about Elliot Waves:

4.2 VOLUME ANALYSIS
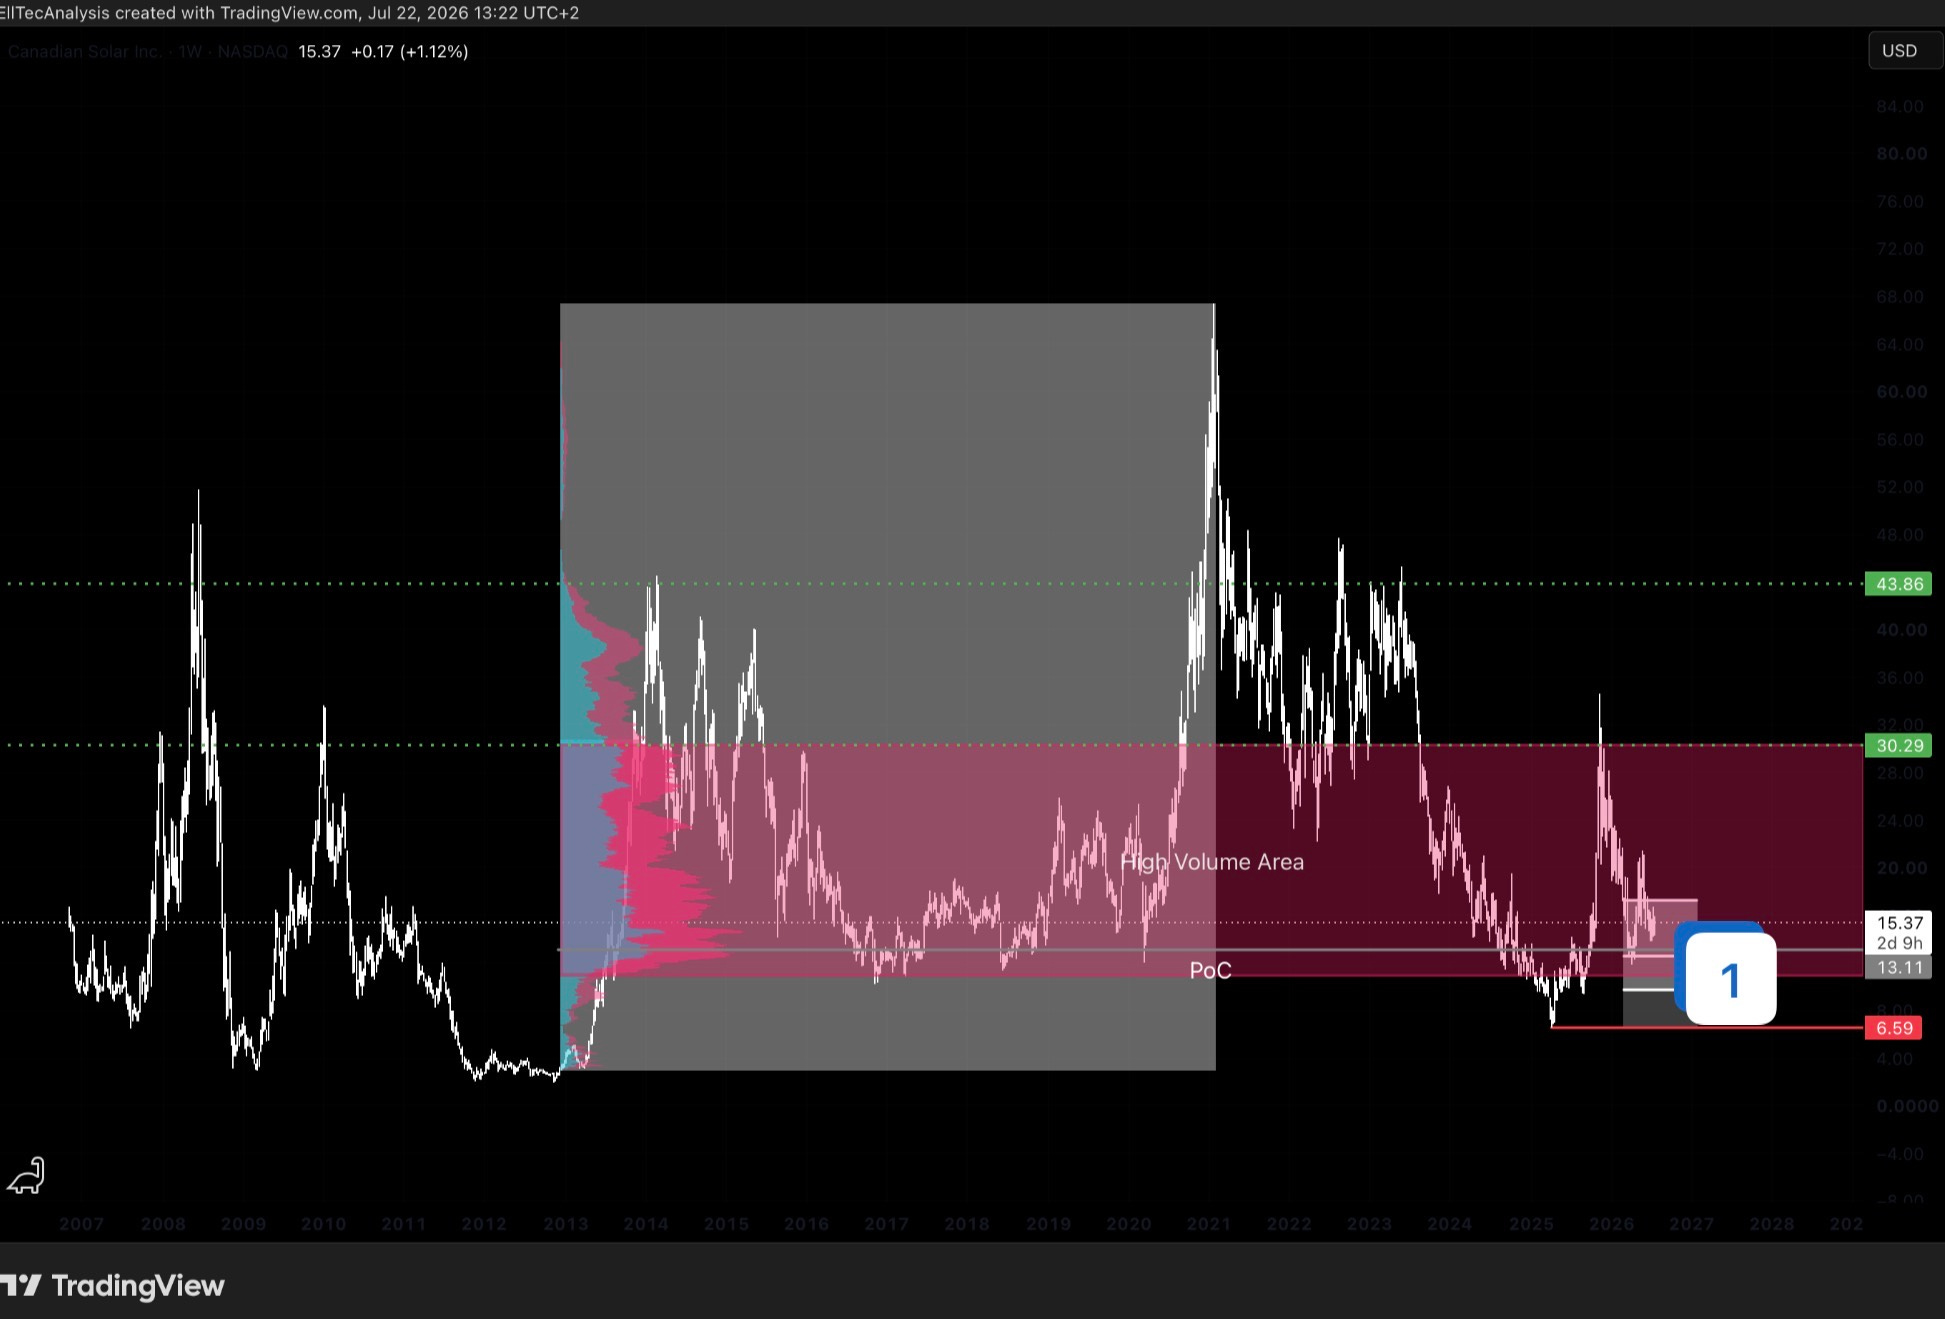
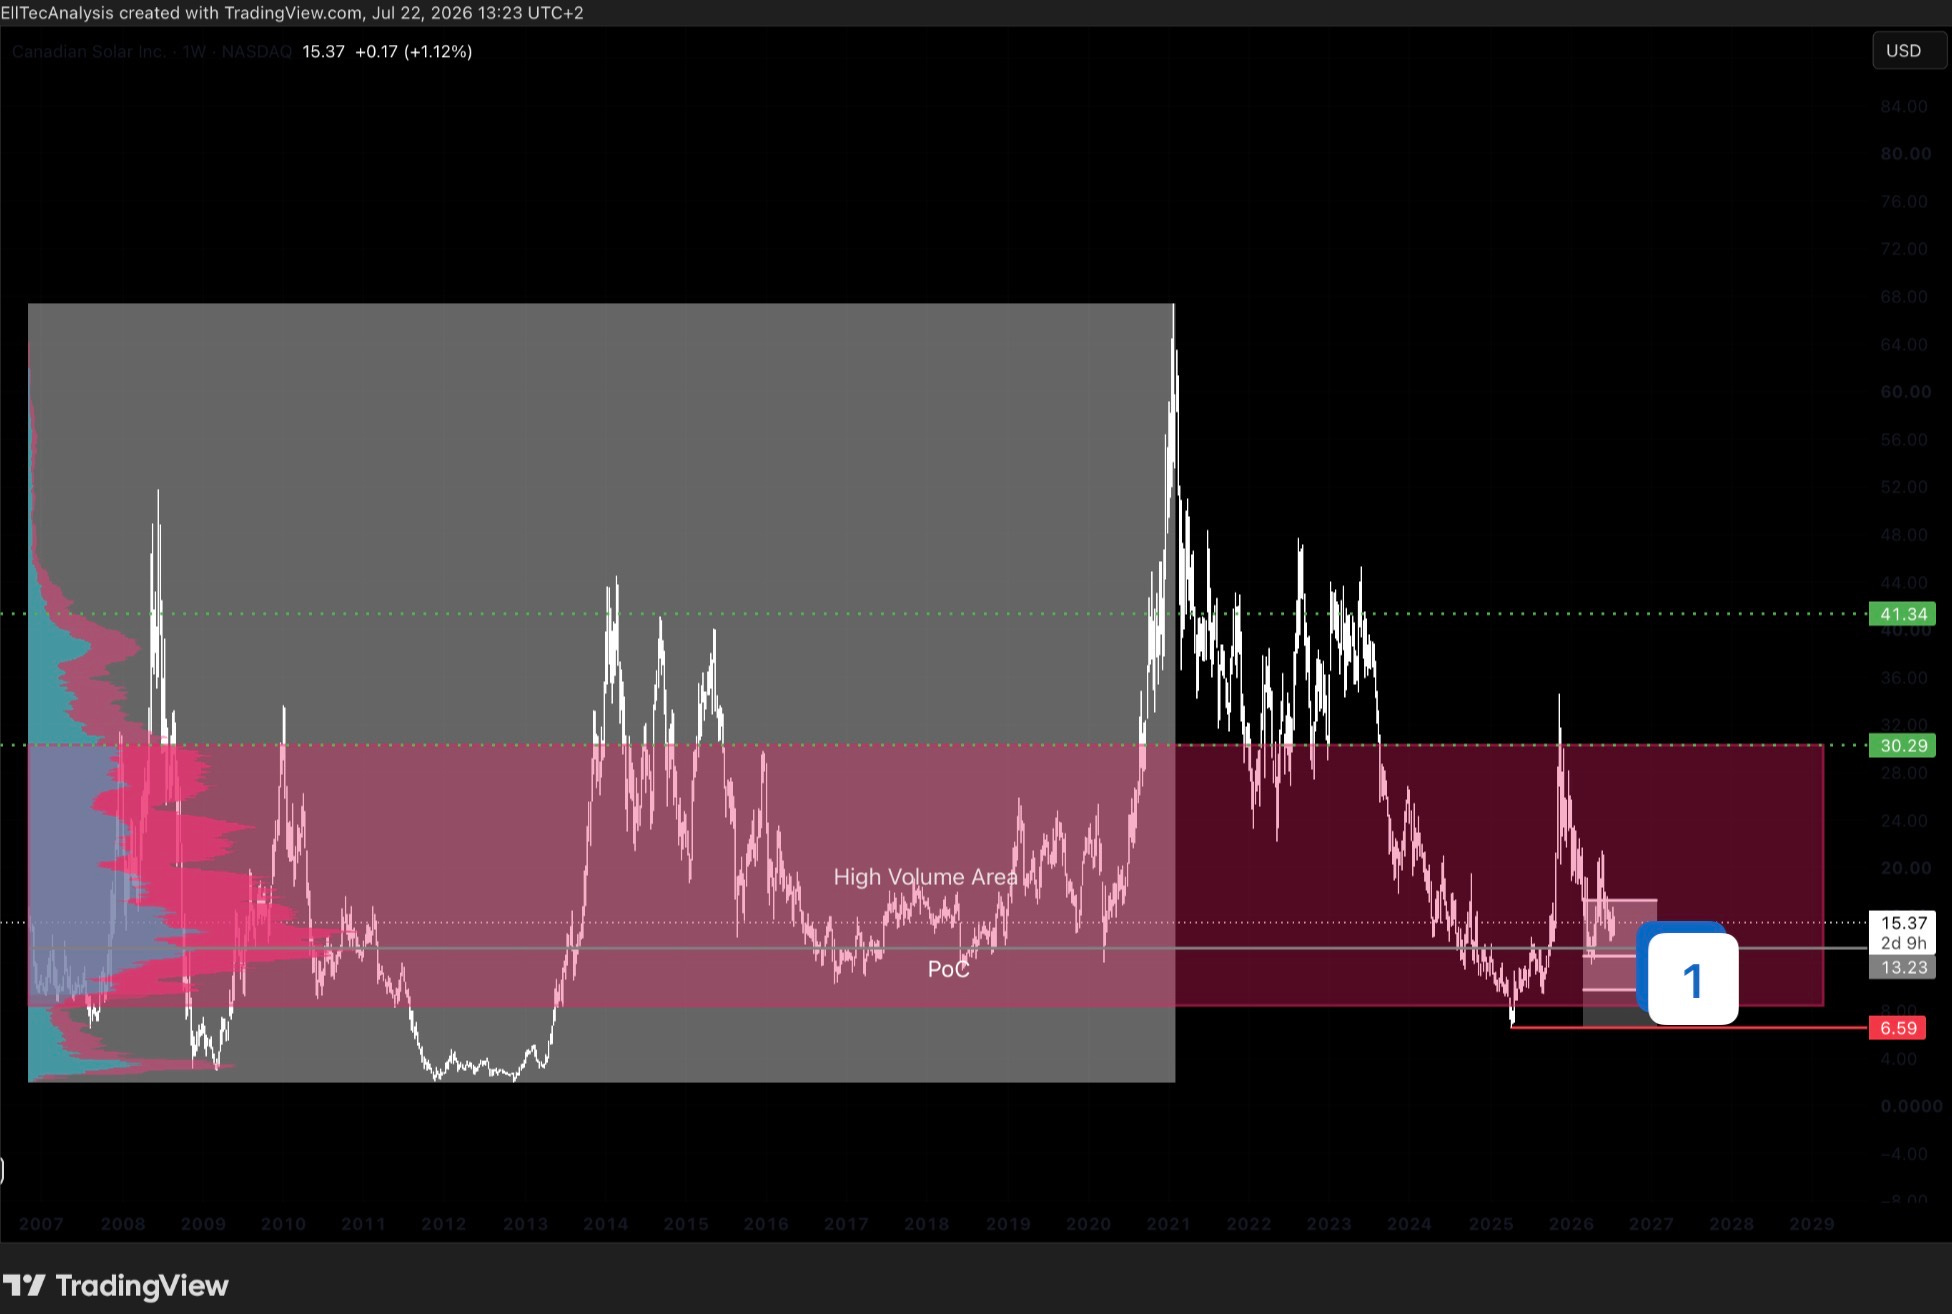
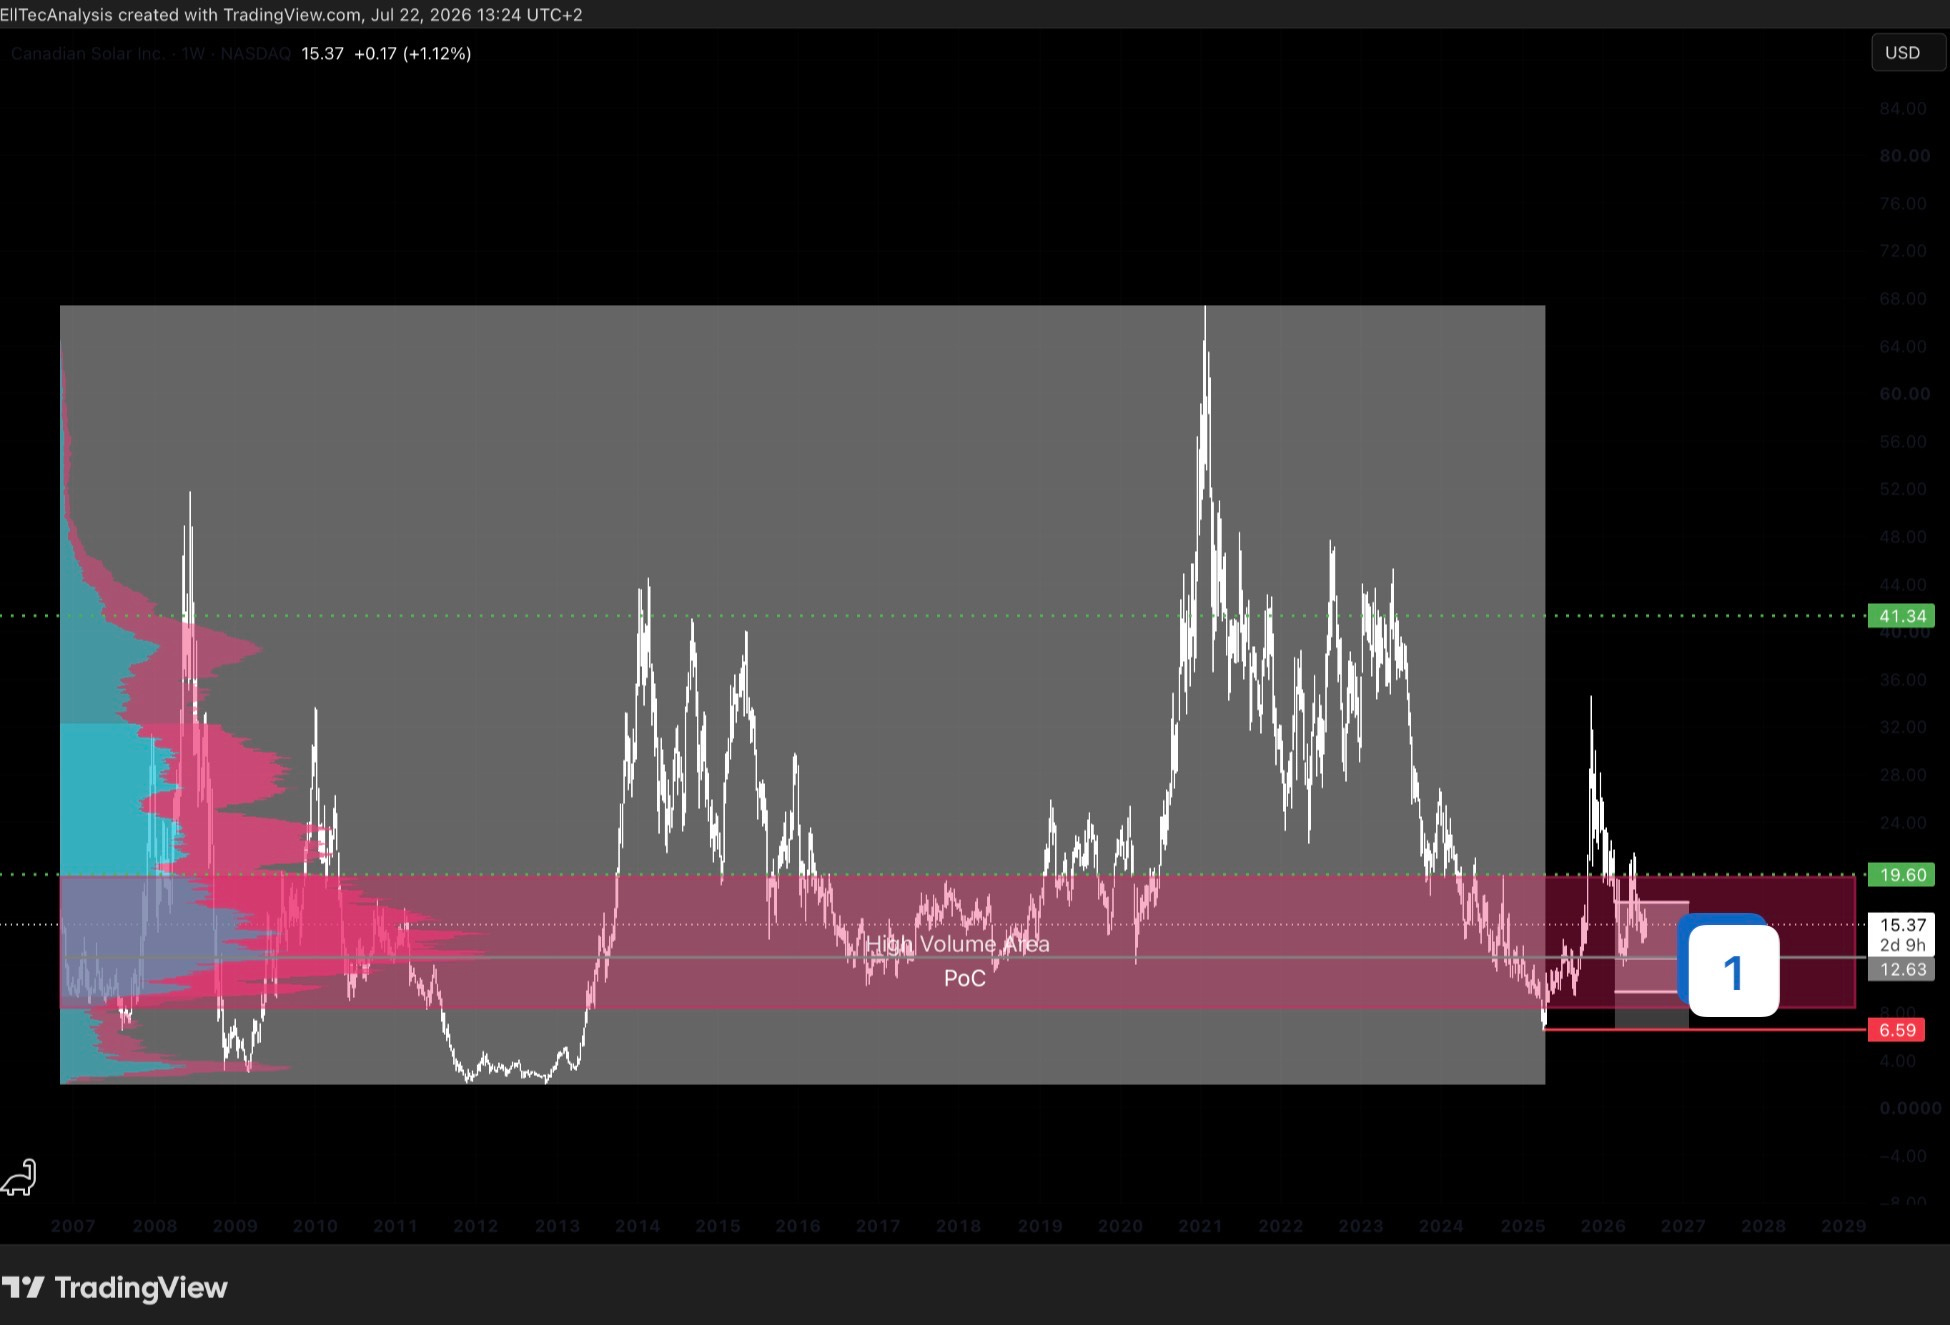
Where included, volume analysis functions as a confirmation and divergence tool rather than a primary signal in its own right, since volume is the fuel behind a wave count rather than the flame itself. Through range volume profiles gigh volume areas can be identified, which act as supportive and resistance price territories. Those territories are can confirm and invalidate fibonacci calculated price targets and can confirm price moves and determinates important price levels. The PoC, called point of control signals, at what price, the volume is the highest. Markets tend to move to the PoC, because volume can act as a magnet and provides support and resistance, price above the PoC offers support and price below tends as resistance, which makes impulsive rises in price hard to cross the PoC, but if the PoC is crosses to the upside, this can be seen as confirmation and further support.
Section 5: Alternative Scenarios, the “What If”
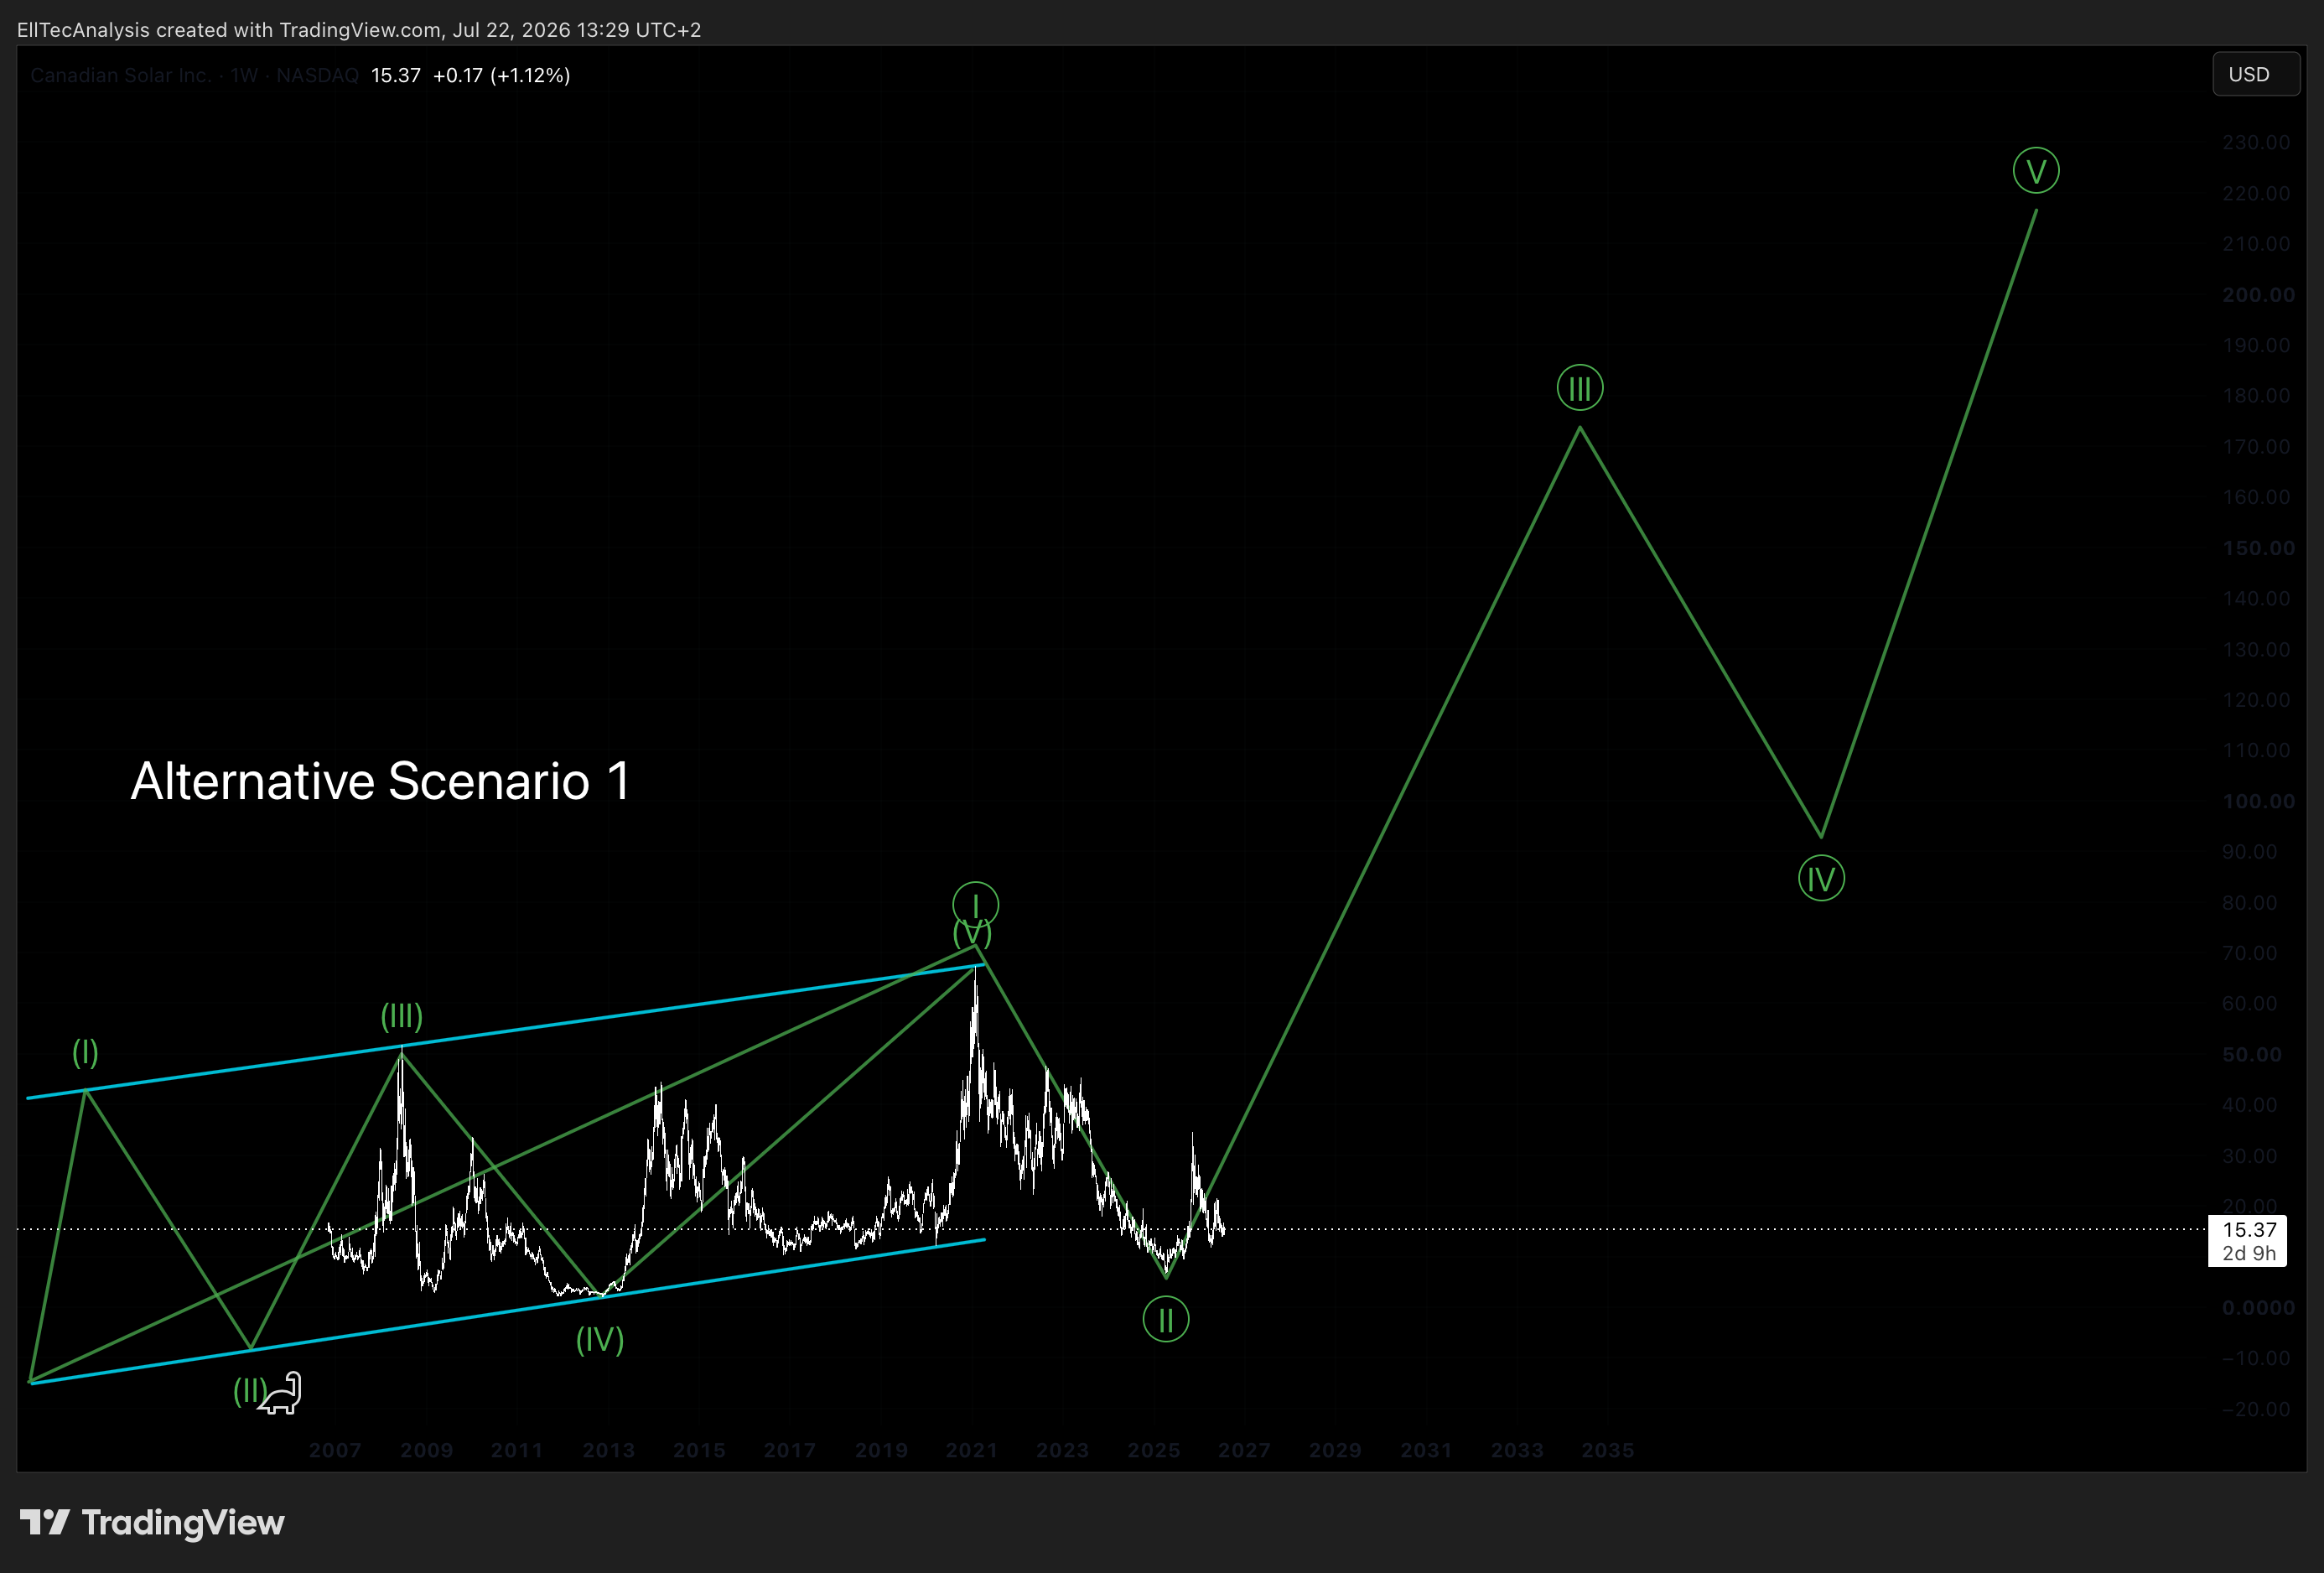
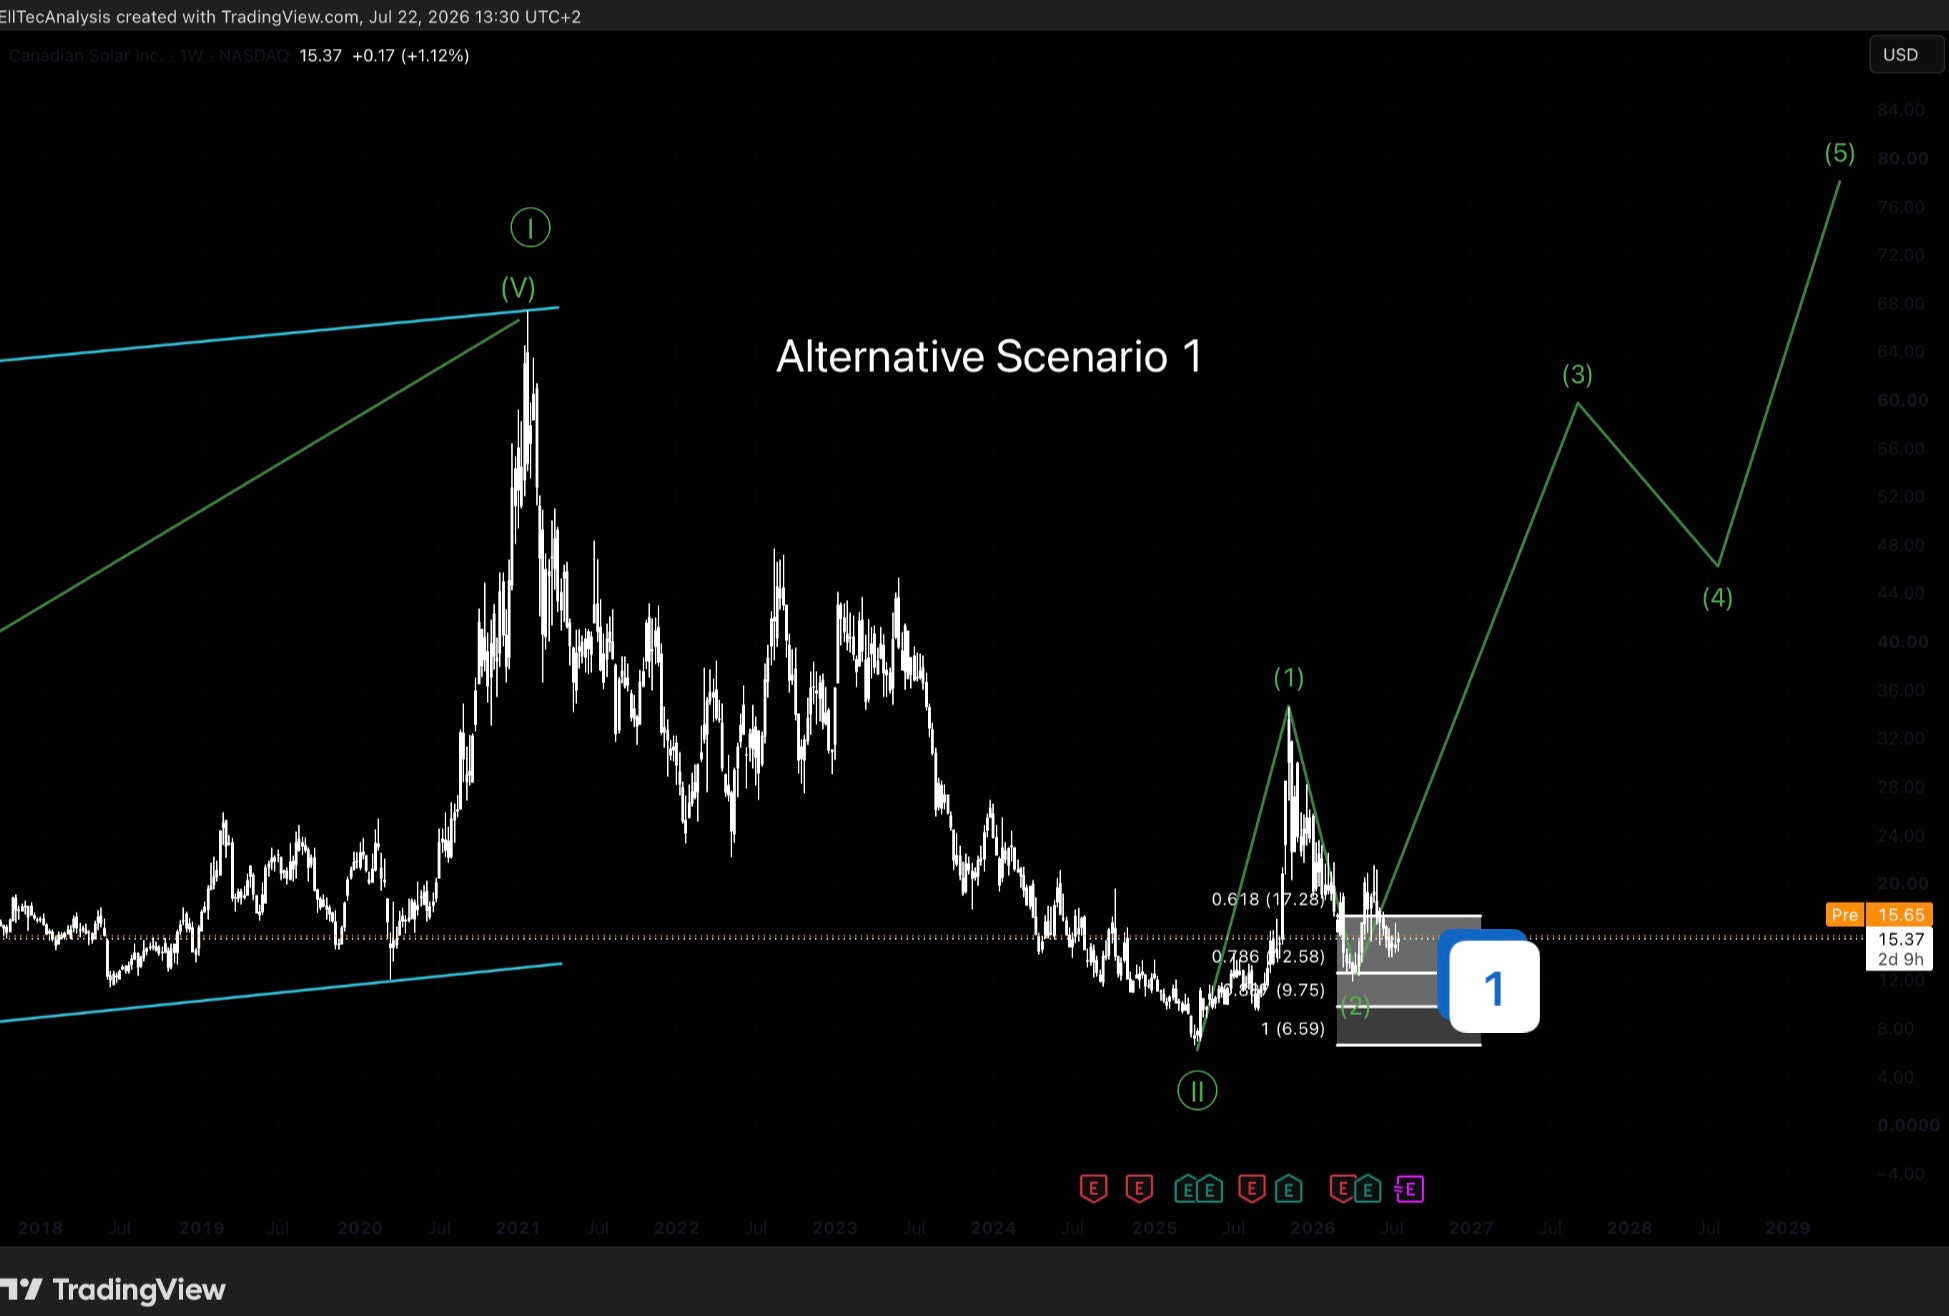
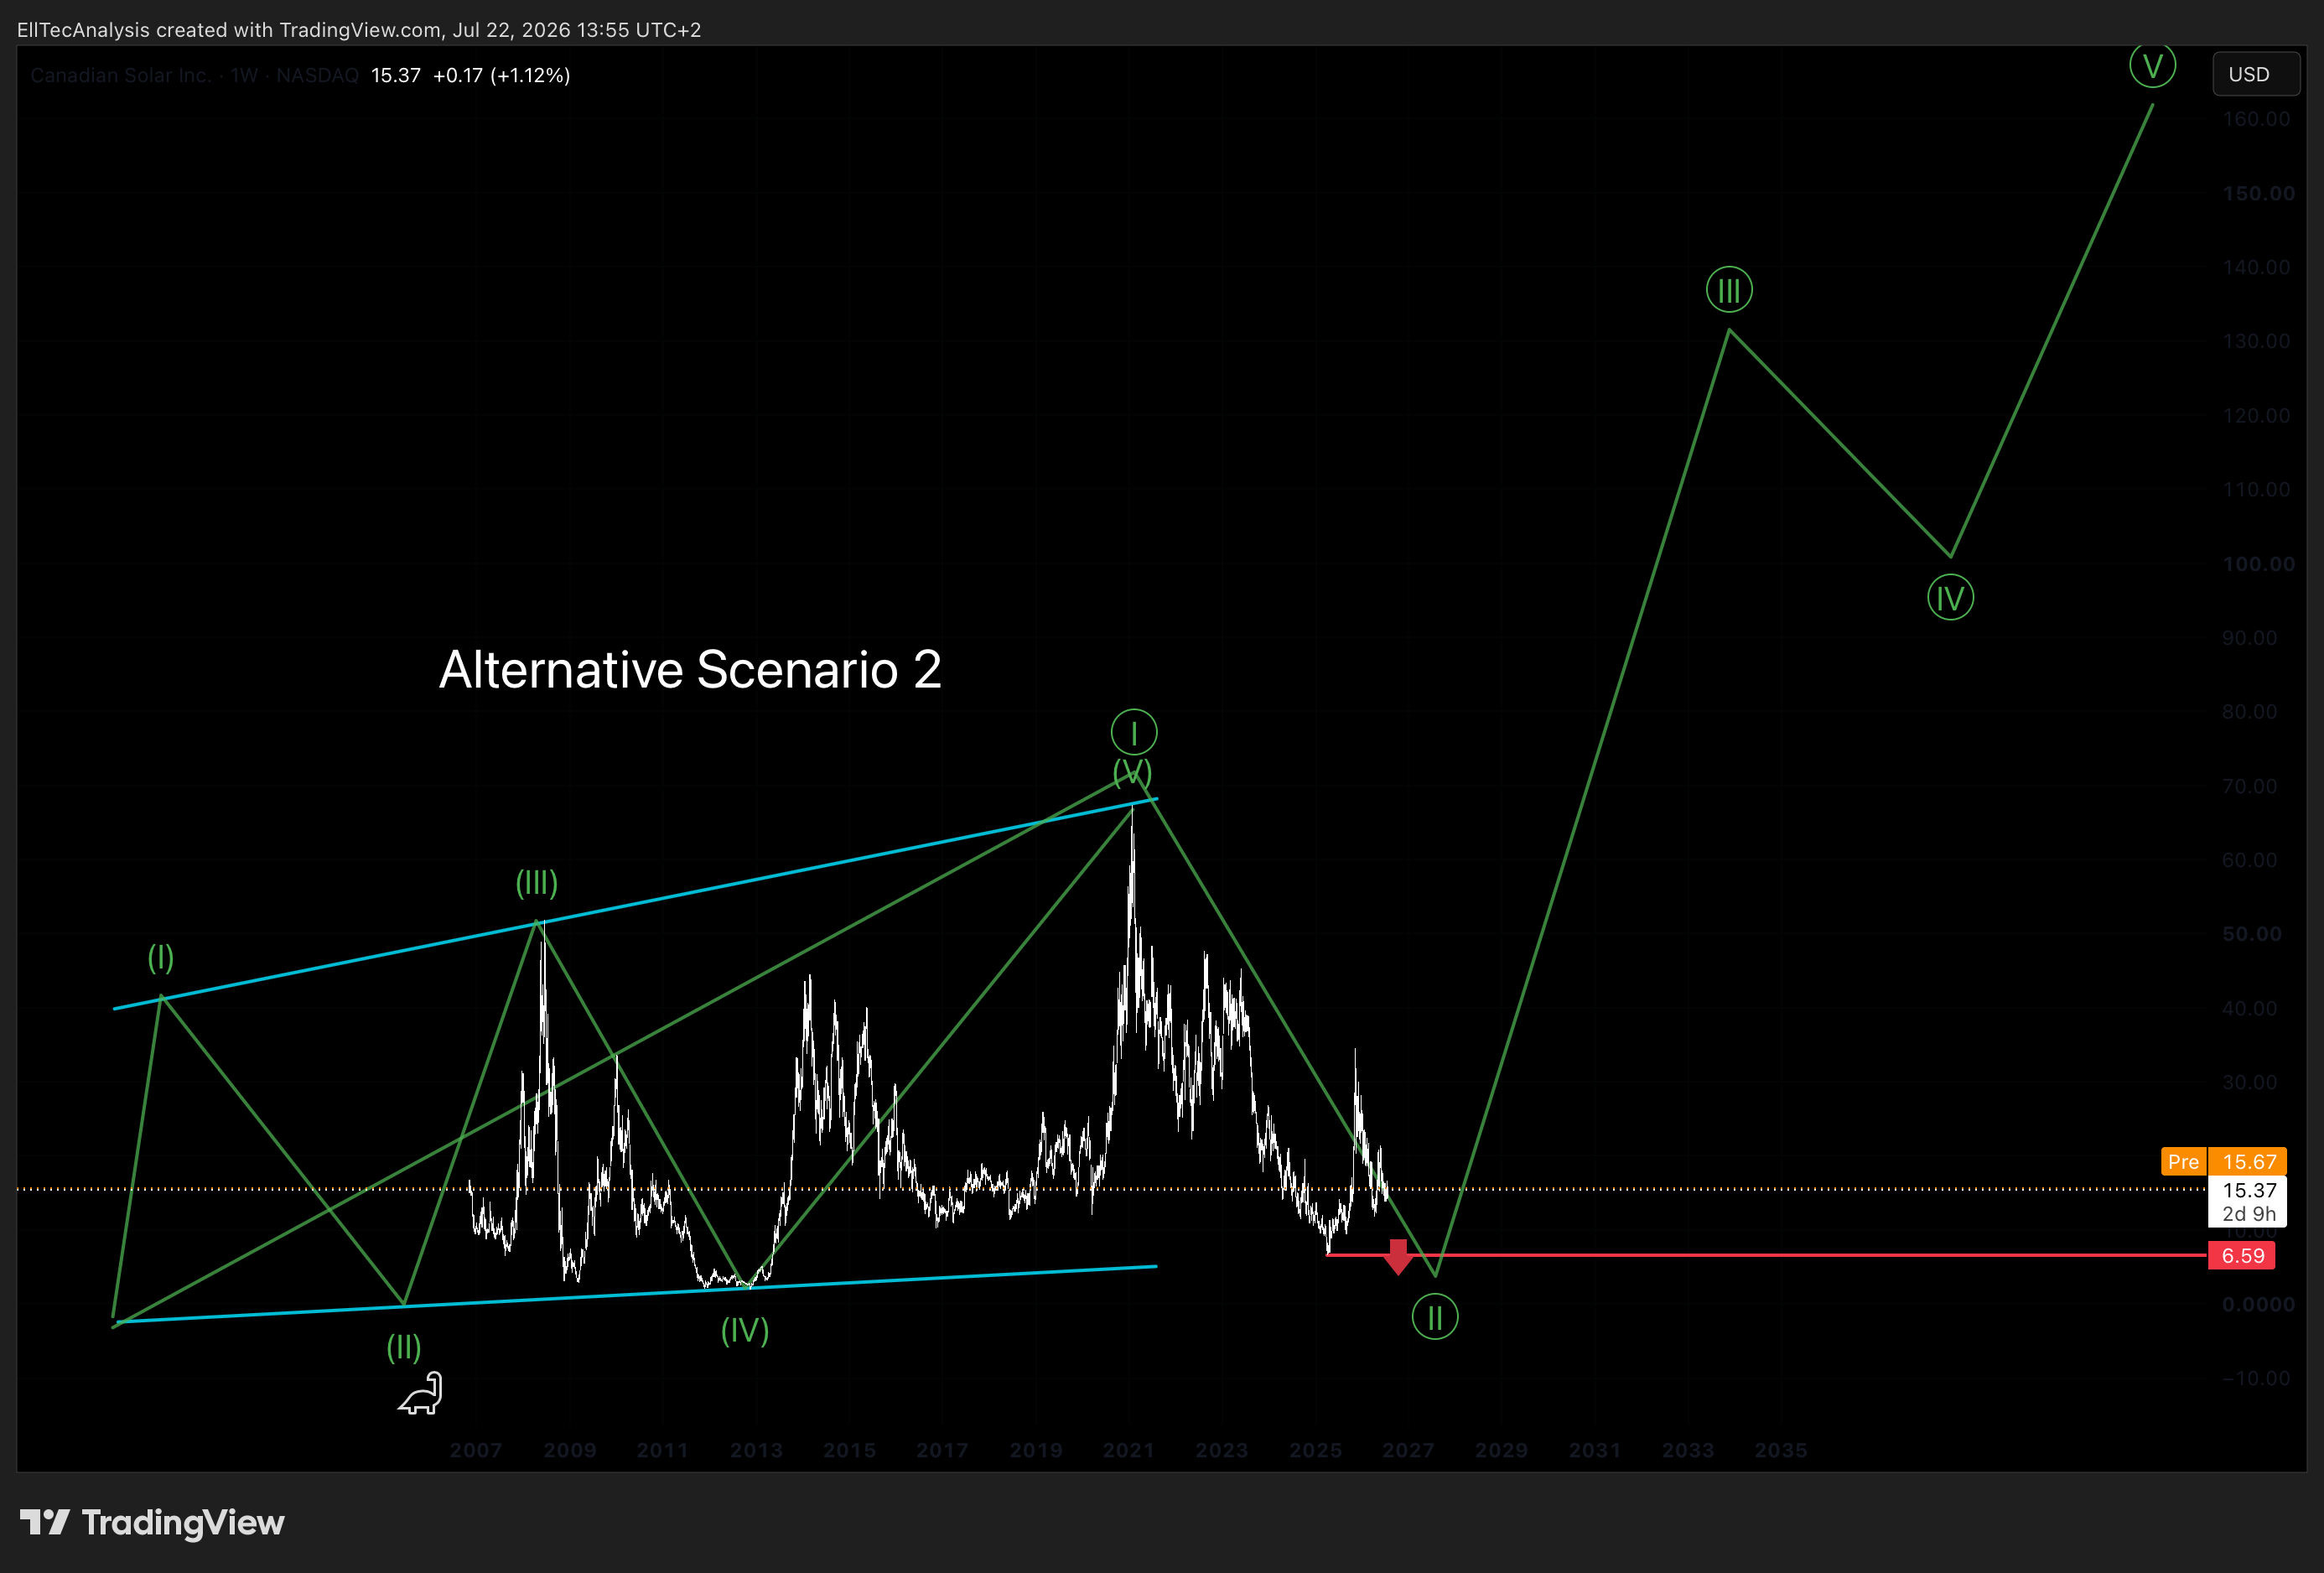
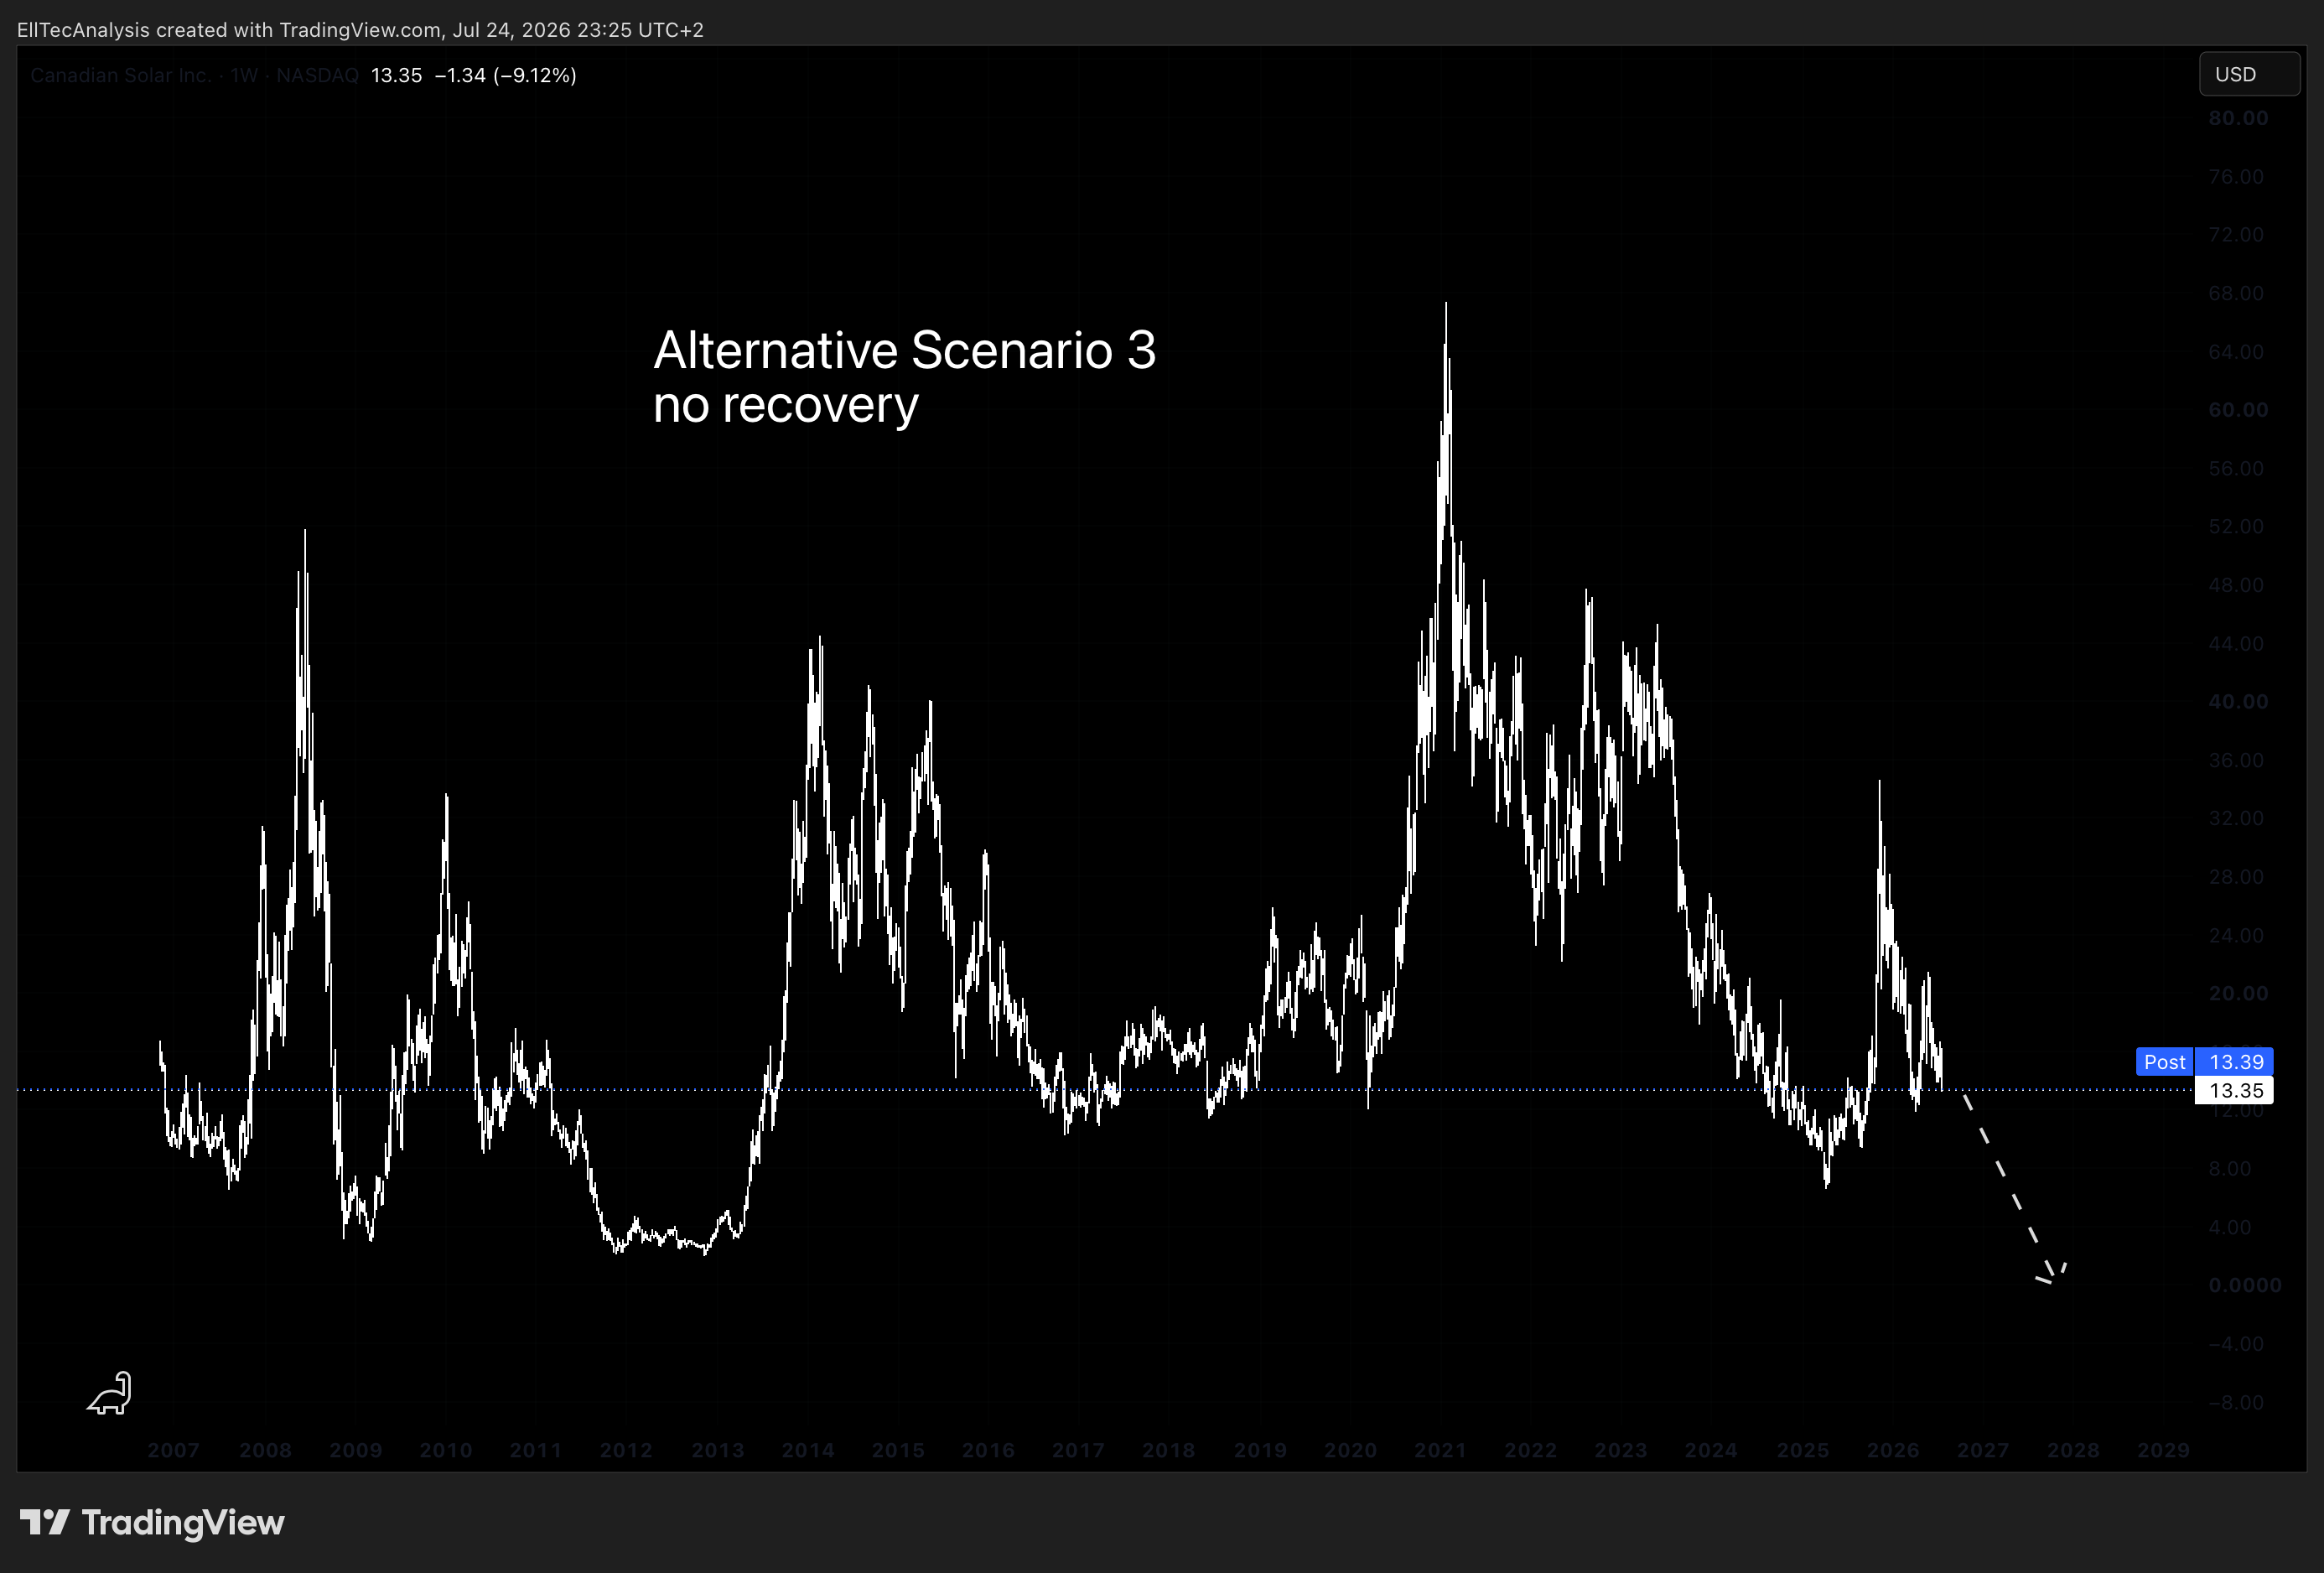
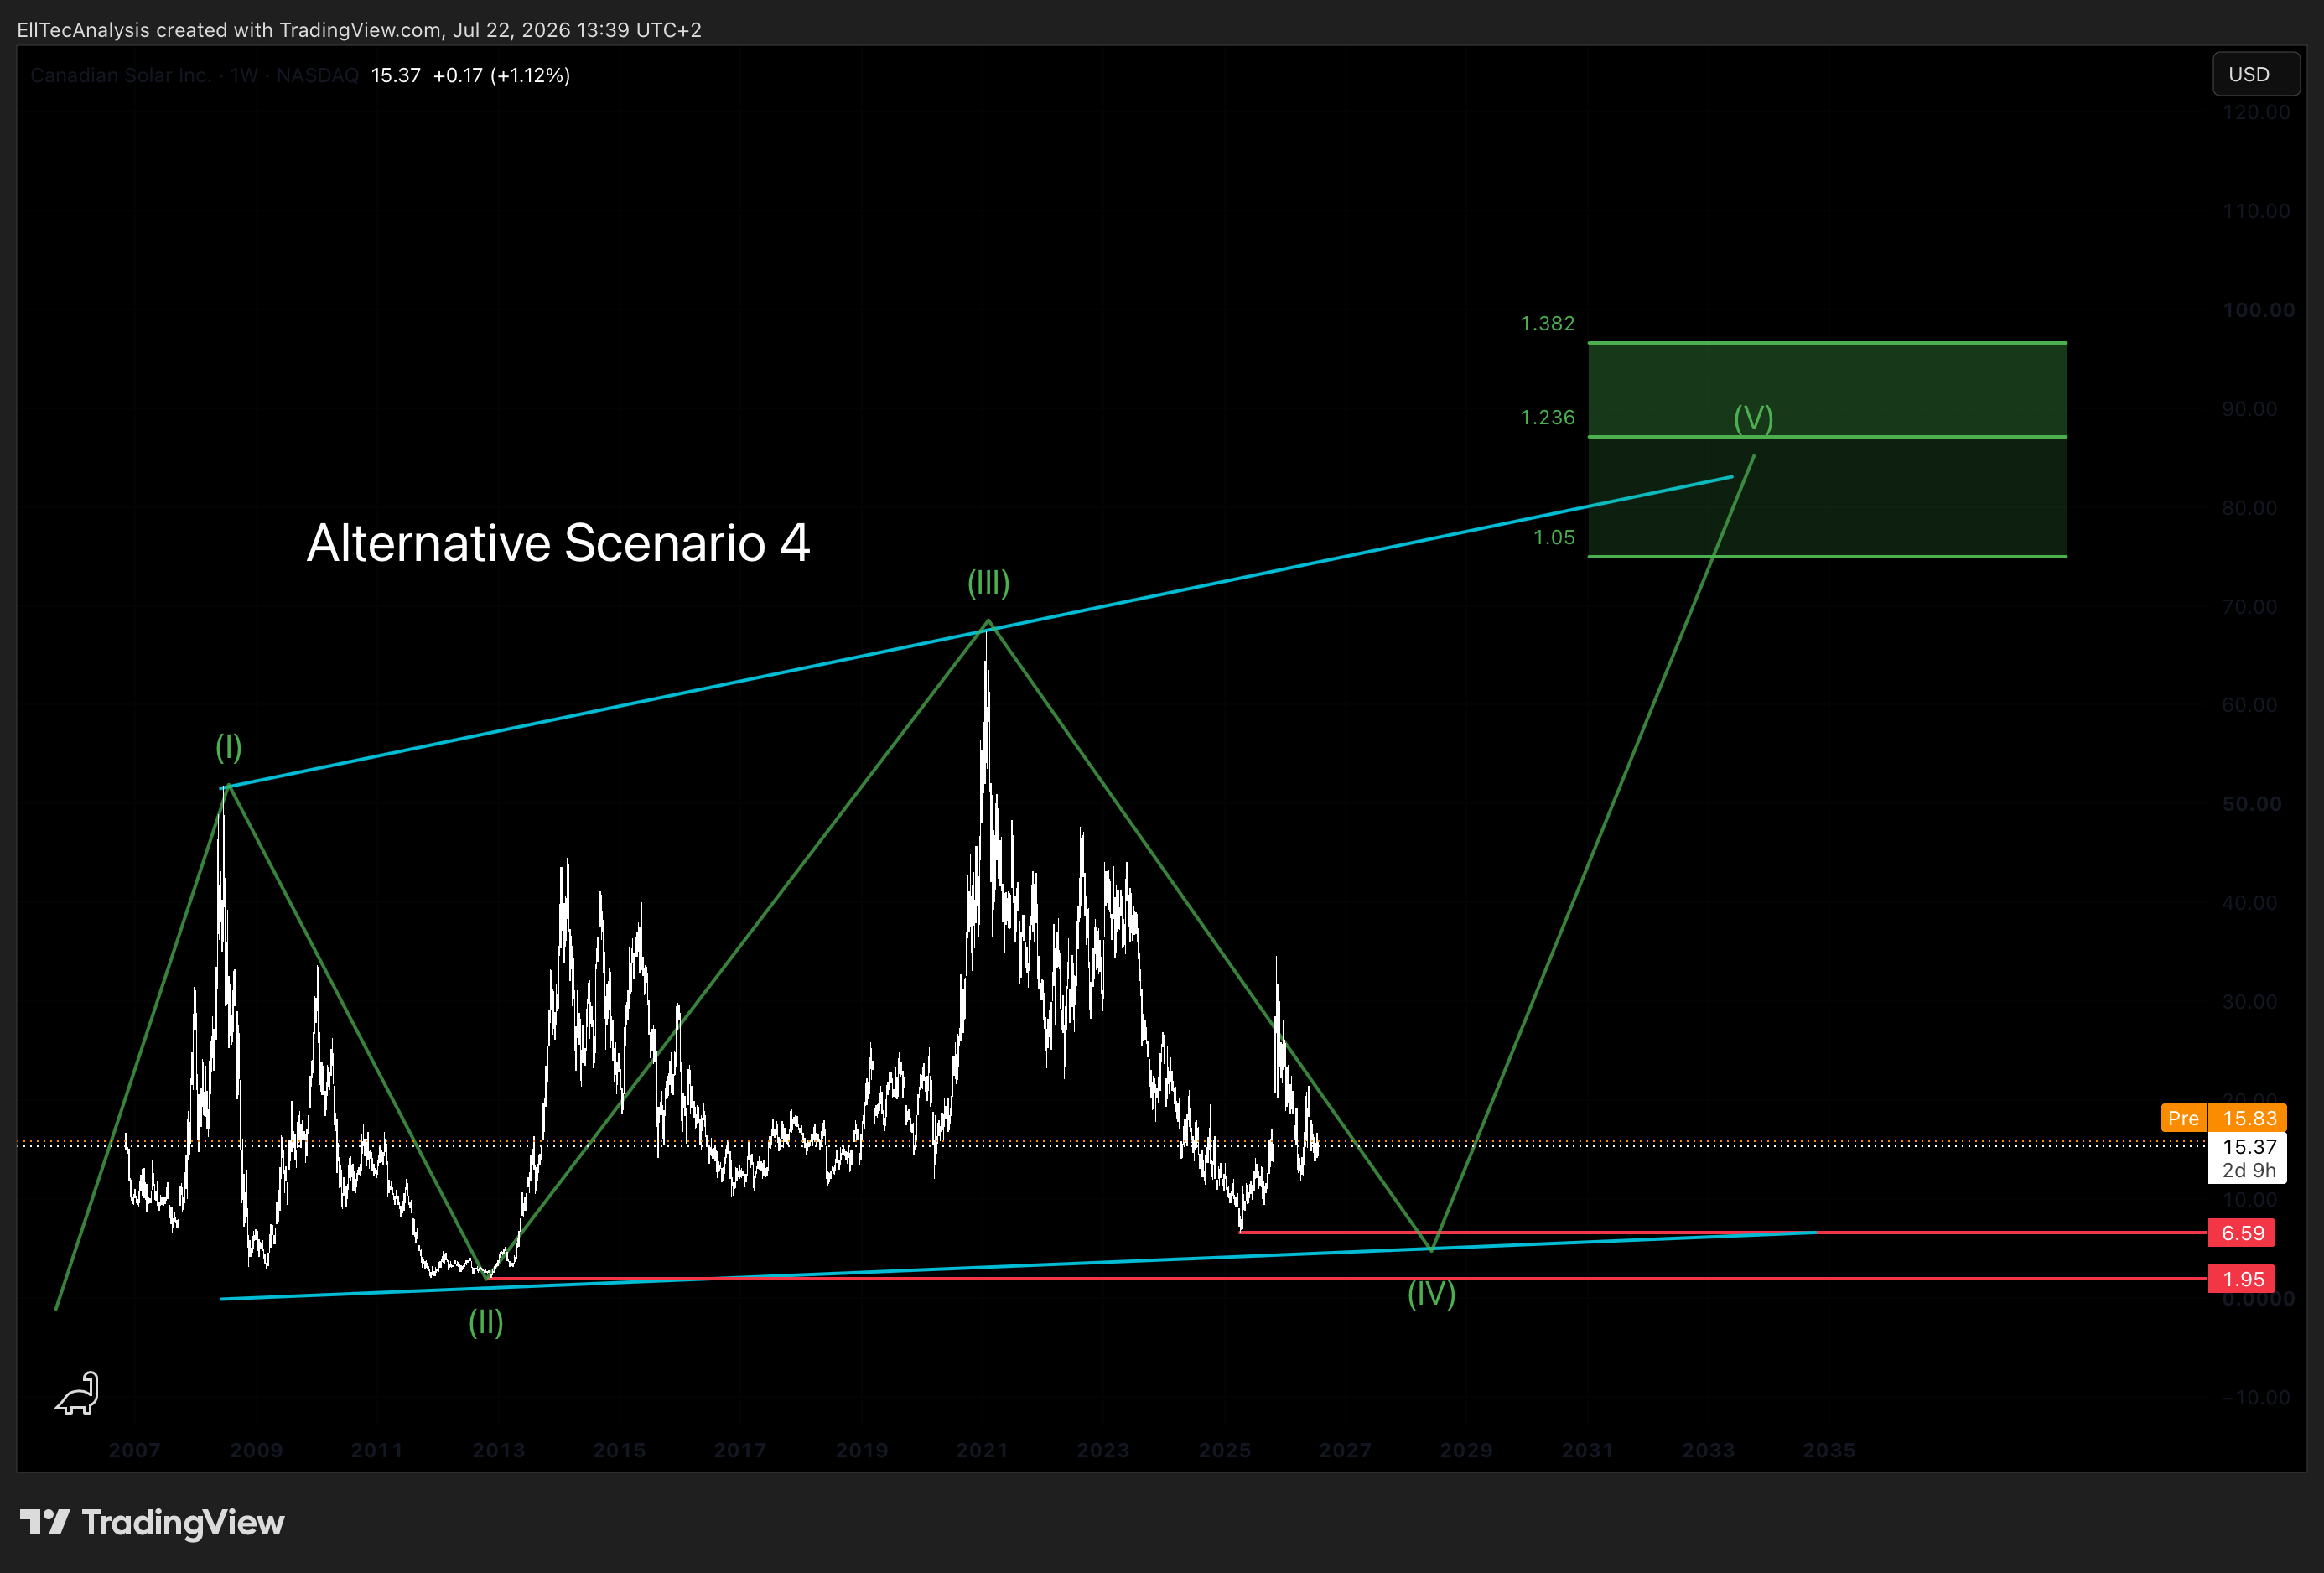
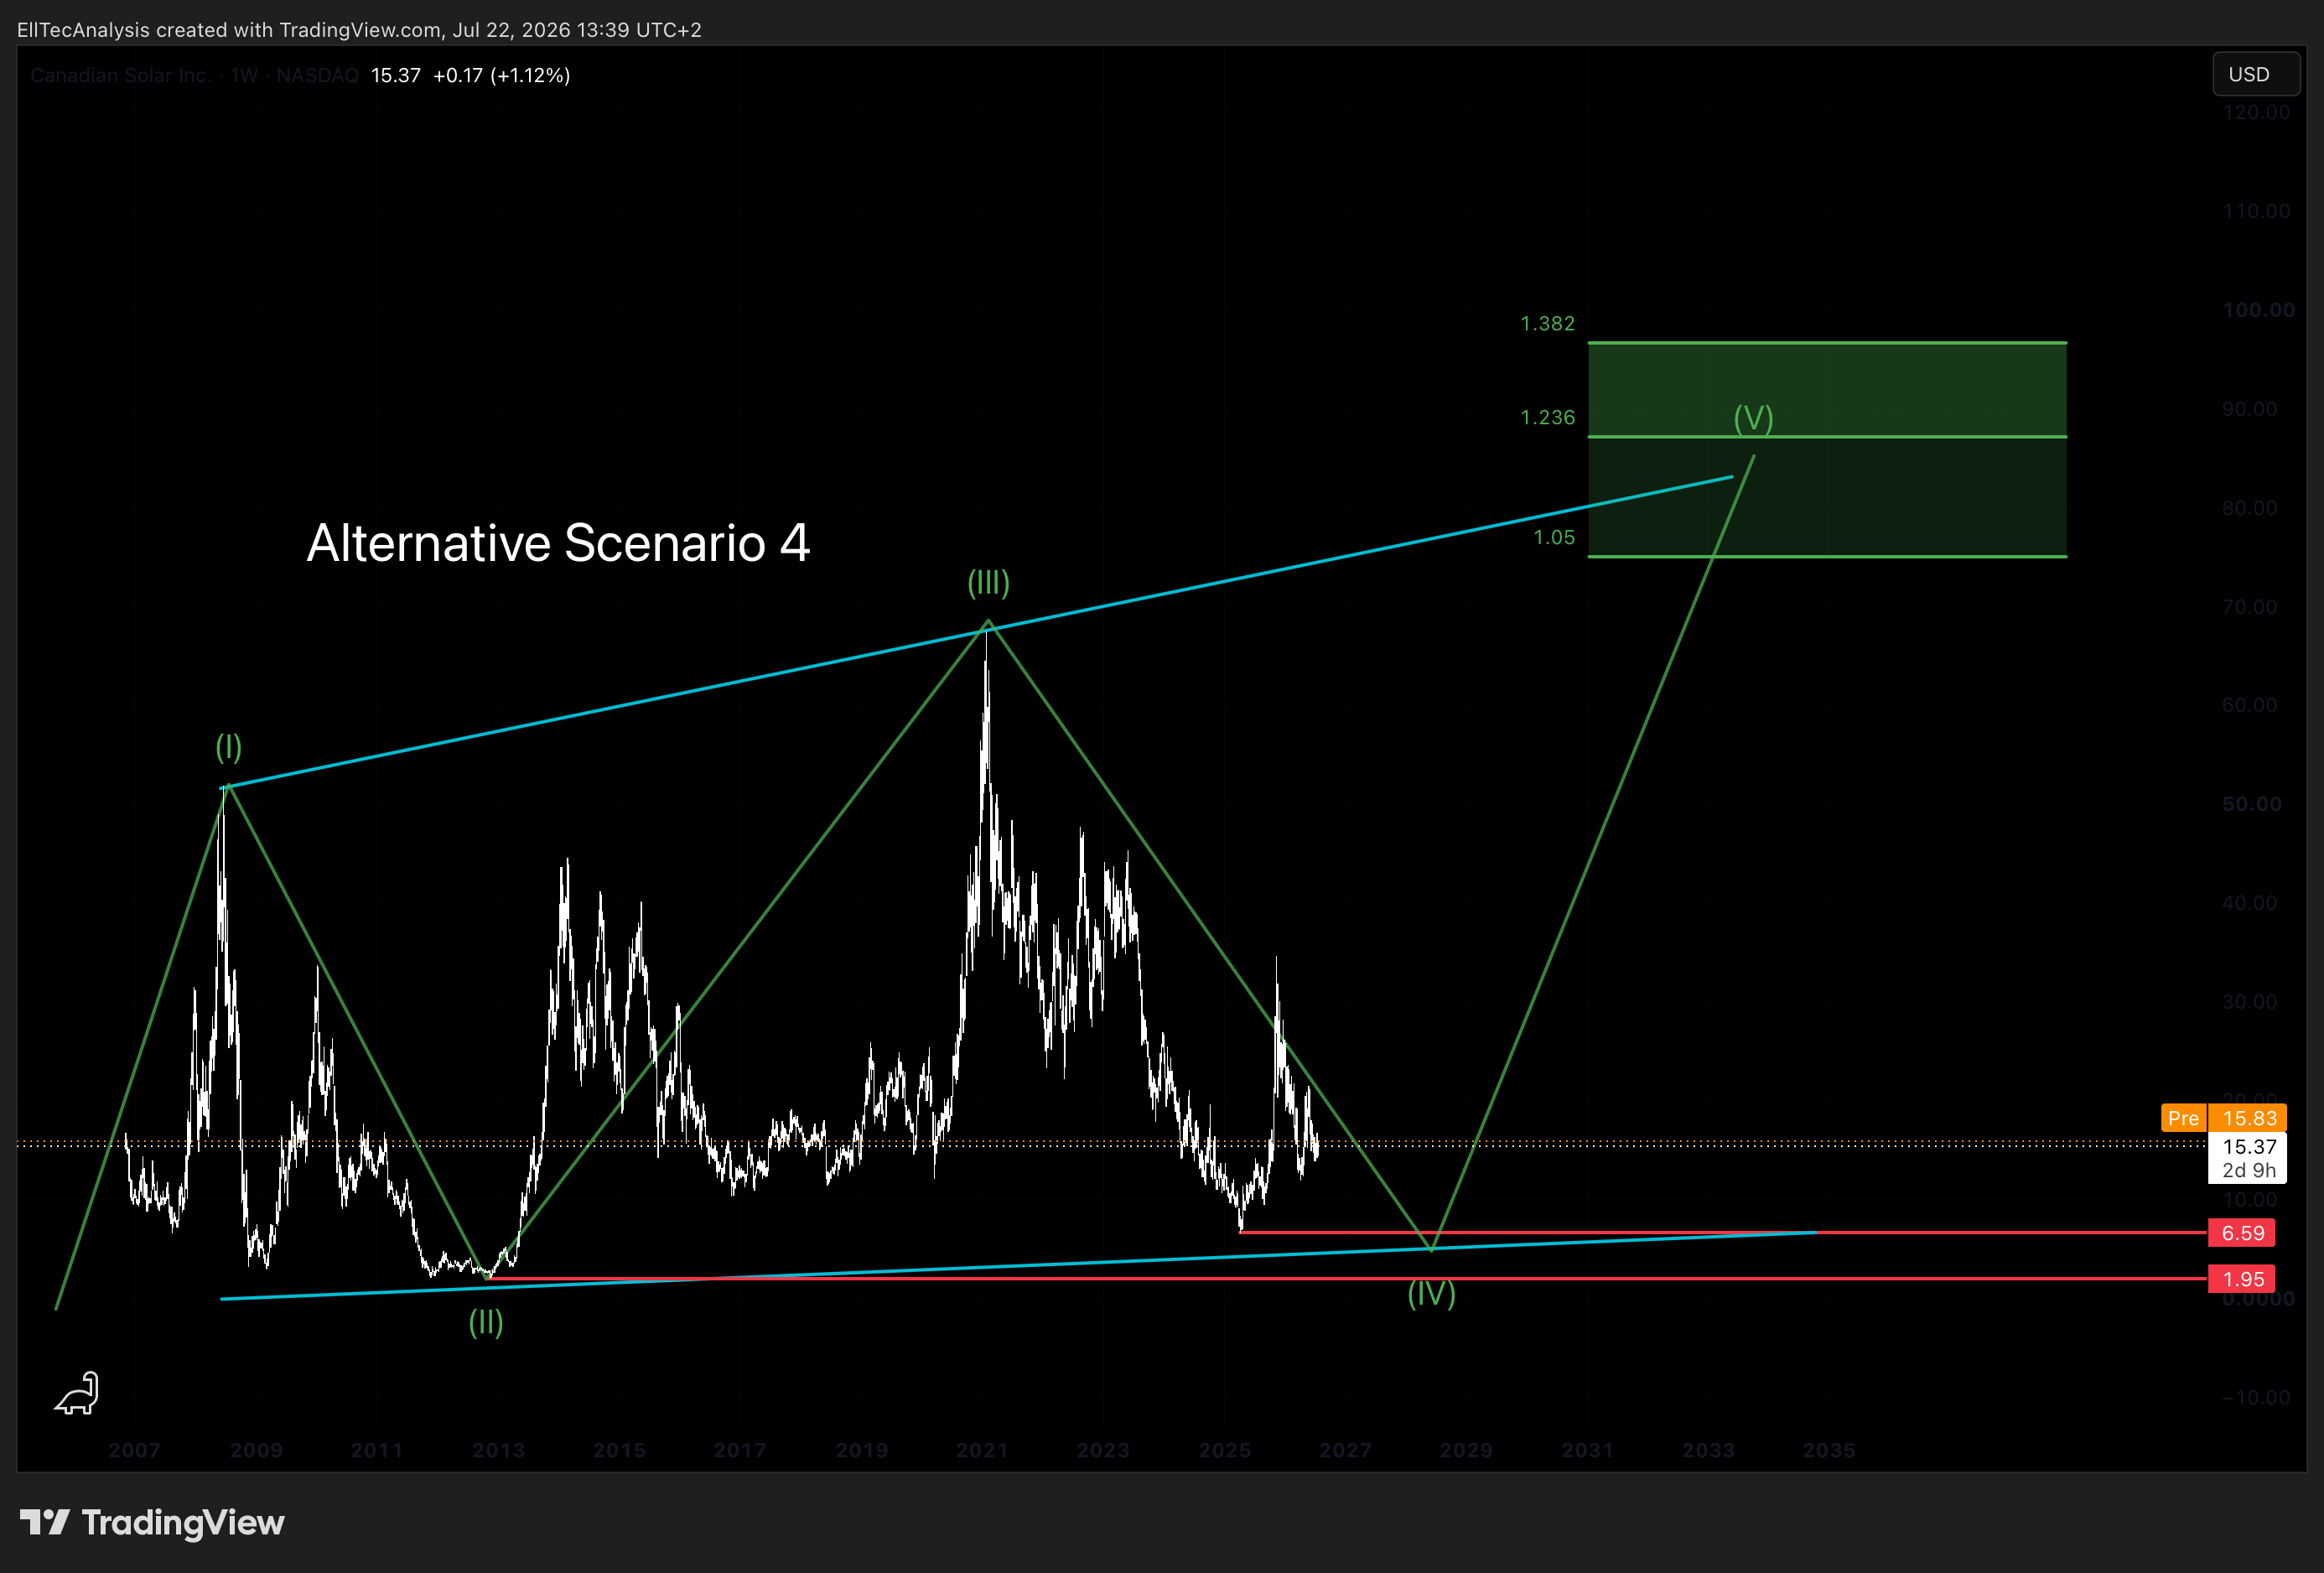
Because Elliott Wave analysis works in probabilities rather than certainties, and because the same price structure can occasionally be read in more than one internally consistent way, a professional wave count is never presented as the only possible outcome. It is accompanied from the outset by one or more alternate scenarios, probabilities for different alternative scenarios are evaluated by EllTec Analysis. Each alternative scenario is defined by a specific trigger level or event: a price point whose breach would invalidate the primary count and activate the alternate reading in its place. This is what turns wave analysis into a living framework rather than a fixed prediction. A reader always knows, before either outcome occurs, exactly what price action would confirm the primary thesis and exactly what price action would replace it with a different one.
Section 6: Potential Trade Planning, the “How”
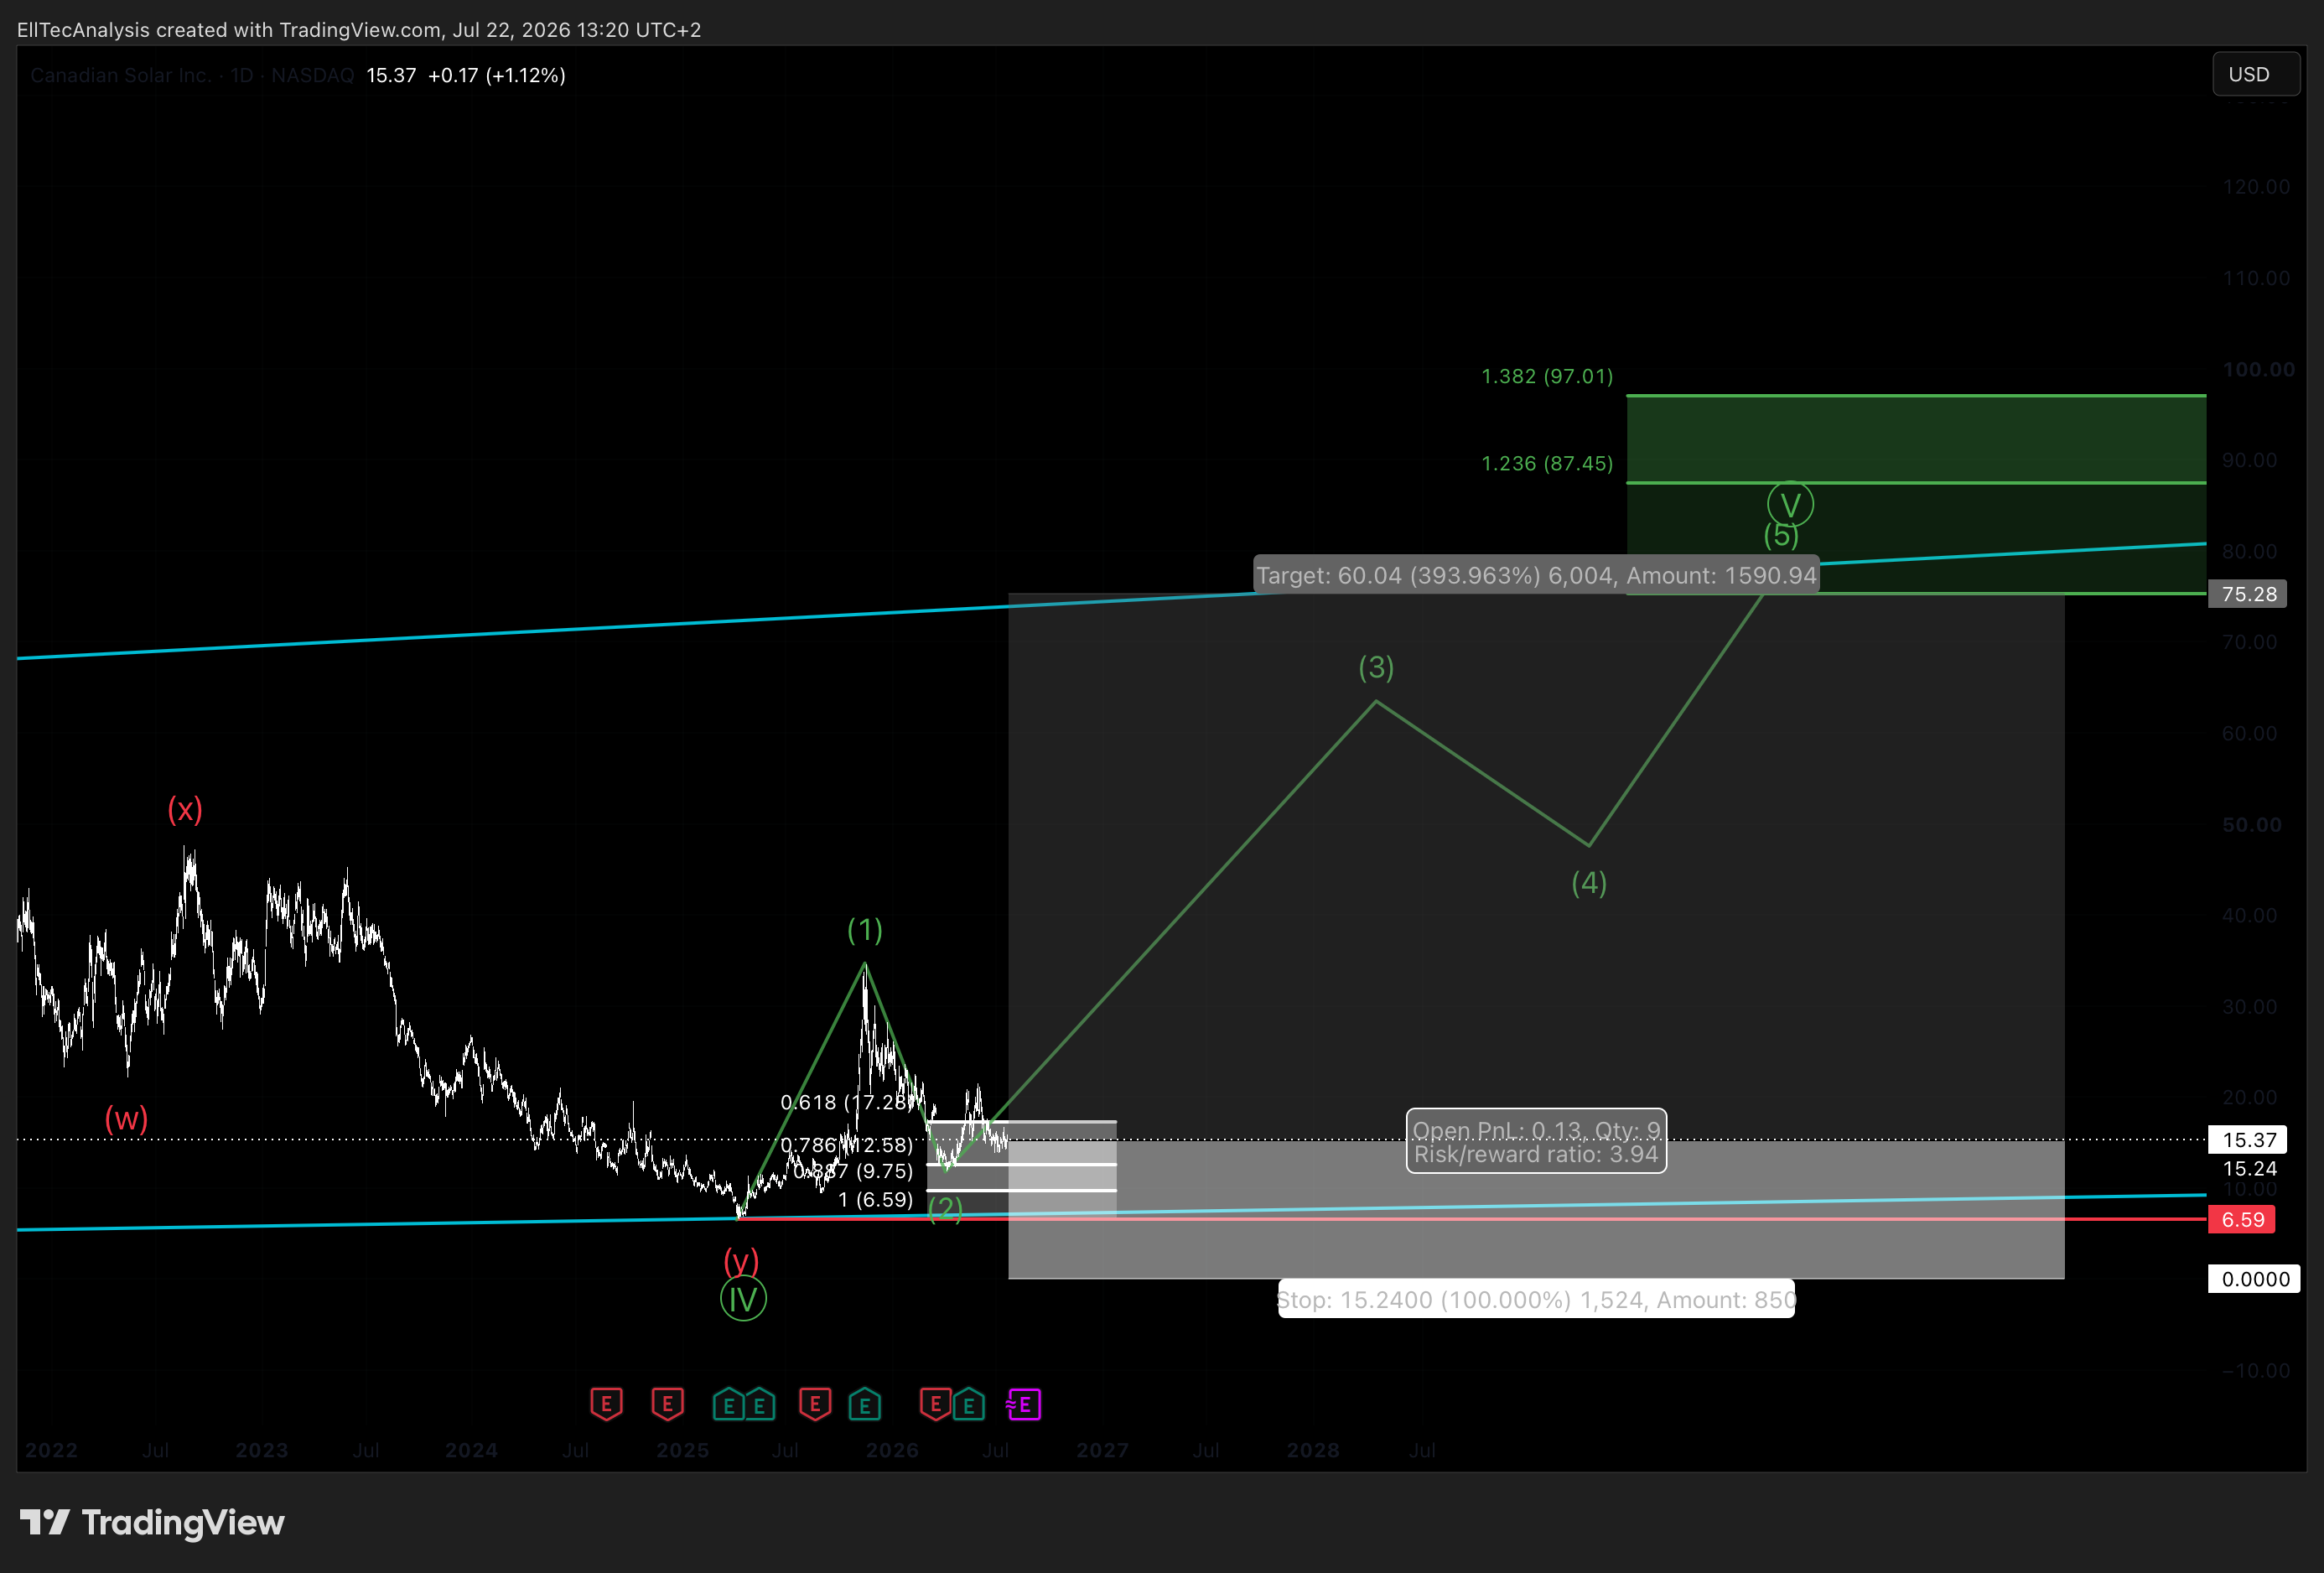
A wave count and a set of Fibonacci target zones are, on their own, an analytical map rather than an action plan. This section exists to convert that map into a structured, risk-defined framework covering where exposure might reasonably be built, where profit might reasonably be taken, and where the point sits at which the underlying thesis would be considered wrong.
Entries can be laddered or committed in a single tranche. Laddered entries reduces the risk of mistiming a single entry, since markets rarely respect a Fibonacci level to the exact tick, and it builds an average cost basis across the width of the golden zone instead of betting an entire position on one specific print.
Exit planning follows a staggered logic or one exit price. A partial realization at the first target zone locks in gains once a meaningful portion of the expected move has already played out, while a smaller remaining position is held toward the lower boundary of the terminal target zone, preserving exposure to a fuller extension without risking the whole position on that longer, less certain outcome.
Whether a stop-loss order is used, and where, is tied directly to the wave count’s own invalidation level rather than to an arbitrary percentage. Where EllTec chooses not to use a hard stop, it is typically because the position has already been built deep, where the defined invalidation point sits close enough that the risk is already structurally contained, and where a brief overshoot could otherwise close the position out of a move that goes on to complete as expected. Where a stop is used, its placement just beyond the invalidation level ties the trade’s maximum defined loss to the identical price level that would tell the analysis itself that the count is wrong, keeping risk management and structural analysis as one coherent decision rather than two separate ones.
Every potential trading plan, when possible, will be tracked in the EllTec Analysis tracking portfolio. Further insights are available for paid subscribers in EllTec Analysis paid subscribers chat.

Section 7: Risk Assessment, the “How Much”

The risk score, expressed on a 1 to 10 scale, gives a single comparable figure for how much structural and macro uncertainty surrounds a given idea, letting a reader calibrate position size without re-deriving that judgment from scratch for every report. A low score reflects a structurally clean wave count, a supportive fundamental backdrop, and few outside threats capable of invalidating the thesis beyond the wave count’s own invalidation level. A high score reflects some combination of structural ambiguity between competing counts, a deteriorating fundamental picture, thin liquidity, or elevated exposure to a specific external risk such as currency, regulatory, or geopolitical shocks. The risk factor table that accompanies the score breaks it down into its components, most commonly currency risk, liquidity risk, wave invalidation risk, and macro or geopolitical risk, so a reader can see exactly which factor is driving the overall number rather than treating it as a black box.
Sections 8 and 9: Conclusion and Disclaimer
The conclusion exists to tie fundamentals, correlations, seasonality, and the wave count back into a single thesis statement: where the asset currently stands structurally, what the macro backdrop supports, and what the expected multi-phase trajectory looks like if the primary scenario continues to unfold. It is written to stand on its own for a reader who wants the takeaway without walking through the full derivation.
Every report closes with the same disclaimer for a reason that goes beyond formality. Wave counts, Fibonacci zones, and trade plans describe probability distributions, not guarantees, and even a carefully constructed structural analysis remains a framework for thinking rather than a promise of an outcome. The disclaimer keeps that boundary explicit every single time, without exception.
How It All Connects
Fundamentals answer why an asset deserves attention in the first place. Correlations and seasonality place that asset inside its macro and cyclical context. The Elliott Wave and Fibonacci framework then answers the single most specific question in the whole report: where, precisely, price currently sits within its own structural cycle, translating that context into exact, falsifiable price zones rather than vague directional bias. Alternative scenarios keep the analysis honest about what would prove the primary reading wrong before it happens. The trade plan converts the surviving thesis into a concrete, staged action framework, and the risk assessment tells the reader how much conviction that framework deserves relative to everything else in a portfolio. None of these seven analytical layers carries much weight in isolation. The discipline, and the reason behind EllTec Analysis’s own tagline, Market Structure Clearly Explained, lies in reading all seven as a single connected argument rather than as seven separate opinions loosely stapled together.
DISCLAIMER
This article is for informational and educational purposes only and does not constitute financial advice. It describes the methodology EllTec Analysis applies across its reports and is not an analysis of any specific asset. Markets involve risk, and past performance is not indicative of future results. Please do your own research or consult a licensed advisor. EllTec Analysis assumes no liability for decisions based on this content.
Any questions left?