

Elliott Wave Framework, Target Zones & Correlation-Based Market Structure
How EllTec Analysis uses technical analysis

Introduction
At EllTec Analysis, Elliott Wave Theory is used as a structured framework to interpret market behavior, not as a subjective forecasting tool. The approach is based on the assumption that financial markets move in repeating psychological cycles that can be mapped, structured, and validated through objective rules.
However, Elliott Wave structure alone is never sufficient. It is always combined with Fibonacci-based target zones, intermarket correlation analysis, and index structure confirmation to reduce subjectivity and improve statistical consistency.
The core principle is:
Markets are not predicted — they are structured into probability-based scenarios.
1. Elliott Wave Theory as Market Structure
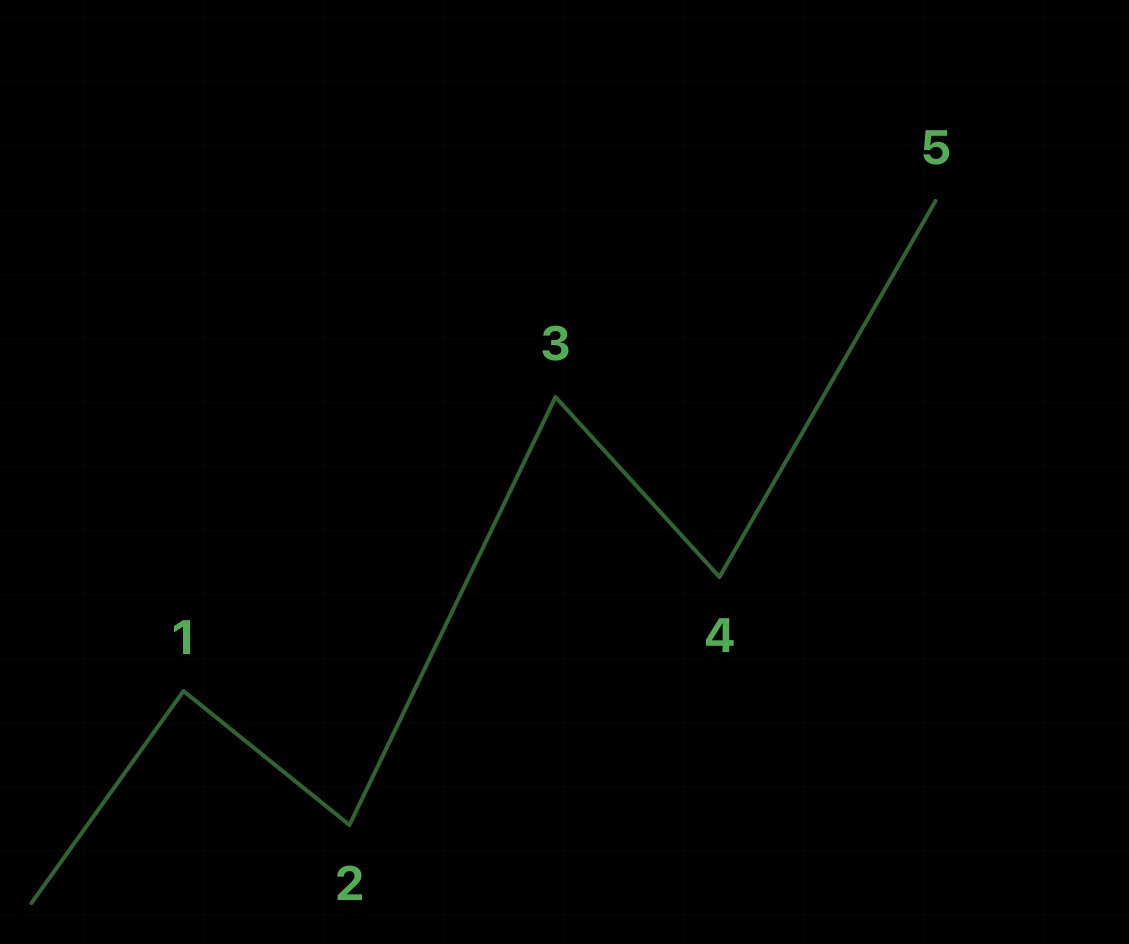
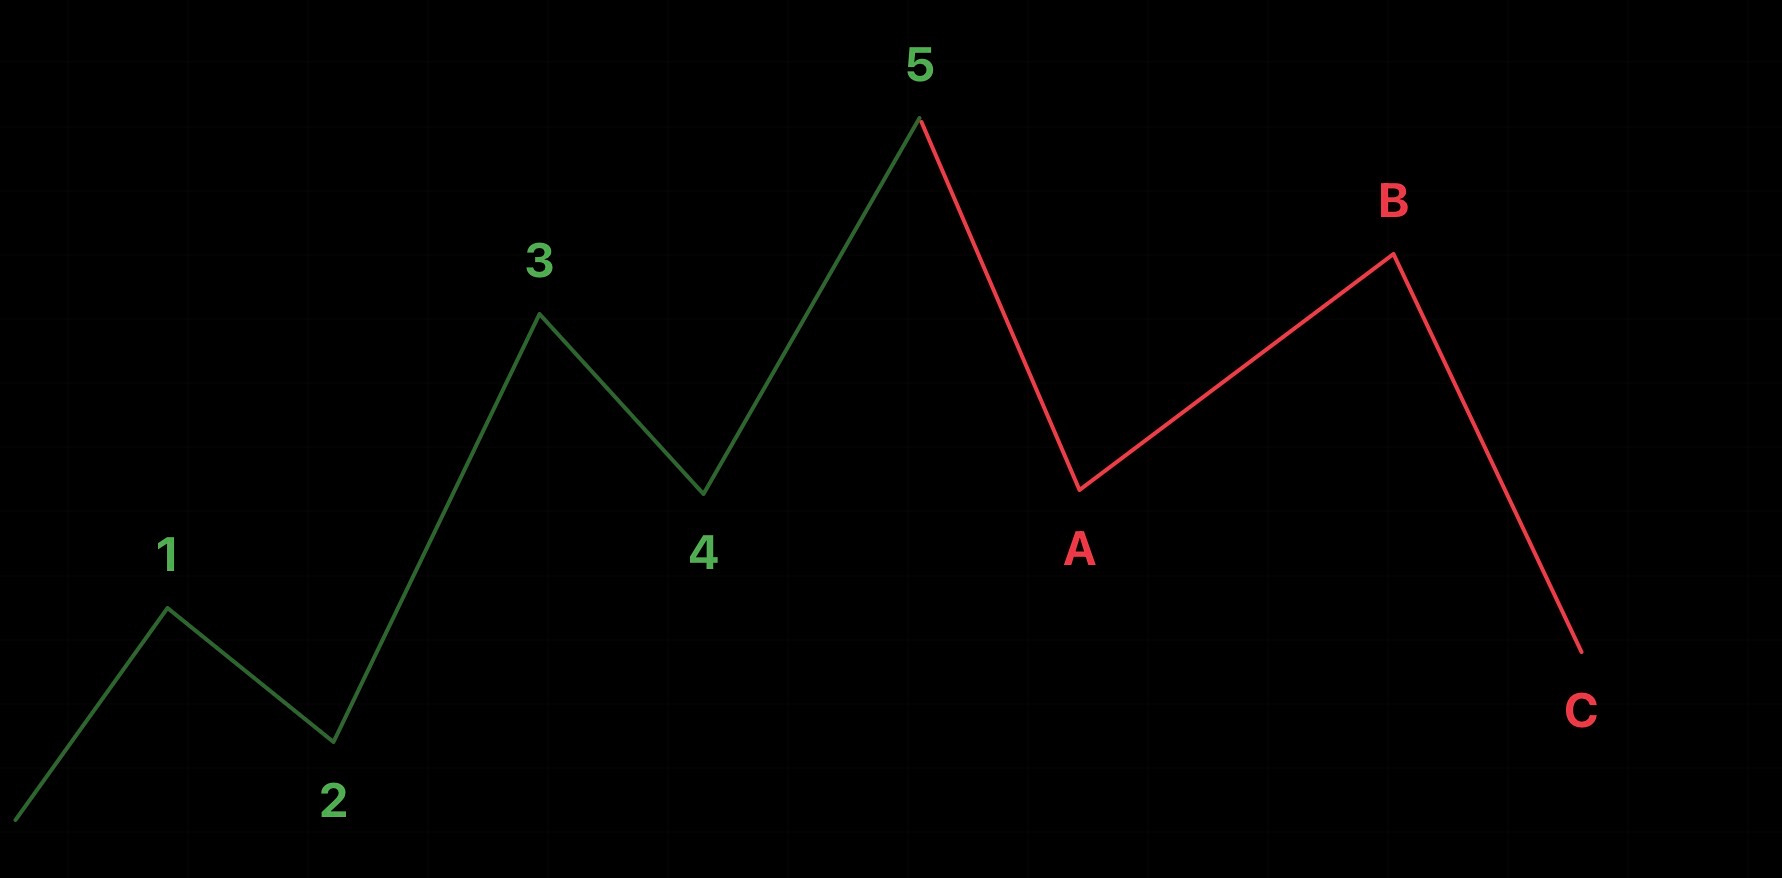
Elliott Wave Theory describes market movement as a fractal sequence of:
Impulse waves (1–2–3–4–5): directional expansion phases
Corrective waves (A–B–C): counter-trend consolidation phases
Each wave reflects shifts in sentiment, liquidity, and positioning.
2. Structured Elliott Wave Methodology
Step 1: Macro Market Context
Before any wave interpretation, the broader environment is defined:
Long-term trend direction (Monthly / Weekly structure)
Market cycle phase (accumulation, expansion, distribution, decline)
Liquidity conditions and risk sentiment
Index-wide structural alignment
Only when macro structure is clearly defined is lower timeframe analysis performed.
Step 2: Impulse Structure Identification (1–2–3–4–5)
An impulse wave is only considered valid if strict structural conditions are met:
Core Rules:
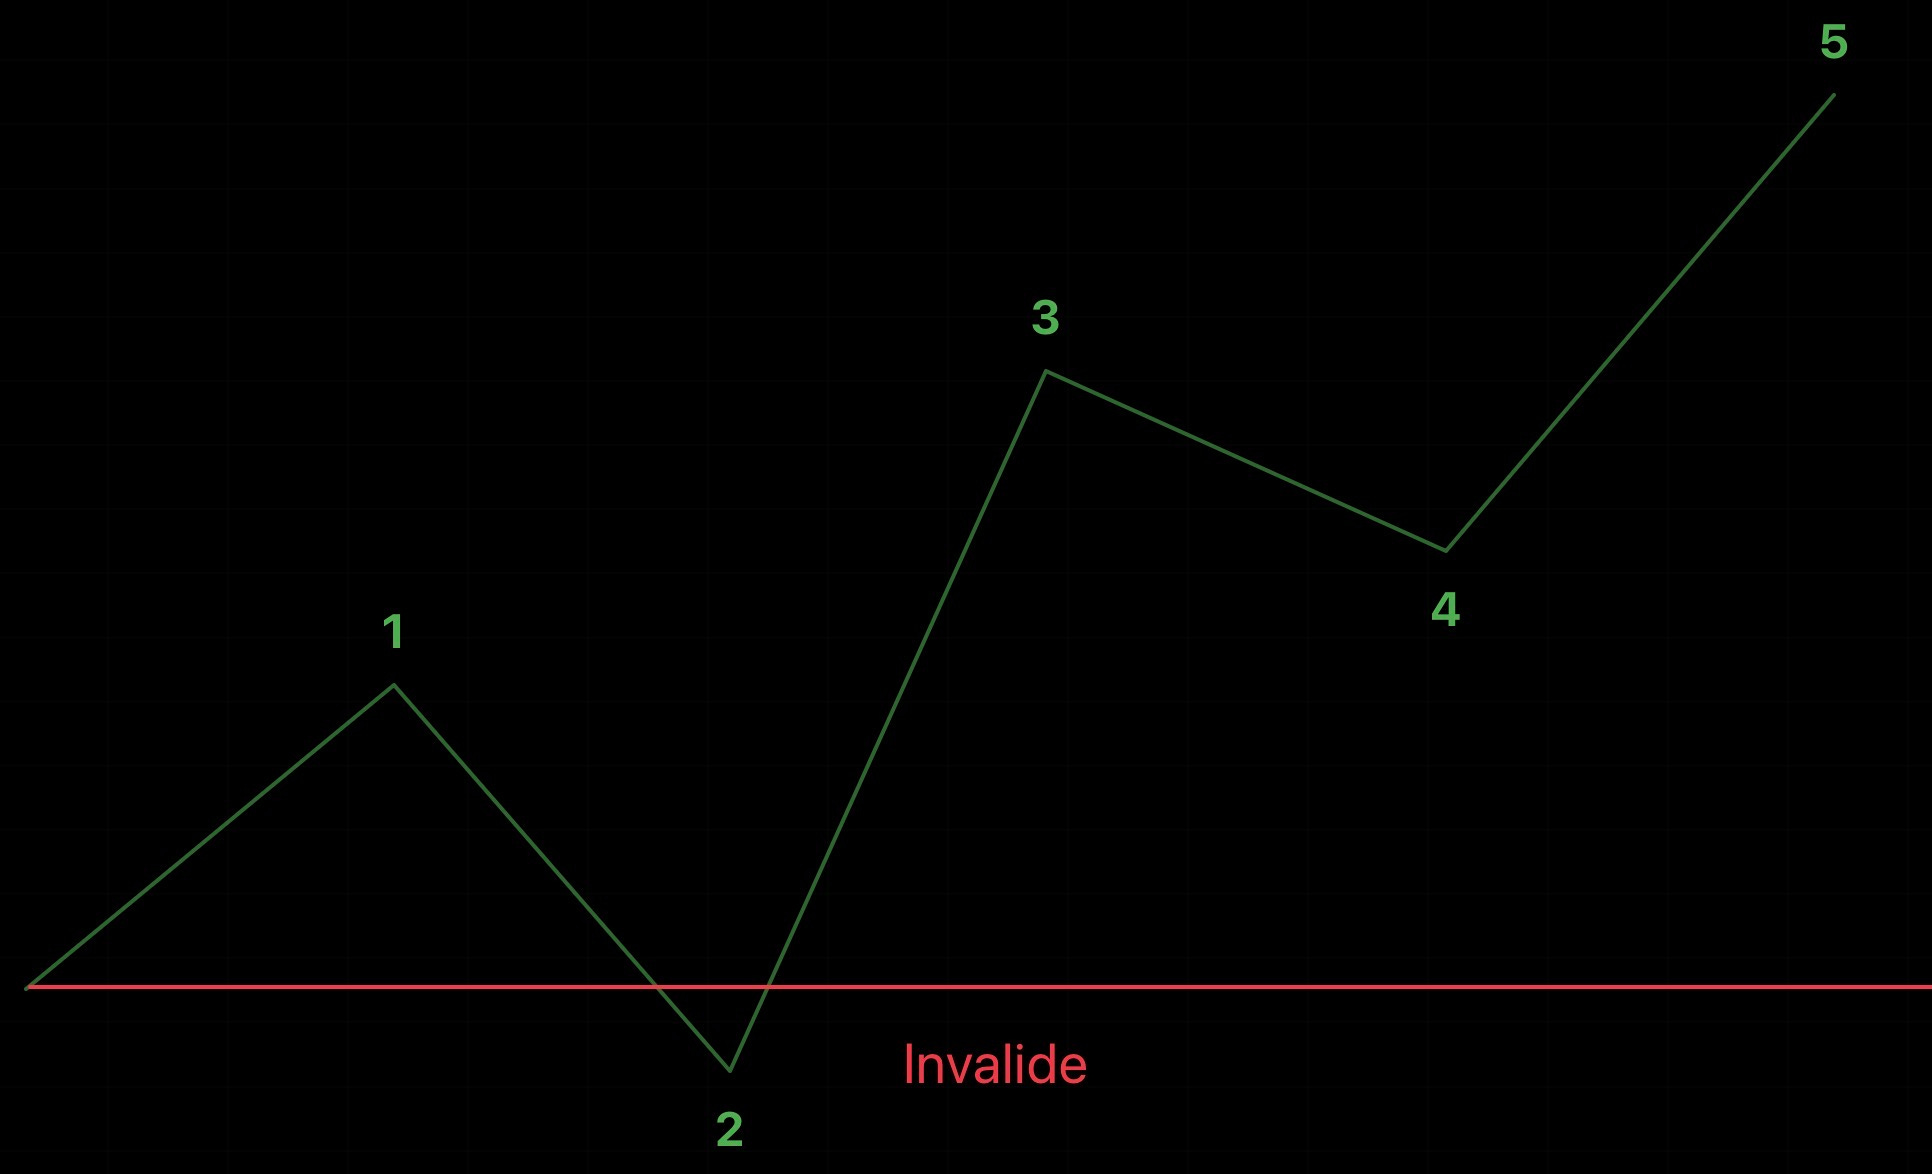
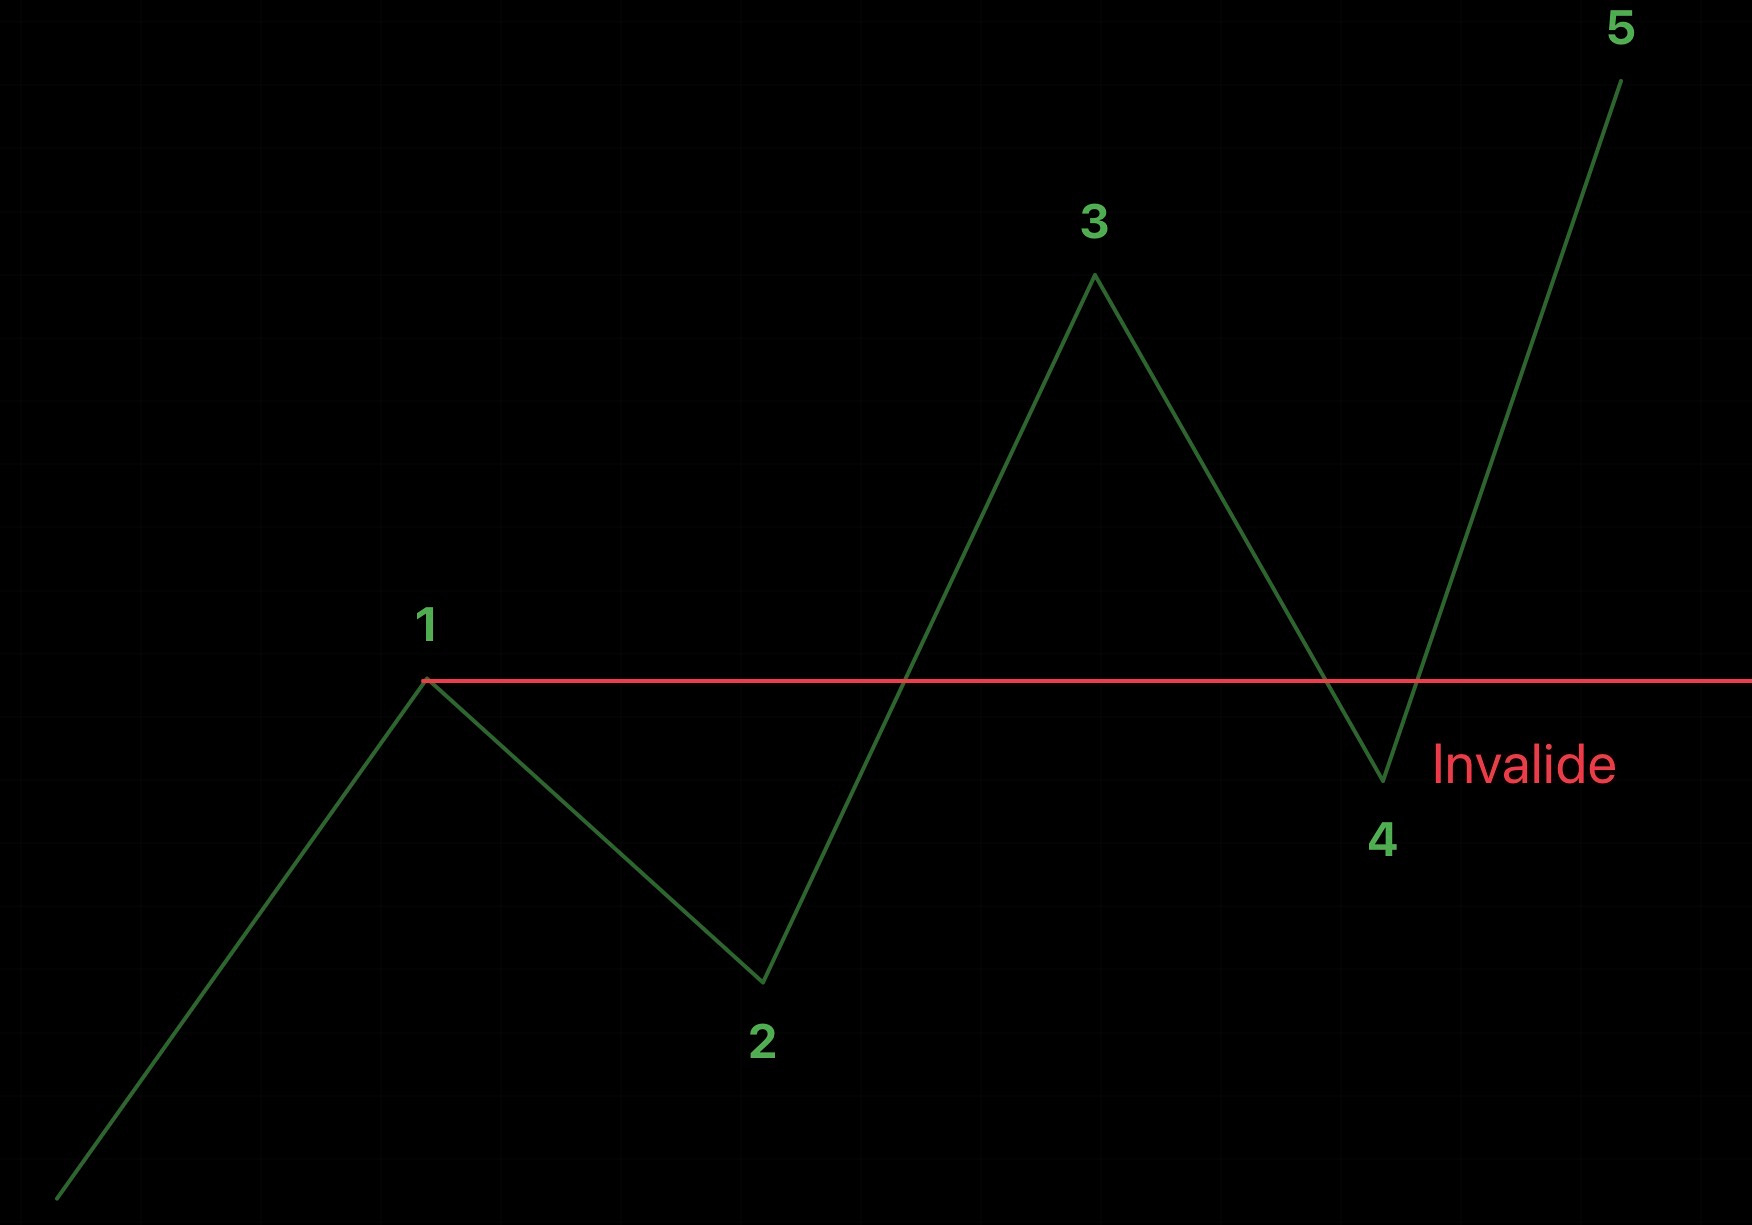
Wave 2 never retraces beyond the start of Wave 1
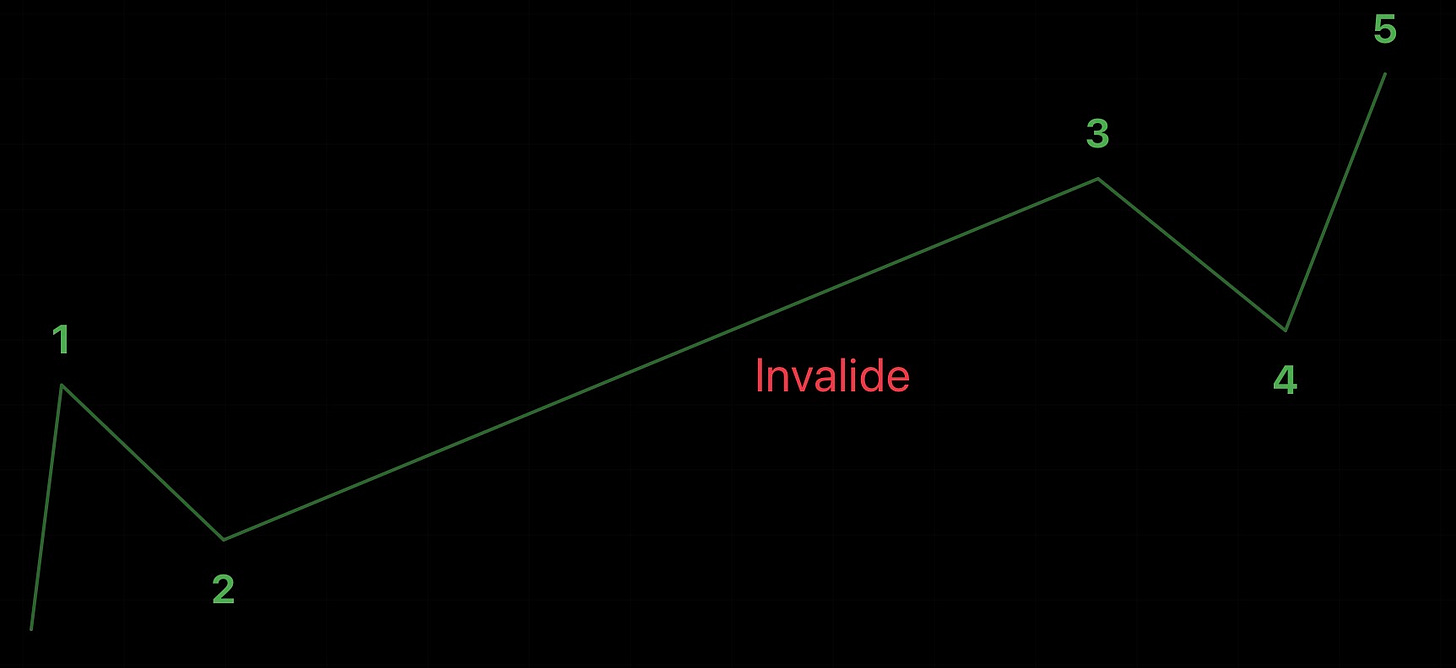
Wave 3 is never the shortest wave and is typically the strongest expansion
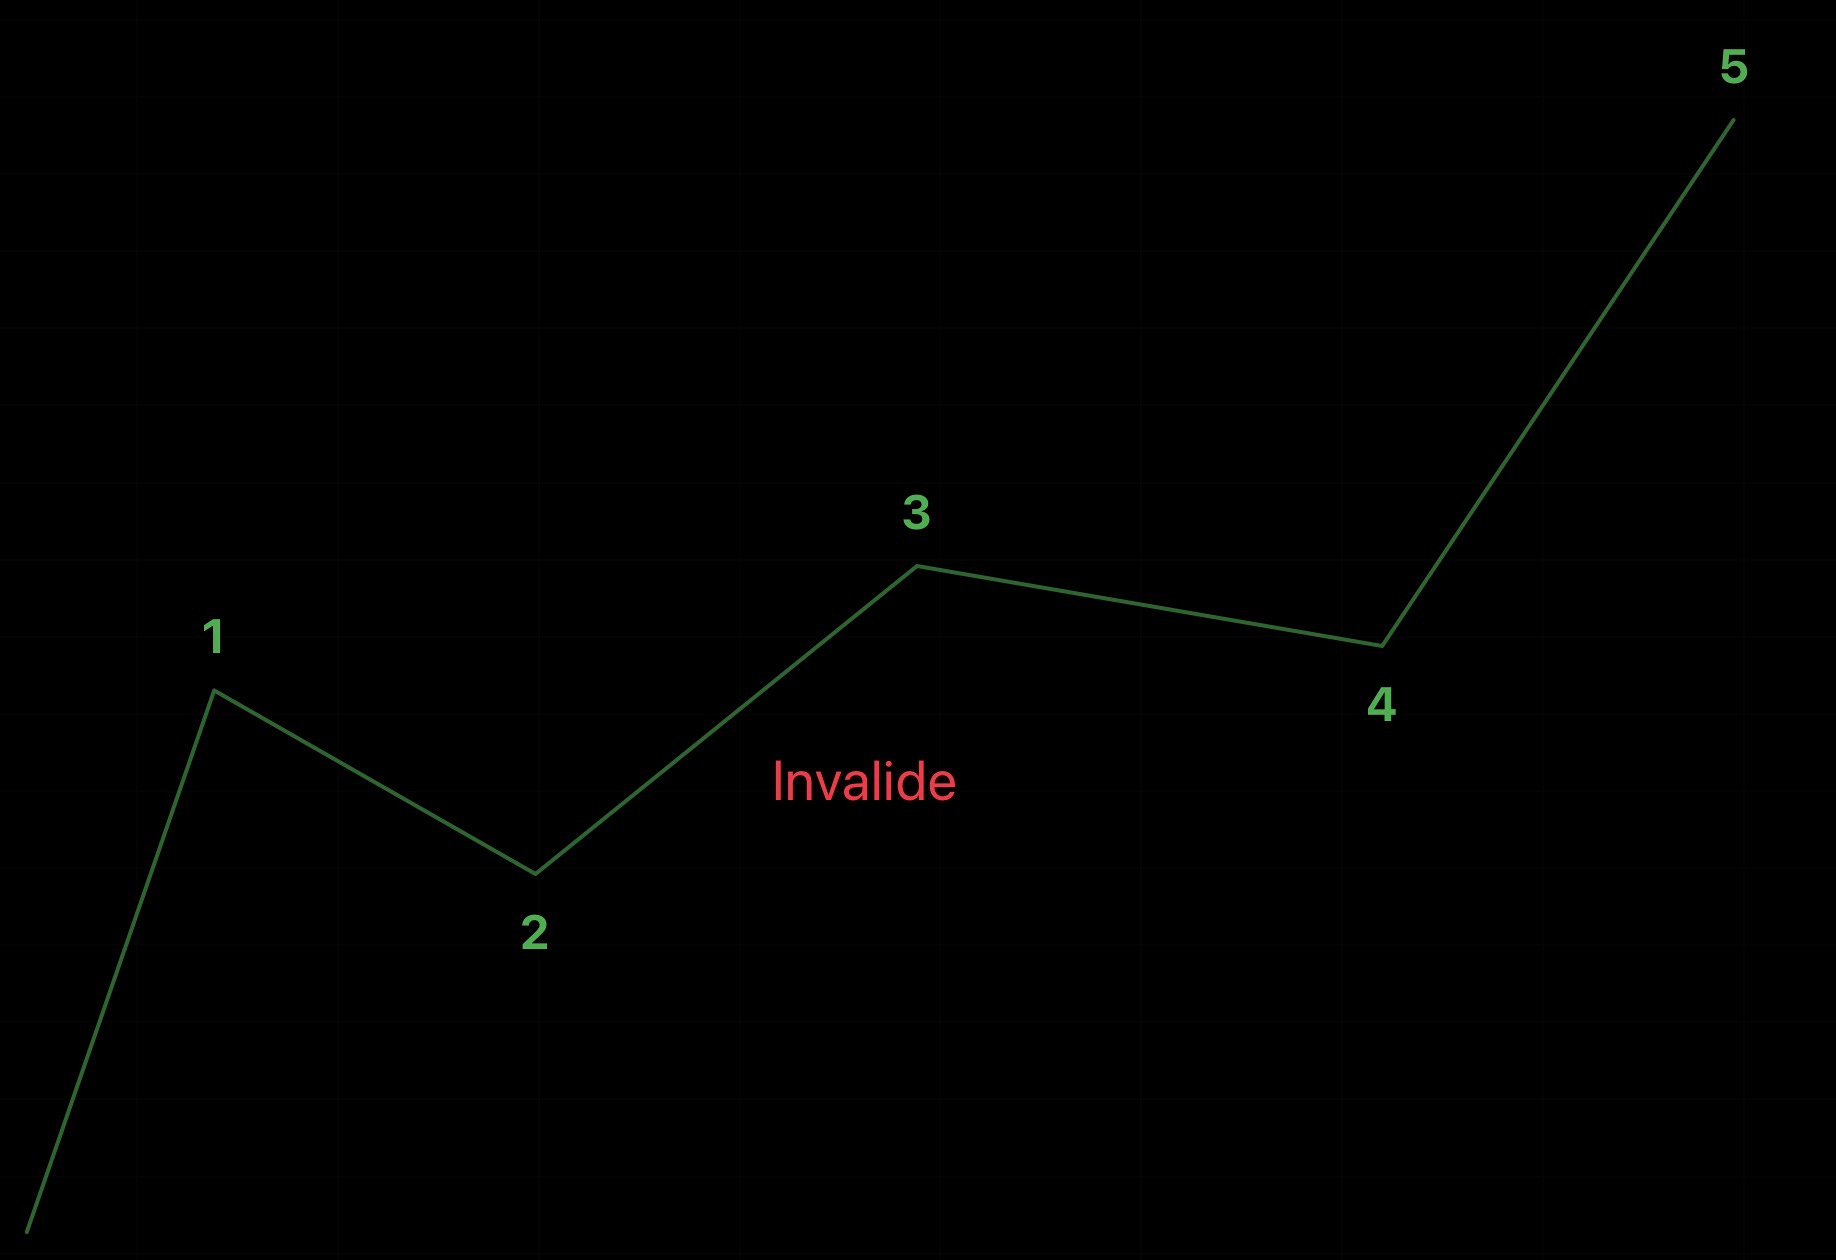
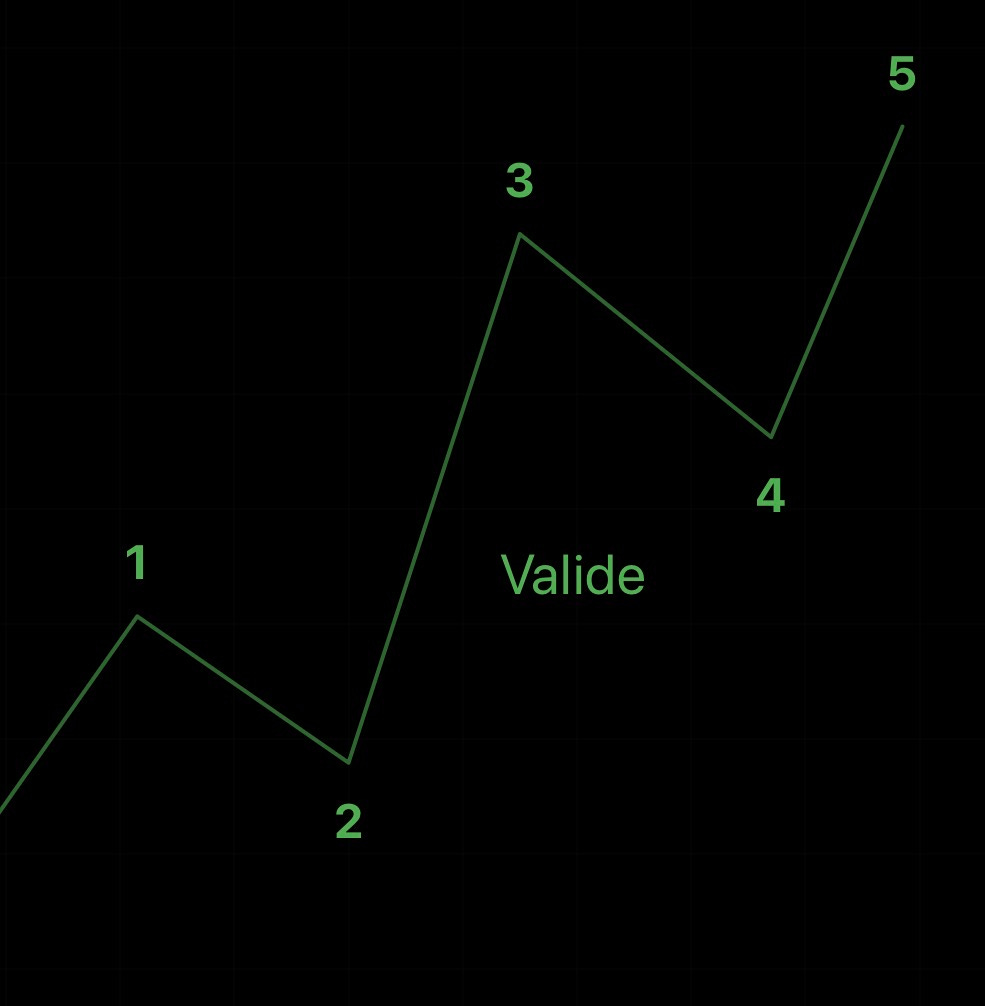
Wave 4 does not overlap Wave 1 in standard market conditions
Wave 3 shows clear momentum and volume expansion
Grafic source: TradingView
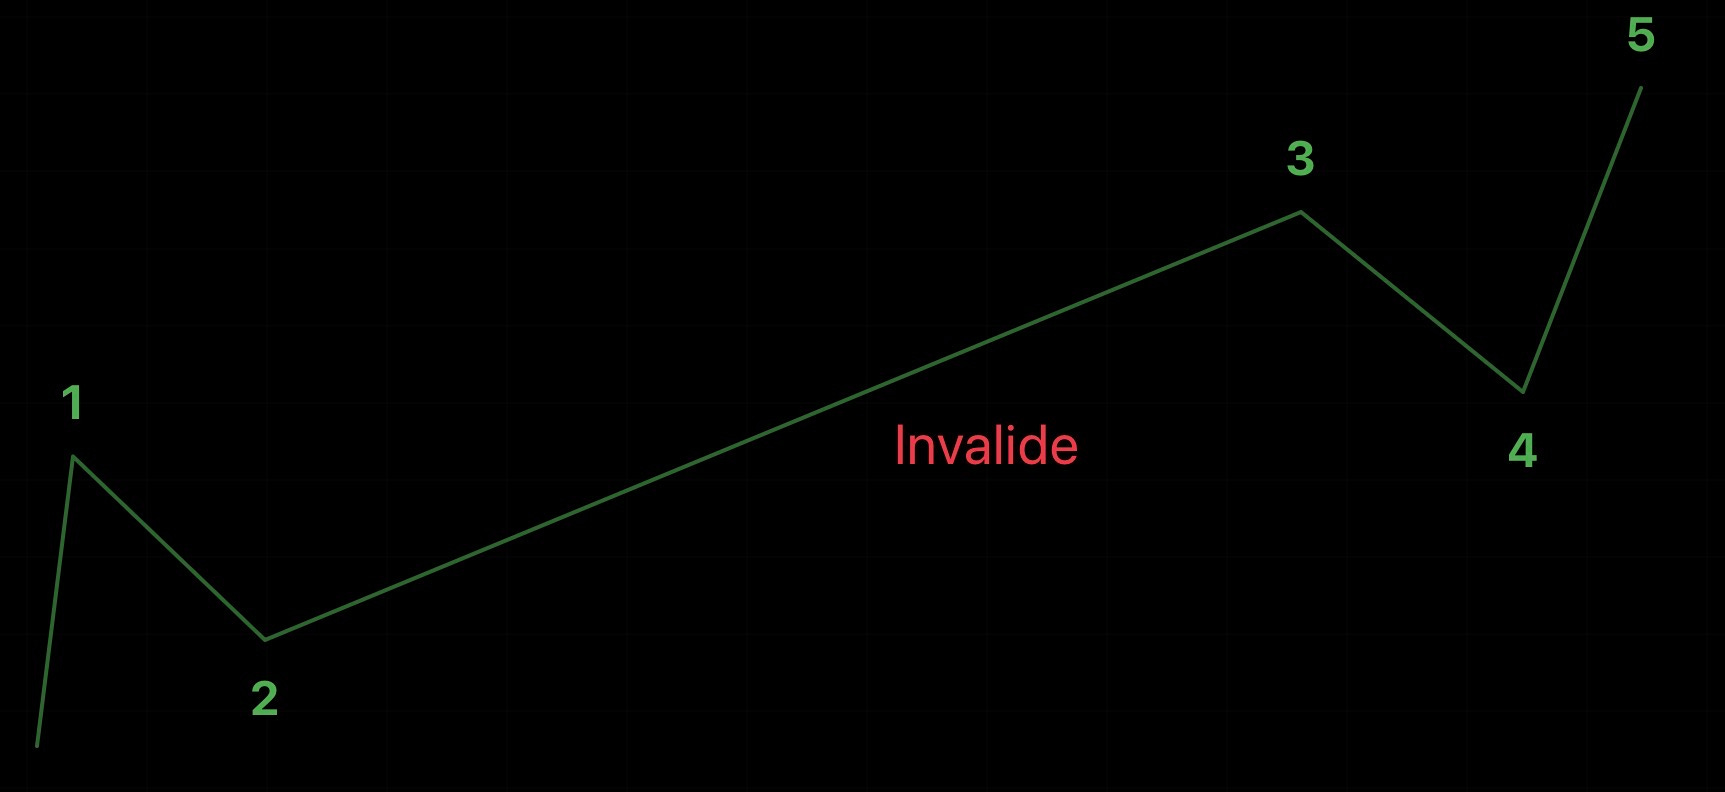
If any rule is violated, the structure is invalidated immediately. This prevents forced or random wave counts.
Step 3: Corrective Structures (A–B–C)
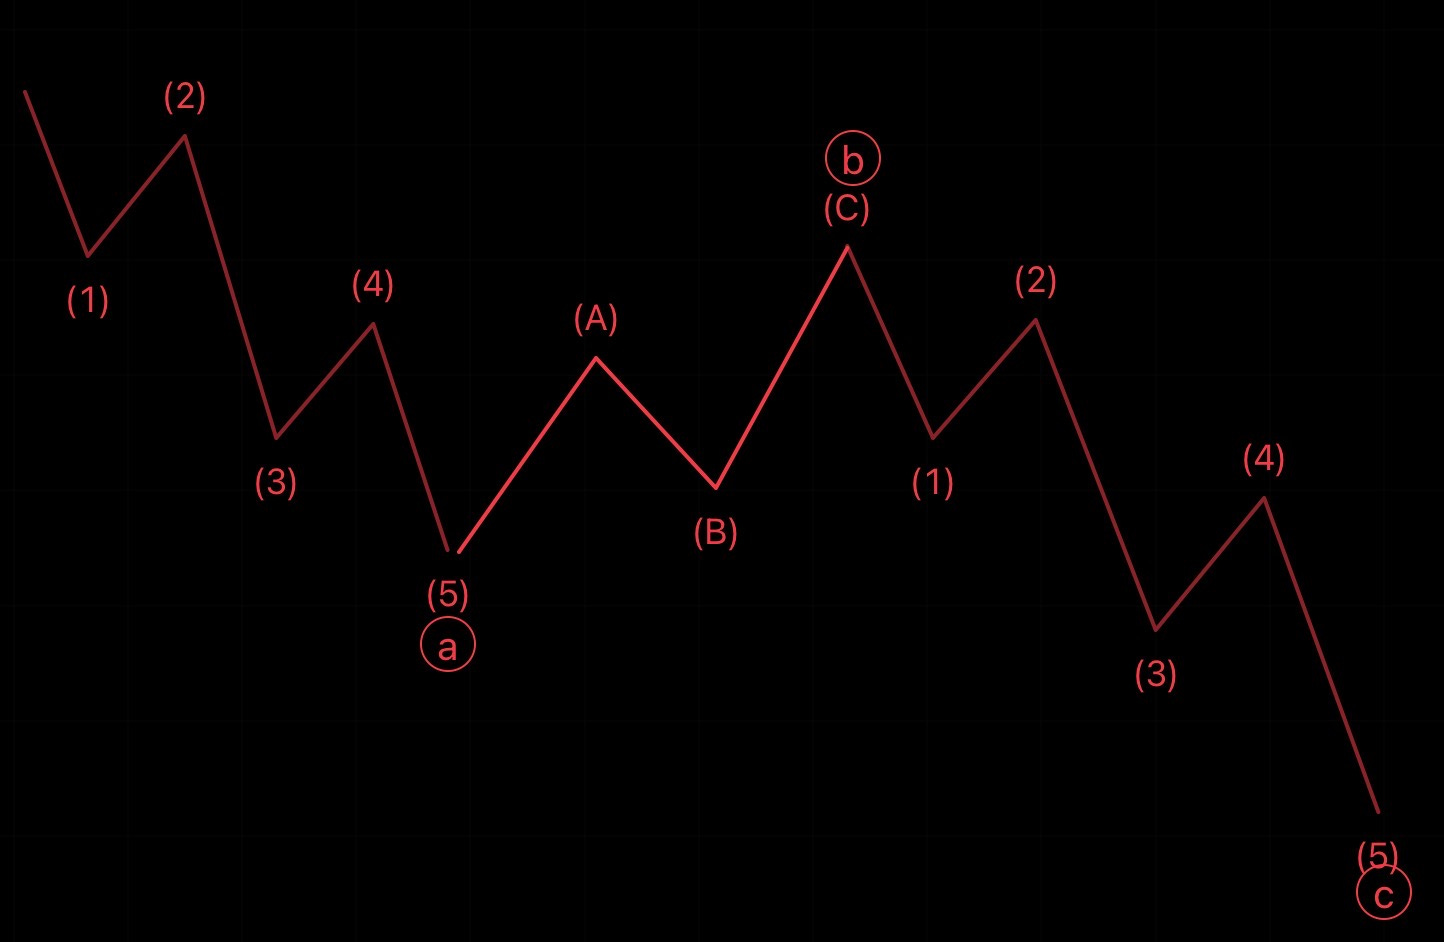
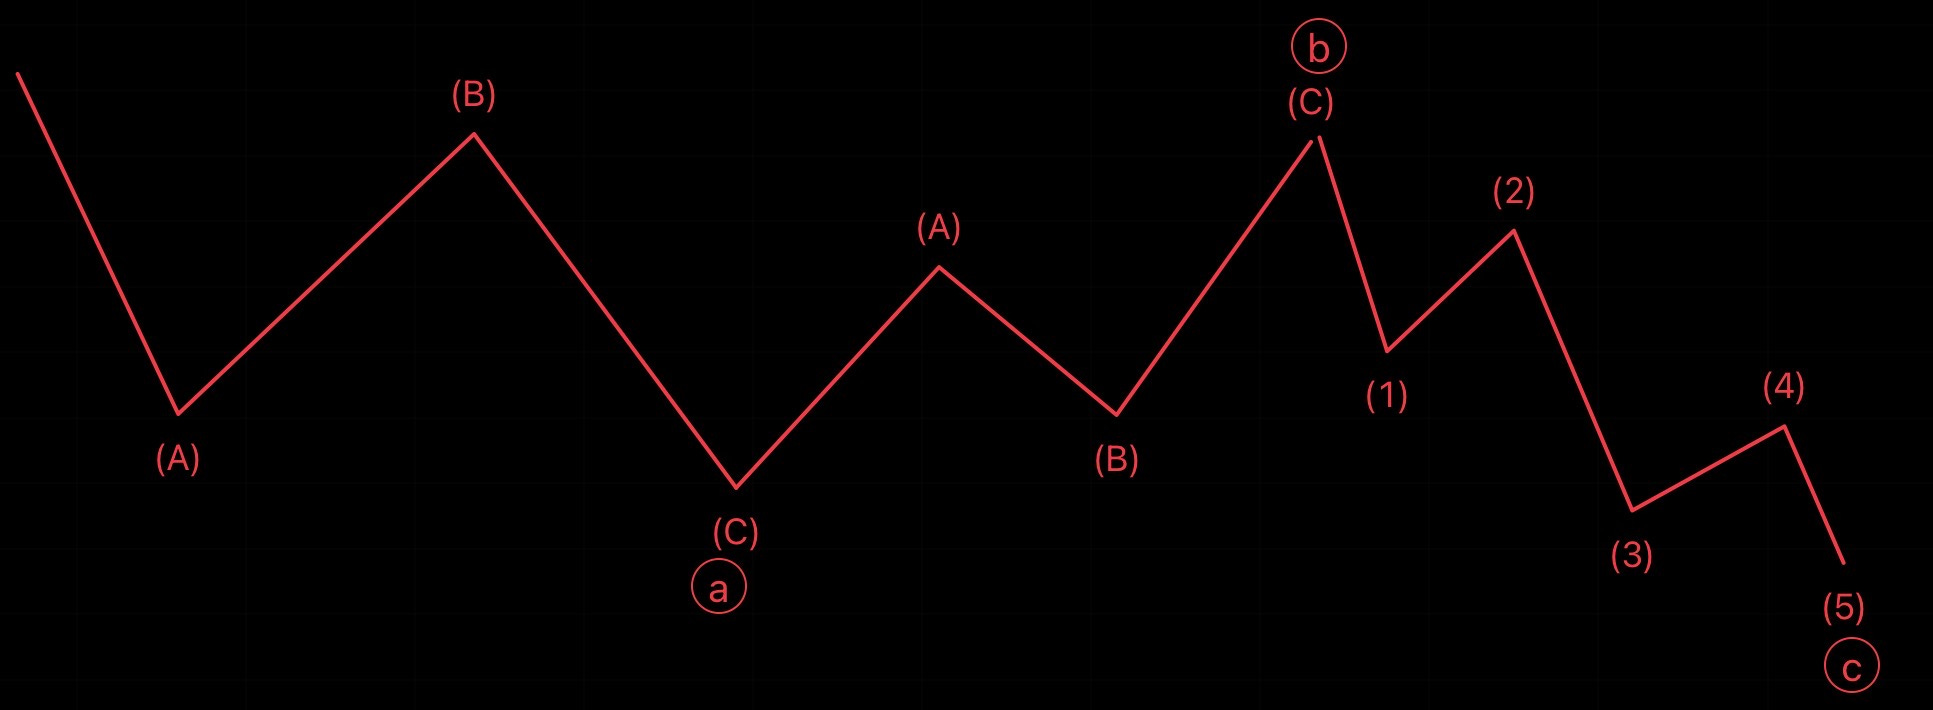
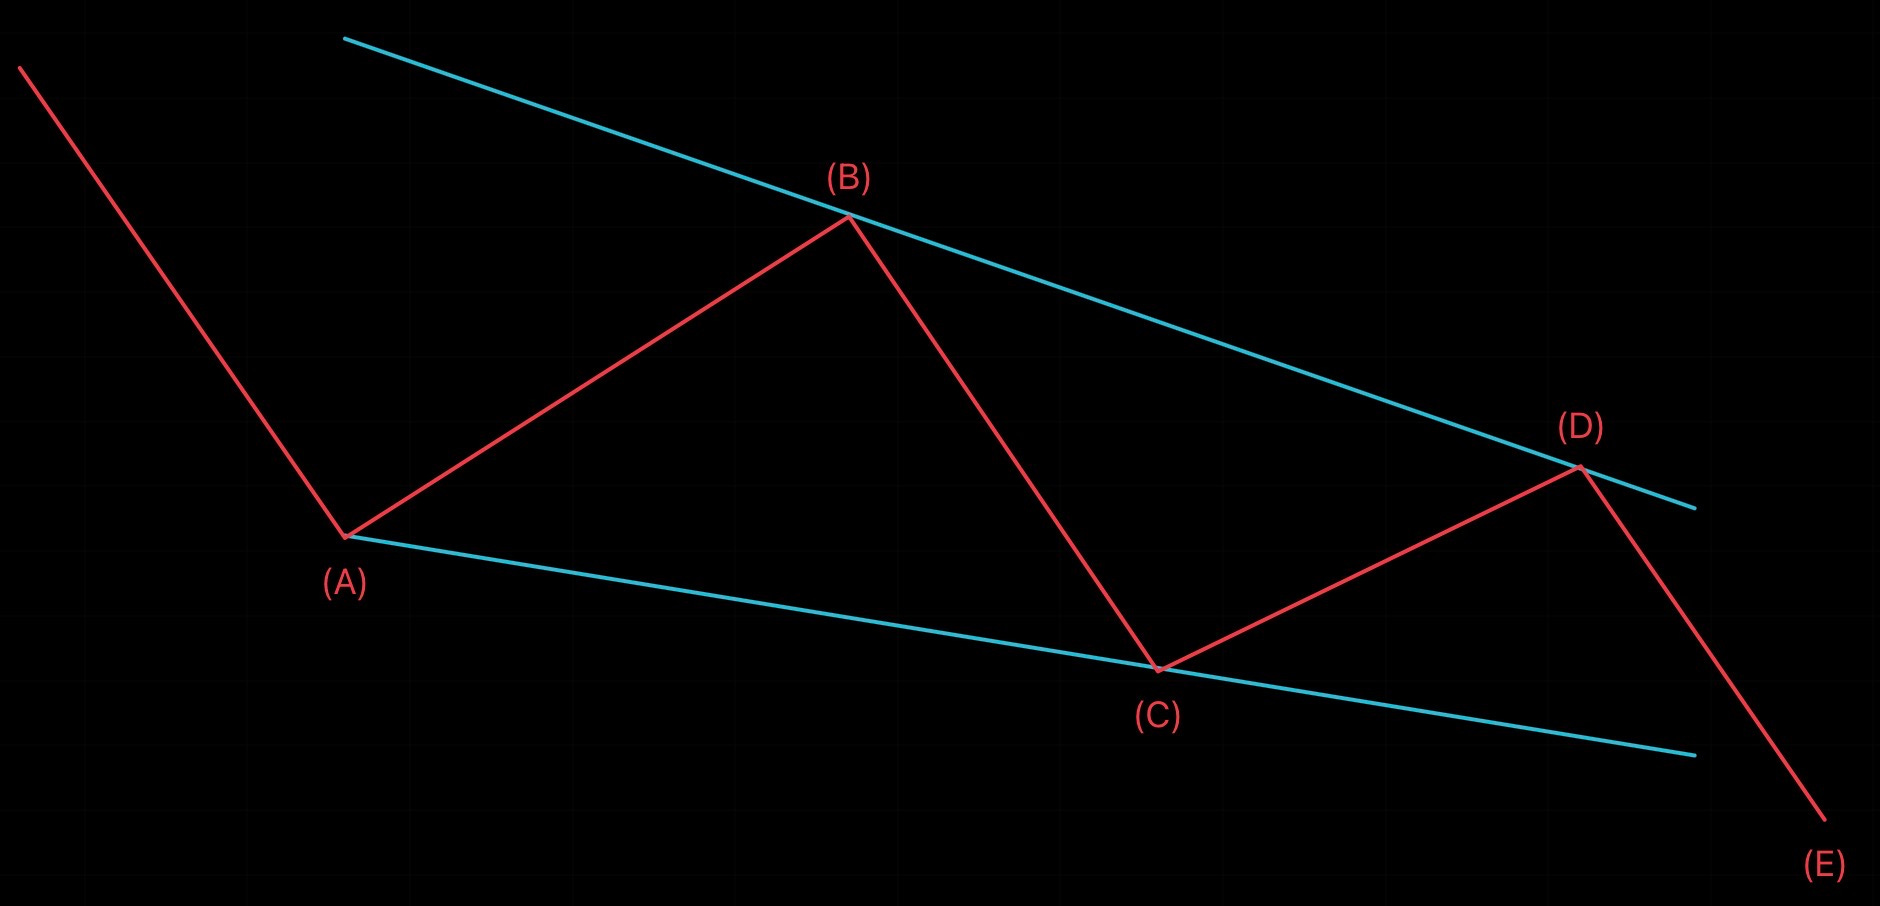
Corrective phases are classified into three primary structures:
Zigzag: sharp directional correction
Flat: sideways consolidation
Triangle: contracting volatility structure
Each structure defines:
expected retracement depth
time duration
continuation vs reversal probability
Corrections are classified, not assumed.
3. Fibonacci-Based Target Zone Modeling
Fibonacci levels are used as structural projection tools, not as standalone signals. They define probability zones based on wave relationships.
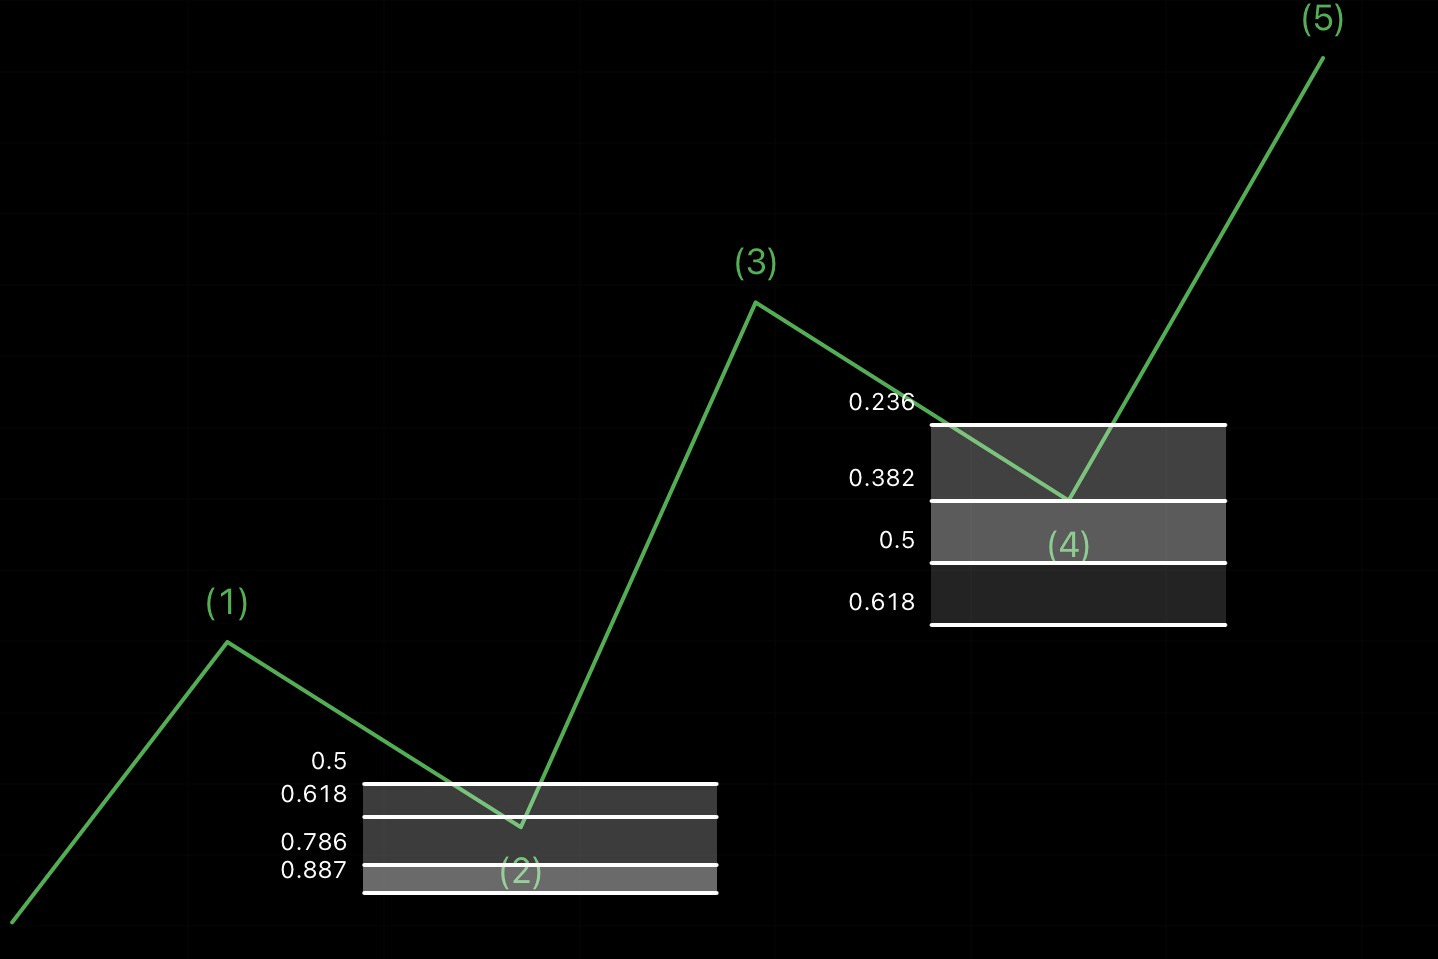
Wave 2 Target Zones
Wave 2 is typically the biggest correction phase.
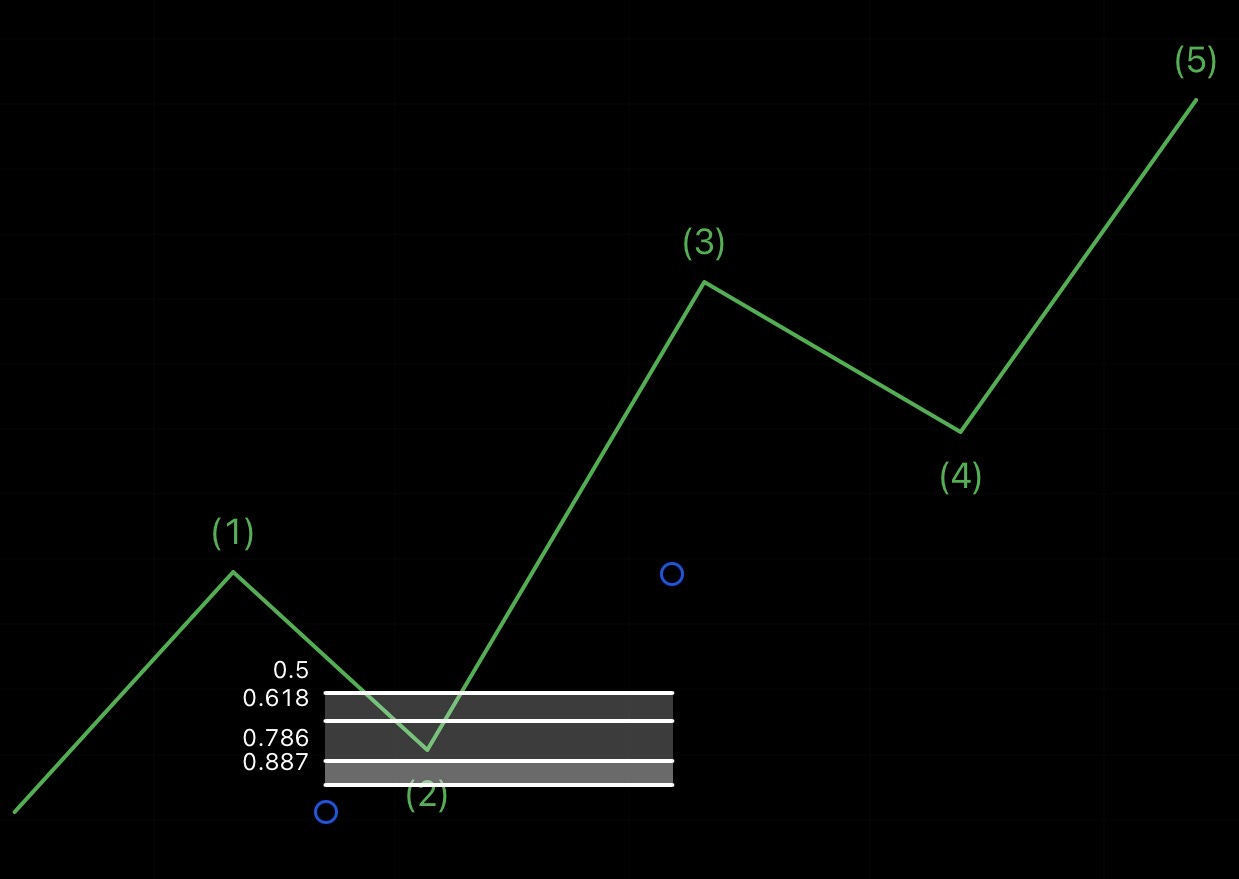
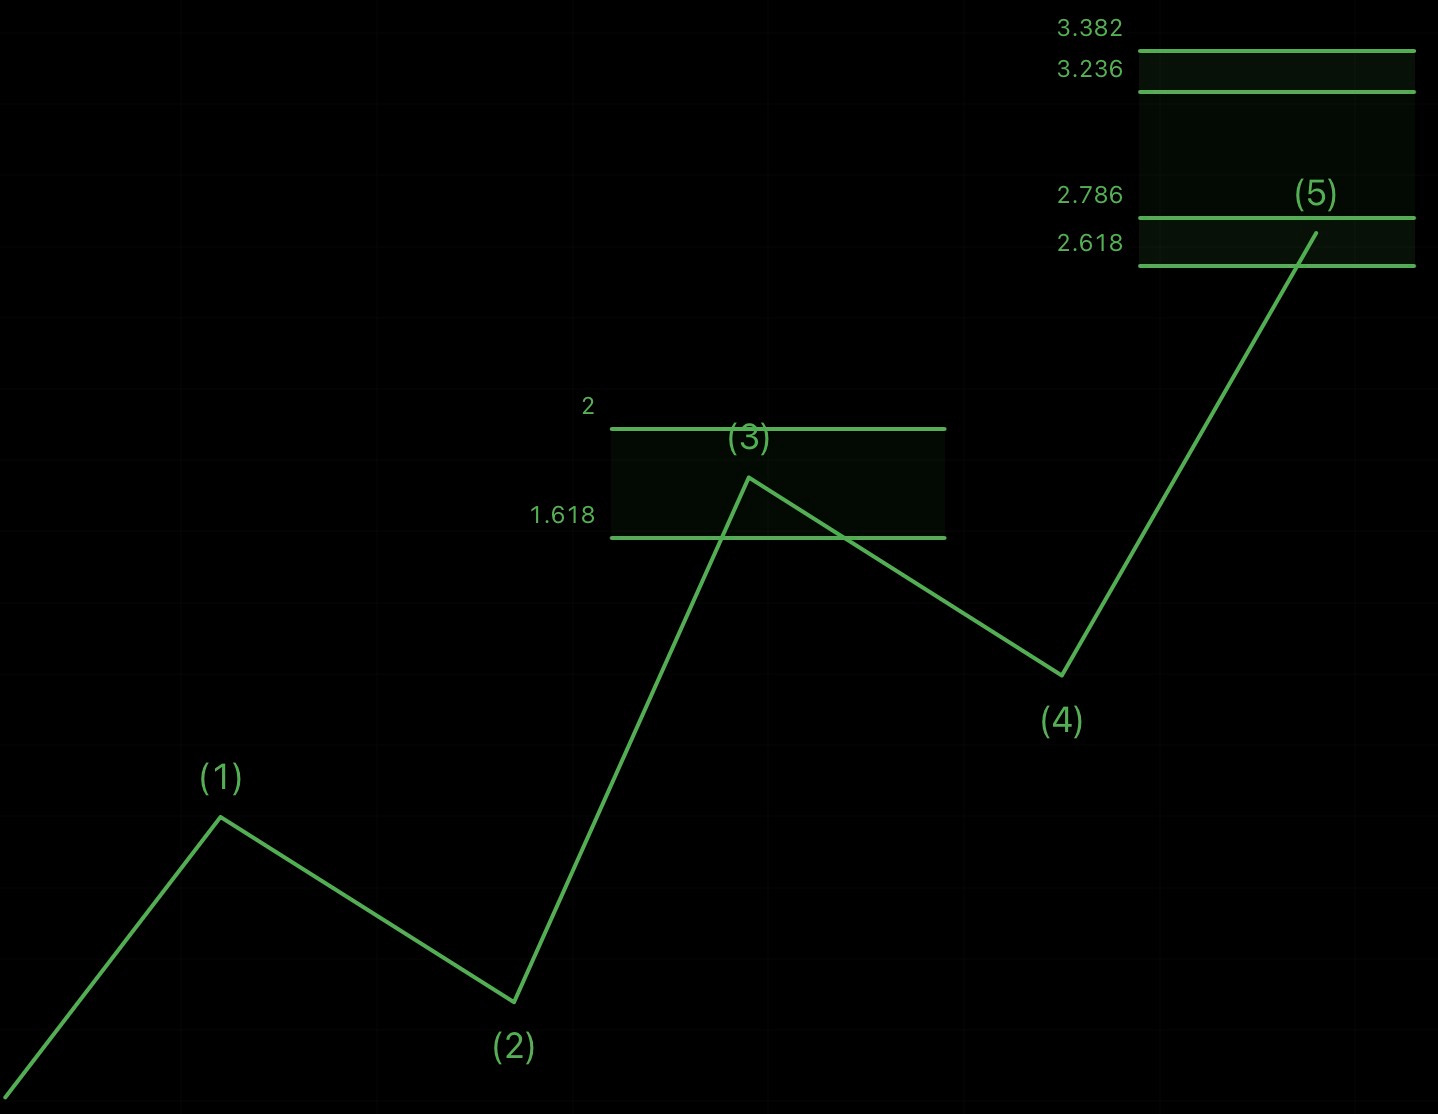
Wave 3 Target Zones
Wave 3 is typically the strongest expansion phase.
Projected zones:
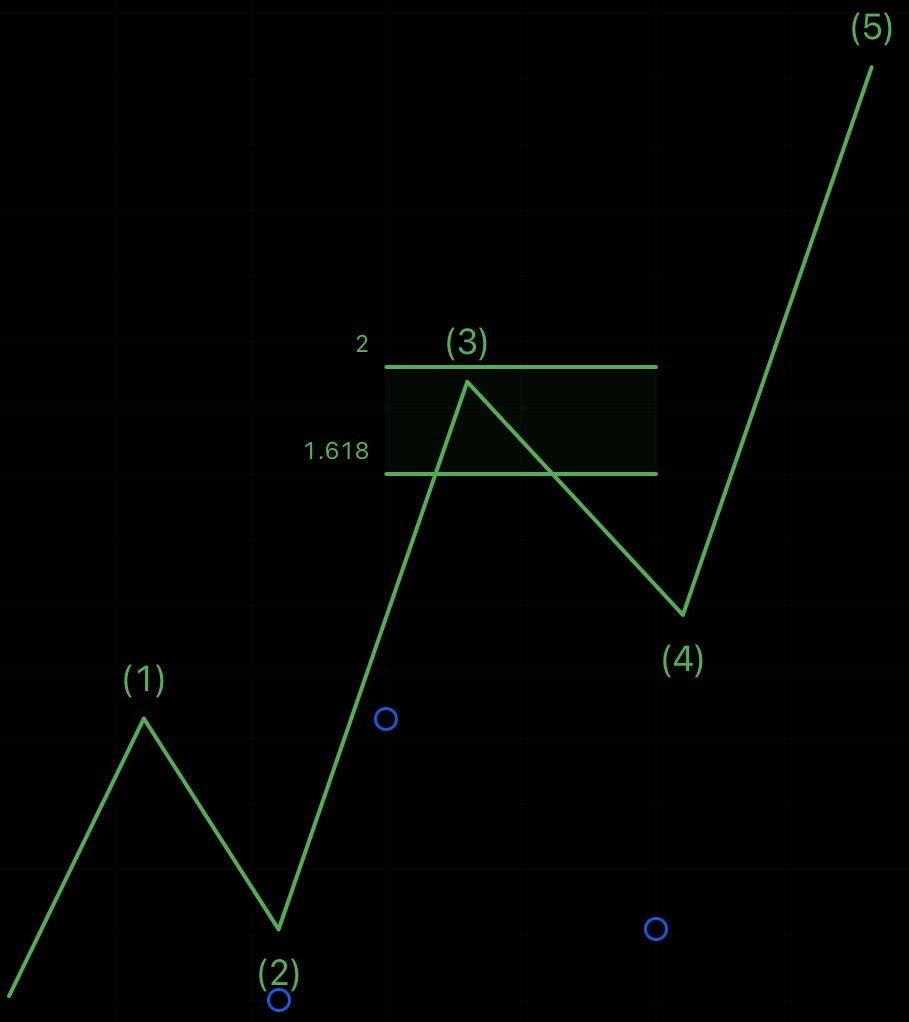
1.618 × Wave 1 - 2 x Wave 1-Wave 2 (standard extension)
2.618 × Wave 1-Wave 2 (strong trend conditions)
These levels form zones rather than exact price targets, reflecting real market variability.
Wave 4 Retracement Zones
Wave 4 typically retraces:
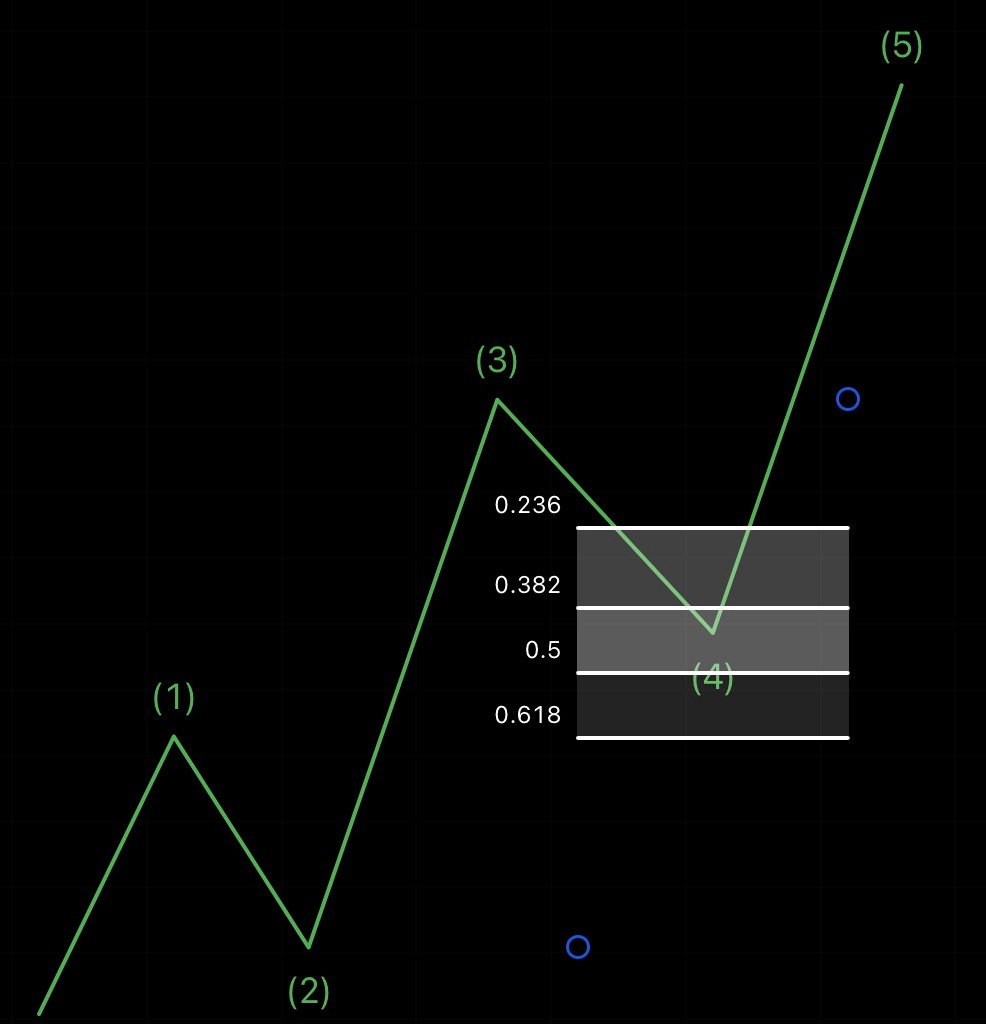
23.6% of Wave 3
38.2% of Wave 3
50% of Wave 3
61.8% of Wave 3
Stronger trends tend to produce shallow retracements combined with time-based consolidation.
Wave 5 Projection Logic
Wave 5 is characterized by weakening momentum.
Common projections:
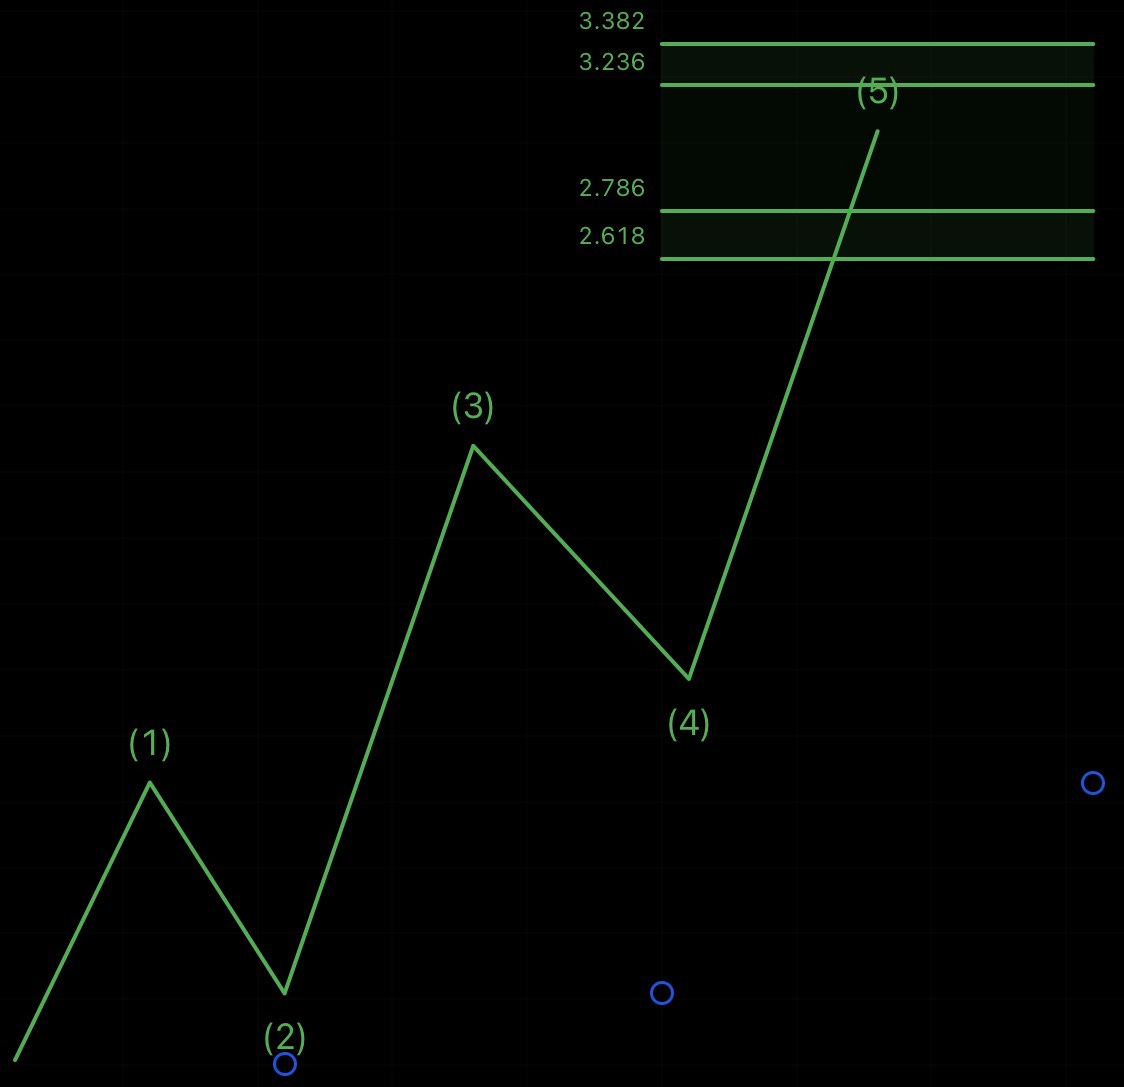
2.618% of Wave 1-Wave 2
2.786% of Wave 1-Wave 2
3.236% of Wave 1-Wave 2
3.382% of Wave 1-Wave 2
Wave 5 often represents trend exhaustion and distribution phases.
Corrective Targets (A–B–C)
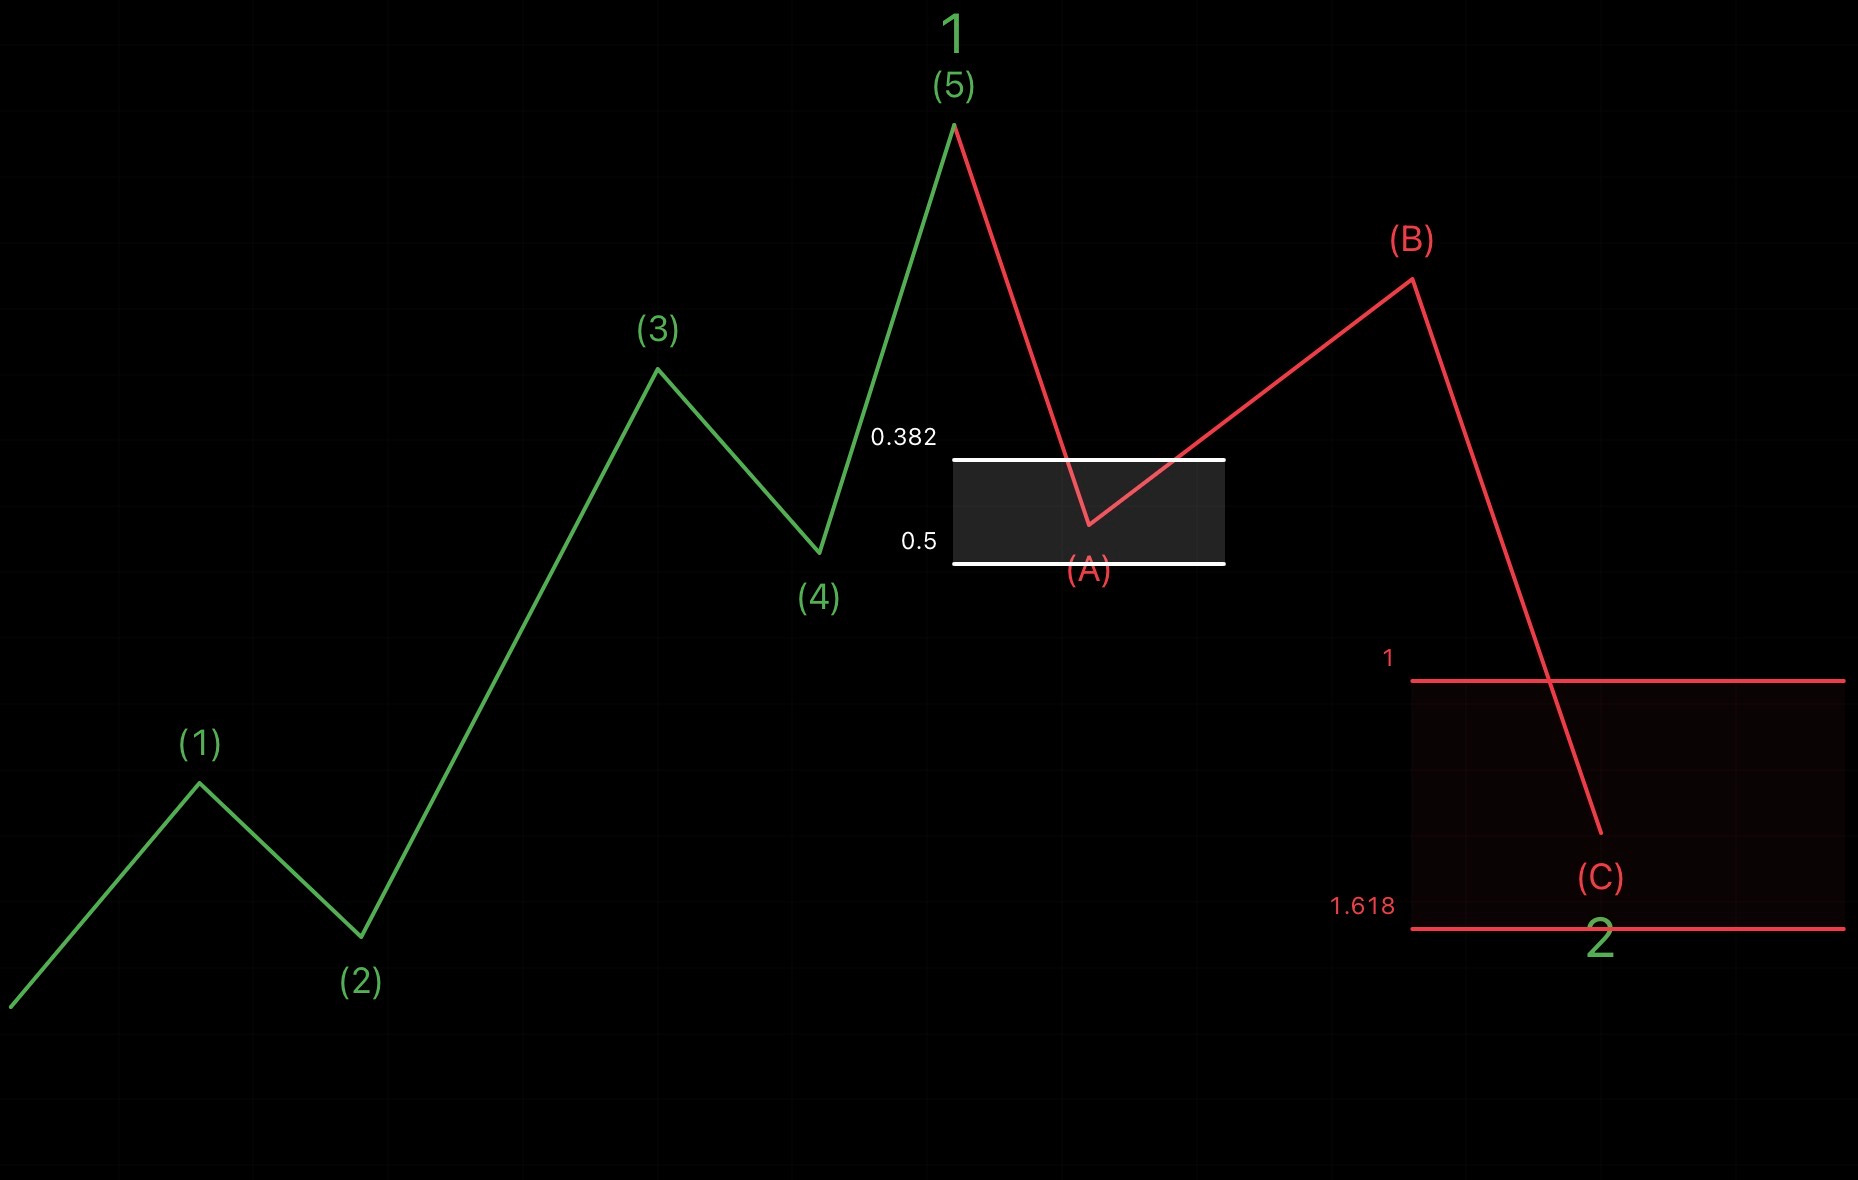
For corrective structures:
Wave A: typically 38.2%–50% retracement of prior impulse
Wave C: often equals Wave A or extends to 1.618 × Wave A (1-1.618% extension Wave A-Wave B)
Wave C: ends in higher degree targets (retracement levels)
→ this allows a cluster of different meassures for Wave C to create a high probability reversal zone.
These zones define high-probability reversal areas, not exact turning points.
4. Correlation Analysis as a Validation Filter
Elliott Wave structures in isolation are inherently prone to subjectivity. To reduce this, intermarket correlation analysis is used as a structural validation layer.
Key Areas of Analysis
Major indices (S&P 500, Nasdaq, DAX, etc.)
Sector rotation and internal strength
Volatility conditions (risk expansion vs contraction)
Currency and commodity relationships
Risk-on / risk-off behavior across markets
Why Correlation Matters
Markets are interconnected systems. No asset moves independently from macro capital flows.
A wave structure is only considered valid if it aligns with:
index direction
sector momentum
macro risk sentiment
Example:
A bullish Wave 3 structure in a single asset
While the index is in a corrective Wave C phase
→ reduces probability and weakens structural validity.
Correlation analysis functions as a filter against isolated or misleading setups.
5. Index Structure as the Primary Framework
Index structure is treated as the dominant market structure layer.
Individual assets are always analyzed in relation to:
index wave position
market breadth
sector alignment
liquidity direction
This ensures that trades are not taken against the broader structural environment.
The index defines the macro wave environment, while individual assets represent subordinate structures within it.
6. Execution Framework (Potential Trading Logic)
Entry Conditions
A trade is only considered valid when most conditions align:
Higher timeframe trend confirmation
Valid Elliott Wave structure
Fibonacci zone confluence
Correlation alignment with index structure
Fundamental key factors
Global context
Invalidation Rules
Every setup can have a clearly defined invalidation level:
Wave 2 invalidation: break of Wave 1 origin
Wave 4 invalidation: structural overlap or impulse failure
Corrective invalidation: breach of expected wave endpoint
Profit-Taking Logic
Exits are structured in phases:
Partial profits at 1.618 extension zones
Full exit during Wave 5 development
This ensures systematic risk reduction during trend maturation.
7. Why This Approach Works
The effectiveness of this framework is based on the combination of four components:
1. Structural Logic (Elliott Waves)
Defines repeatable behavioral patterns.
2. Mathematical Modeling (Fibonacci)
Converts structure into measurable probability zones.
3. Market Context (Correlations)
Prevents isolated or misleading interpretations.
4. Macro Alignment (Index Structure)
Ensures alignment with dominant market direction.
Instead of predicting exact price movements, the focus is on:
Identifying high-probability structural zones where market behavior statistically tends to repeat.
8. Chart Annotation Standards
All charts used in EllTec Analysis usually include:
Clear wave labeling (1–2–3–4–5 / A–B–C)
Fibonacci retracement and extension levels
Potential defined invalidation points
Index or correlation references
Potential Trading
Each chart represents a structured market hypothesis, to limit subjective interpretation.
You want to learn more about EllTec Analysis:
https://elltecanalysis.substack.com/about
Conclusion
Elliott Wave Theory within EllTec Analysis is used as a structured market framework rather than a predictive tool. When combined with Fibonacci projections, correlation analysis, and index-based validation, it becomes a systematic model for identifying high-probability market zones.
The goal is not certainty, but consistency, structure, and probabilistic alignment with market behavior to create clarity.
Disclaimer
This analysis is for informational purposes only and does not constitute financial advice. All information is provided without guarantee. Markets involve risks, and past performance is not indicative of future results. Please do your own research or consult a licensed advisor. EllTec Analysis assumes no liability for decisions based on this content.