

Sugar Futures
Sweet Spot: A Structural Wave Relaunch in the Making


1. Fundamentals
Sugar is one of the oldest and most actively traded commodity futures in the world, with Sugar #11, the global benchmark contract traded on the Intercontinental Exchange (ICE), carrying a trading history that predates the modern commodity futures complex by decades. Denominated in US cents per pound, Sugar #11 reflects the price of raw cane sugar and serves as the primary global reference for physical sugar trade, hedging, and speculative positioning. The depth, liquidity, and longevity of the sugar futures market make it one of the most technically well-defined commodity contracts available, with a price history long and clean enough to support multi-decade Elliott Wave analysis with a high degree of structural clarity.
The global sugar market is dominated by a small number of major producing nations. Brazil is by far the world’s largest producer and exporter of raw cane sugar, typically accounting for approximately 40 to 50 percent of global export volumes in any given year. This concentration means that Brazilian macroeconomic and agricultural conditions, including the BRL/USD exchange rate, domestic fuel policy, and seasonal harvest dynamics, have an outsized and direct influence on global sugar prices. India, Thailand, and the European Union round out the other major producing blocs, with each contributing meaningfully to global supply balance sheets, particularly in years when Brazilian output is disrupted.
A structural feature unique to the sugar market is the dual-use nature of sugarcane. In Brazil, sugarcane is processed into either raw sugar or ethanol, with the allocation between the two uses driven by the relative profitability of each product at any given time. This creates a direct and persistent competitive relationship between sugar prices and crude oil prices, when energy prices rise, mills shift production toward ethanol, reducing sugar output and tightening global supply. Conversely, low oil prices make sugar production more attractive relative to ethanol, increasing output and weighing on prices. This ethanol arbitrage mechanism introduces a structural floor and a ceiling dynamic to sugar valuations that is absent in most other agricultural commodities.
Weather patterns, particularly the El Niño and La Niña cycles, exert significant multi-year influence on sugarcane yields in both Brazil and other key producing regions. El Niño events have historically been associated with drier conditions in Southeast Asia and Australia while producing wetter conditions in South America, affecting harvests in a complex and non-linear fashion across regions. Climate variability therefore represents a persistent exogenous supply shock risk that contributes meaningfully to the volatility of sugar futures. On the demand side, population growth in developing markets, rising dietary sugar consumption across Asia and Africa, and the expanding global food processing industry provide durable long-term structural demand growth that underpins the bullish multi-decade wave thesis outlined in this analysis.
From a macro perspective, sugar futures currently sit at historically significant levels relative to their long-term price structure. The combination of a technically complete higher-degree correction, a structurally defined entry zone, and a multi-decade wave expansion thesis creates a compelling asymmetric opportunity framework for patient, structure-oriented investors.
2. Correlations
Sugar futures operate within a correlation ecosystem shaped by currency dynamics, energy markets, agricultural commodity cycles, weather events, and emerging market trade policy. Each of these forces can function as a confirming or contradicting signal relative to the technical wave structure, and should be monitored in parallel with the Elliott Wave count.
Brazilian Real (BRL/USD)
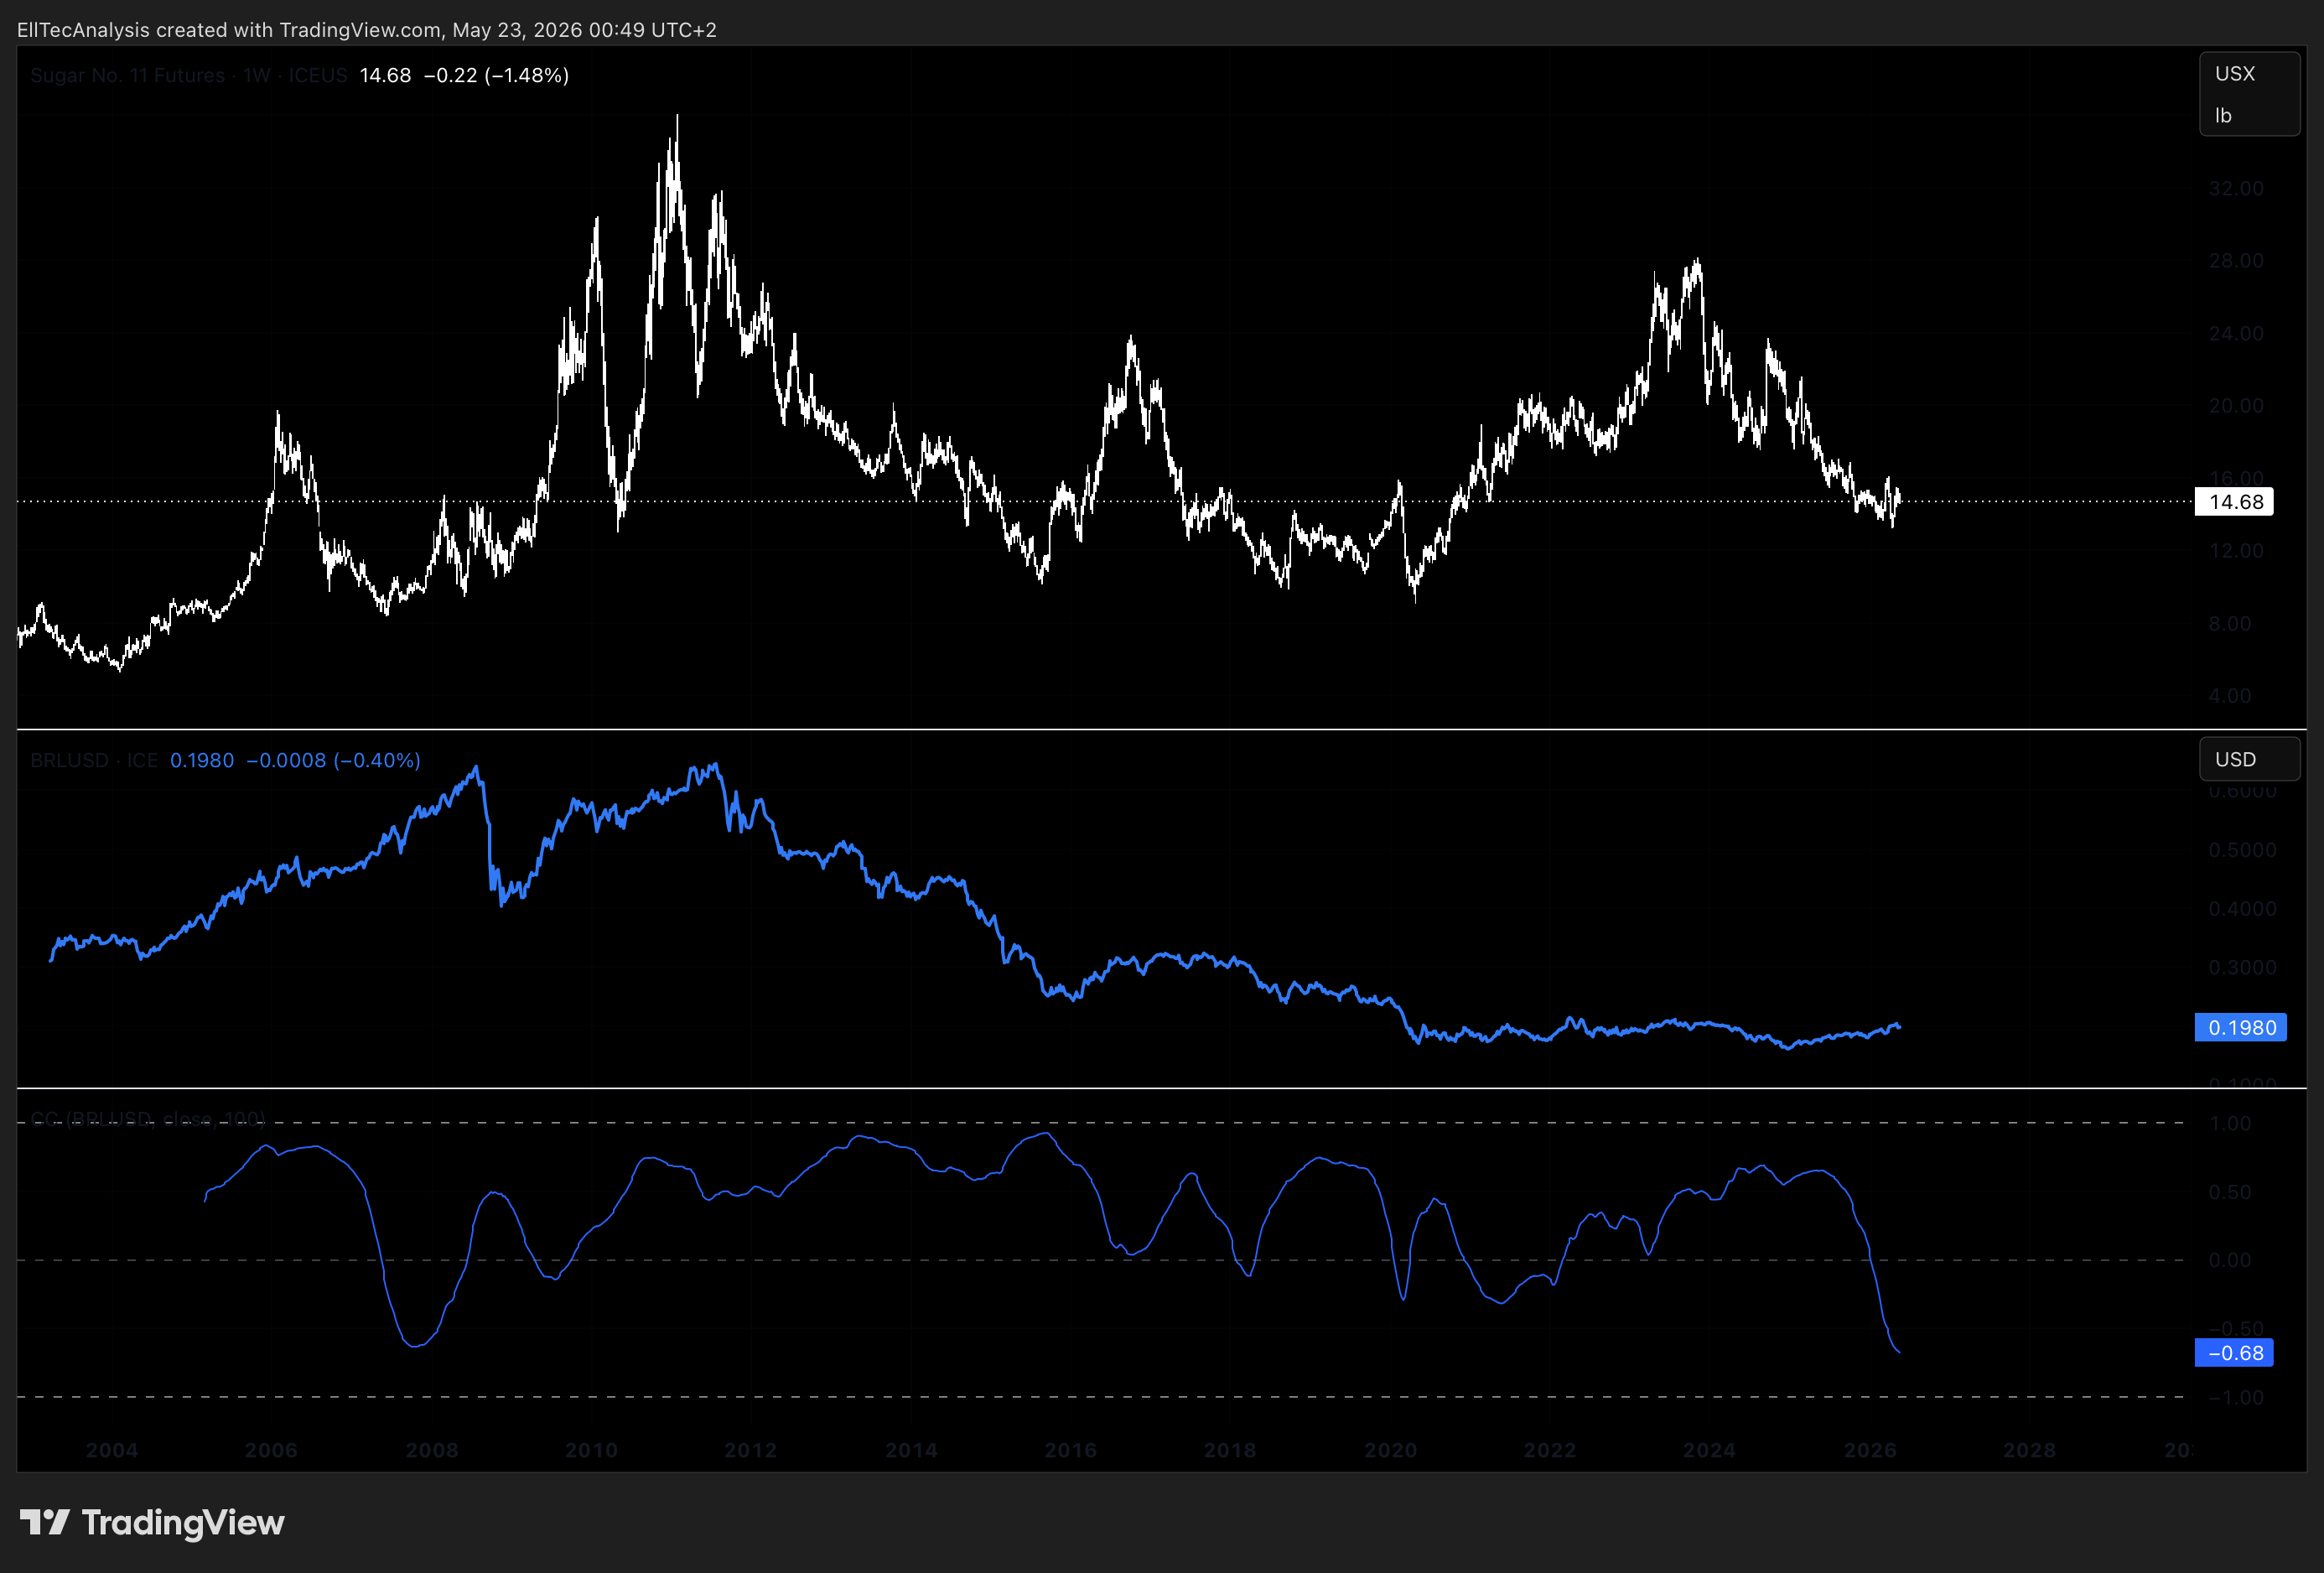
The Brazilian real is arguably the single most important external variable for sugar futures pricing. Because the majority of global sugar exports originate in Brazil and Brazilian producers operate in BRL, a weaker real makes Brazilian sugar cheaper in USD terms on the international market, increasing export competitiveness and weighing on global USD-denominated prices. Conversely, a strengthening BRL reduces the competitive pressure from Brazilian exports and supports global sugar prices. Monitoring the BRL/USD exchange rate alongside the Sugar #11 price is essential for distinguishing structurally driven price moves from currency-distorted ones, and for timing the wave structure relative to Brazilian export cycles.
Crude Oil and Ethanol Parity
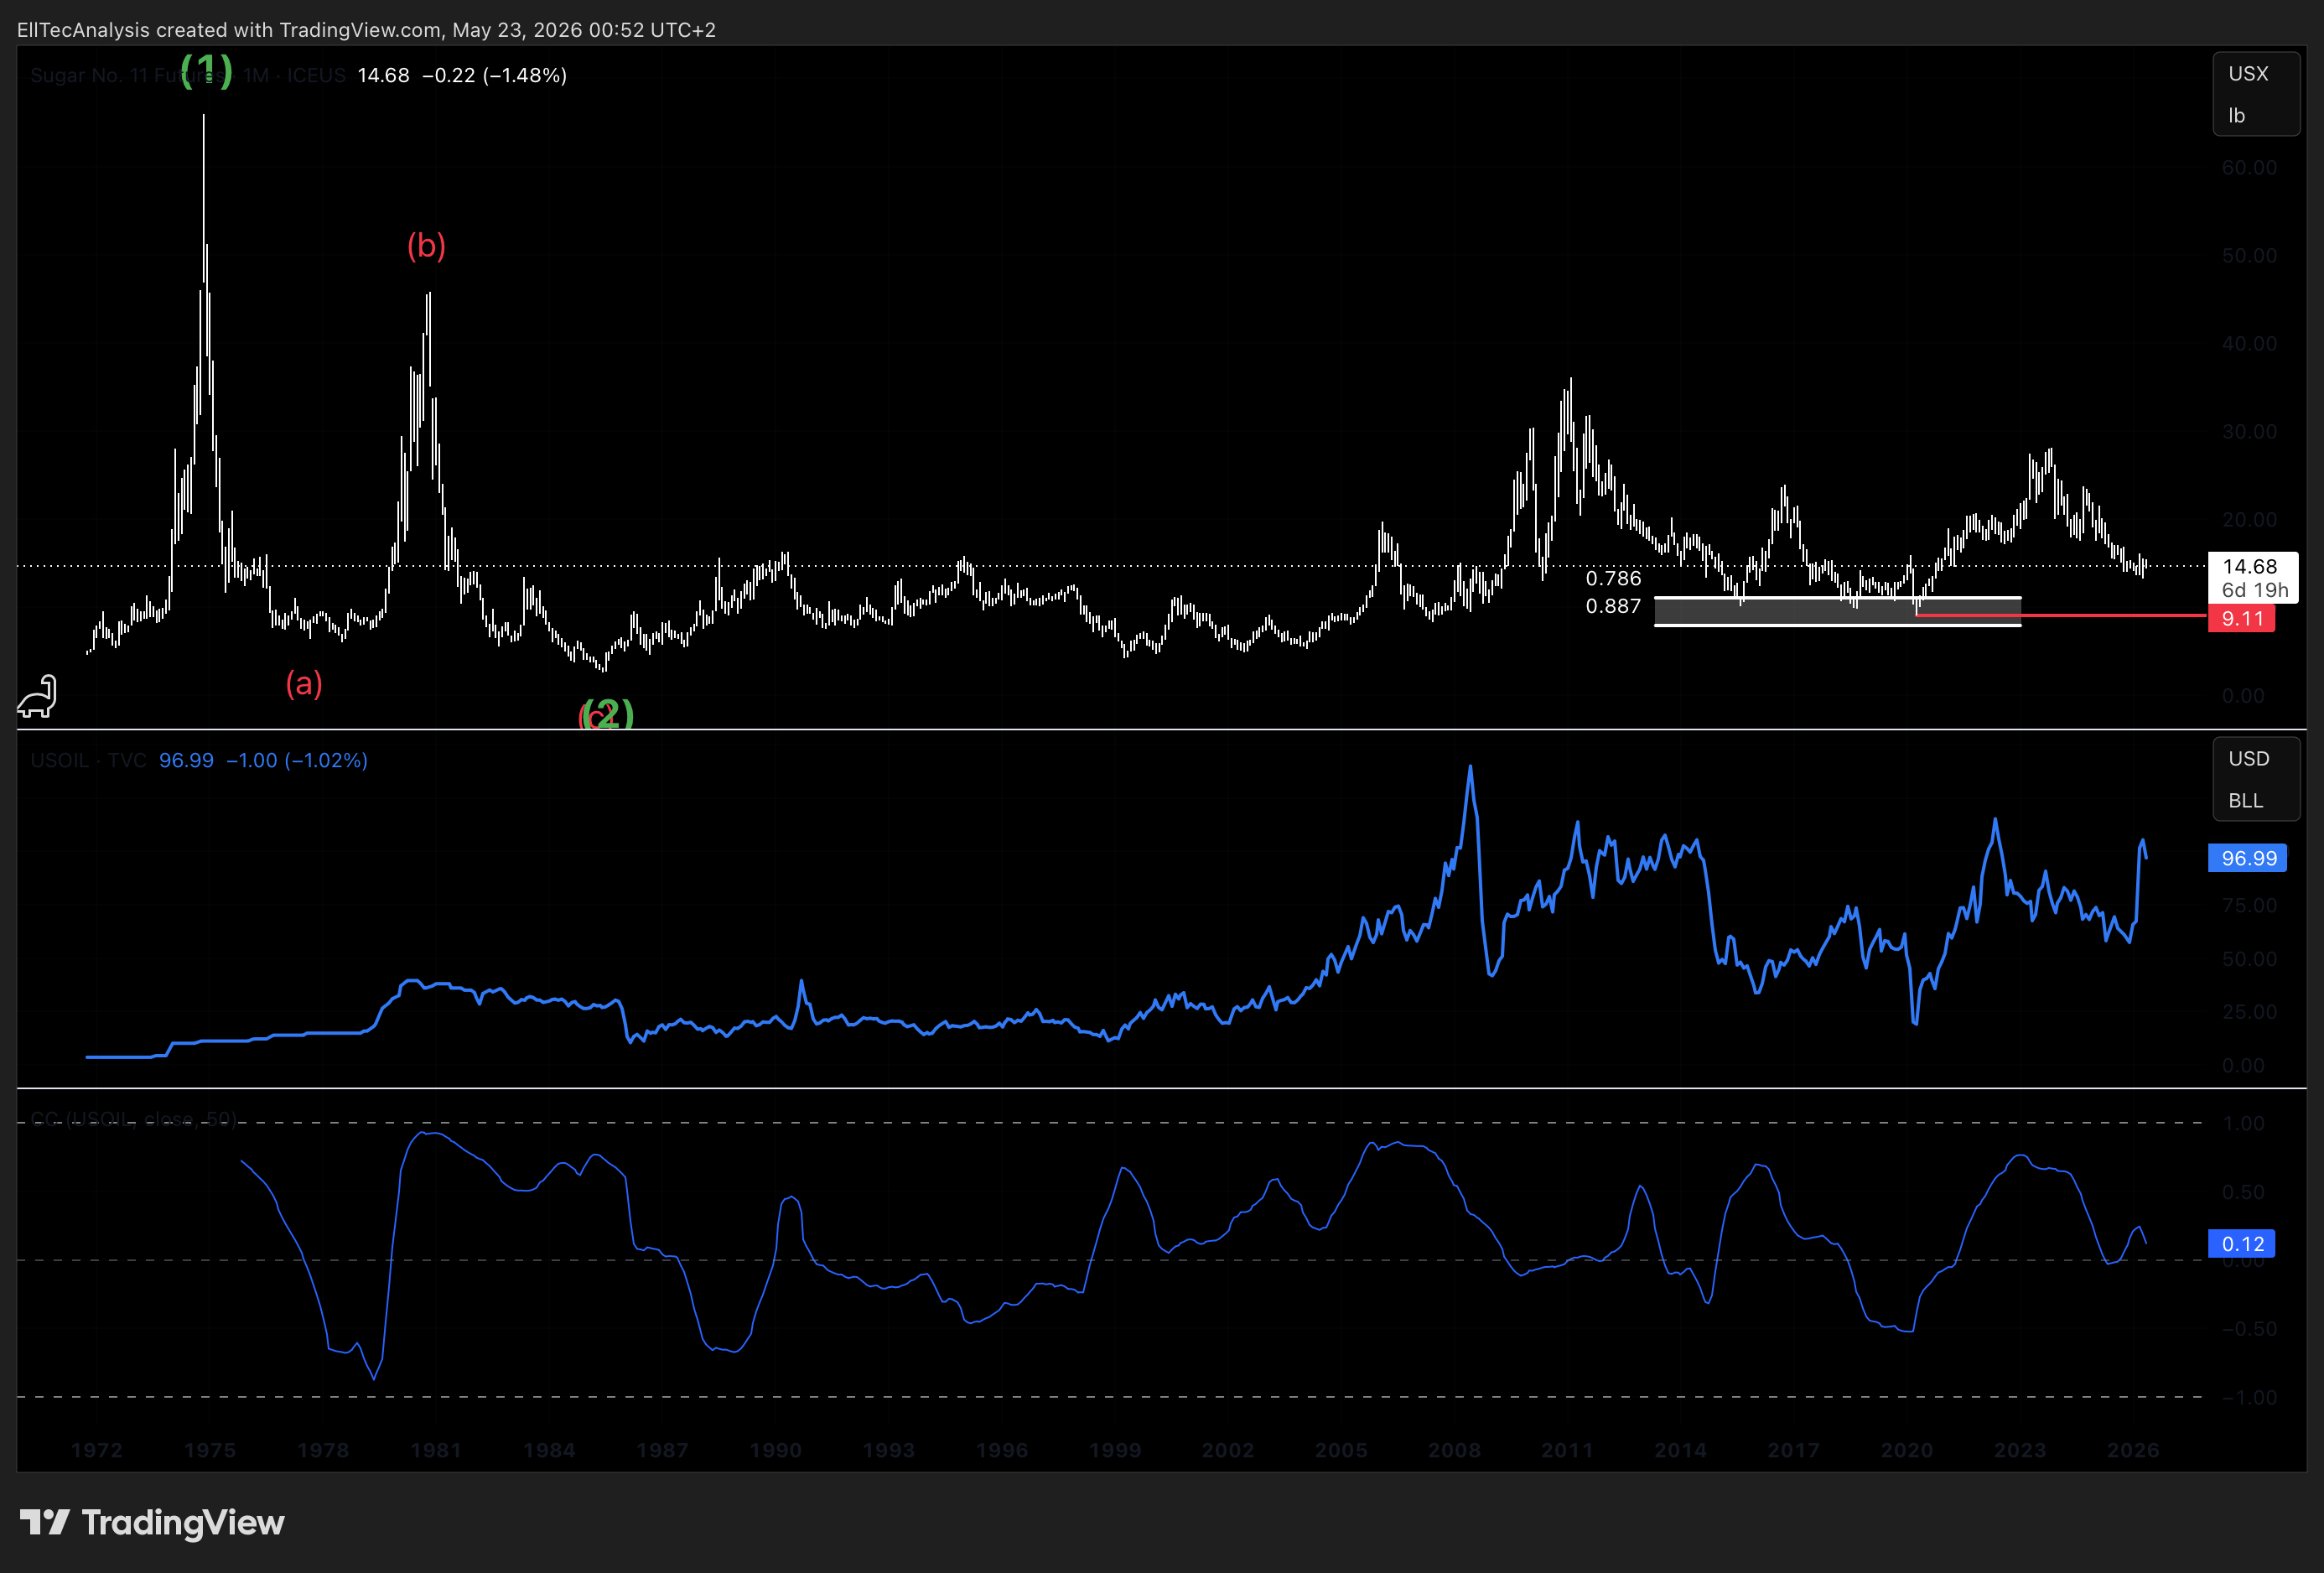
The competitive relationship between sugar and ethanol in Brazil’s sugarcane processing industry creates a persistent and tradeable correlation between Sugar #11 and global crude oil prices. Rising oil prices incentivize Brazilian mills to divert cane toward ethanol production, tightening the sugar supply balance and providing upward price support. A bullish oil cycle therefore creates a structural tailwind for sugar prices through the supply channel, independent of demand dynamics. This correlation is particularly relevant during the expansion phases of the wave structure, where a simultaneously supportive energy market can amplify the magnitude of the impulsive wave moves.
Agricultural Commodity Complex
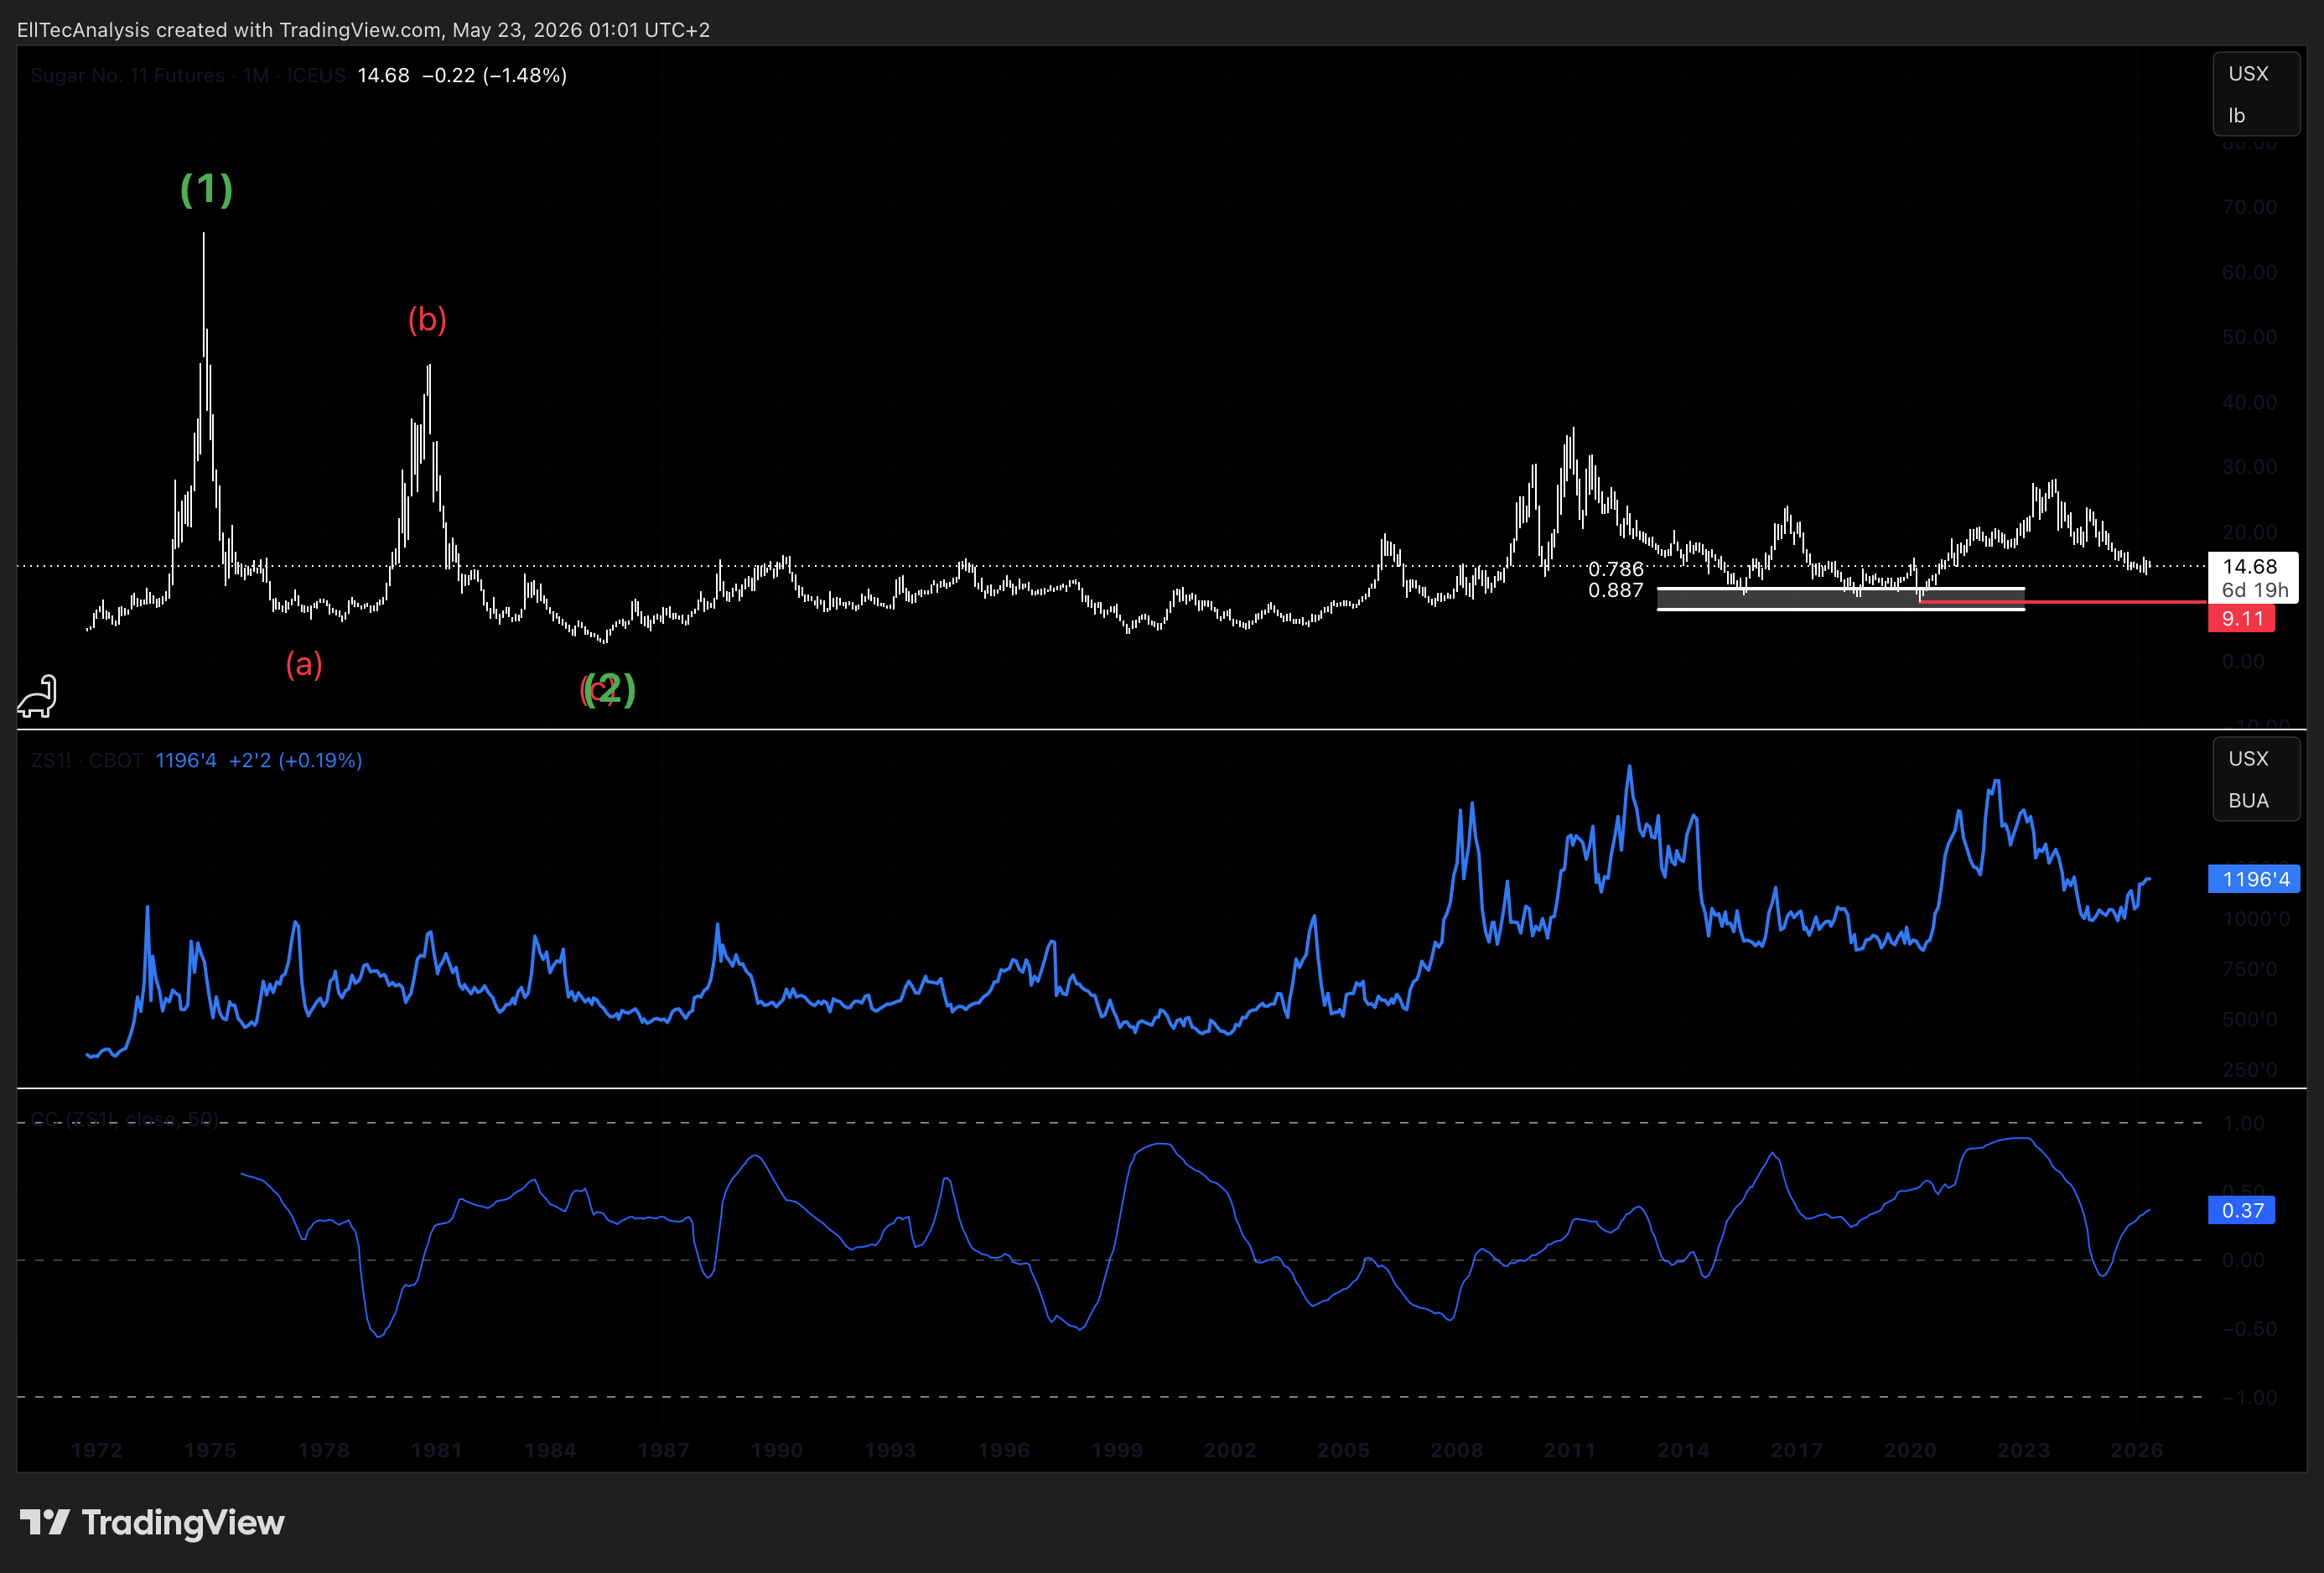
Sugar does not move in isolation from the broader agricultural commodity complex. Correlated moves with soybeans, corn, and other soft commodities driven by shared weather shocks, global food inflation dynamics, or broad commodity index flows can amplify or dampen sugar-specific price action. During periods of coordinated agricultural commodity bull markets, sugar often participates with above-average upside due to its historically high beta within the soft commodity complex. The current structural setup in sugar aligns well with the broader long-term commodity cycle thesis that has been discussed across multiple EllTec Analysis publications.
India Export Policy and Government Intervention
India is the world’s largest sugar consumer and the second-largest producer in most years. Government intervention in Indian sugar markets — including export bans, minimum support prices, and mill subsidy programs — represents a meaningful source of non-structural supply shock risk for global sugar prices. Indian export restrictions, implemented in recent years to protect domestic supply, have historically provided price support to international markets. Any structural shift in Indian export policy represents a key variable to monitor alongside the technical wave count, as it can accelerate or delay the anticipated impulsive wave sequences.
Global Food Inflation and Consumer Price Indices
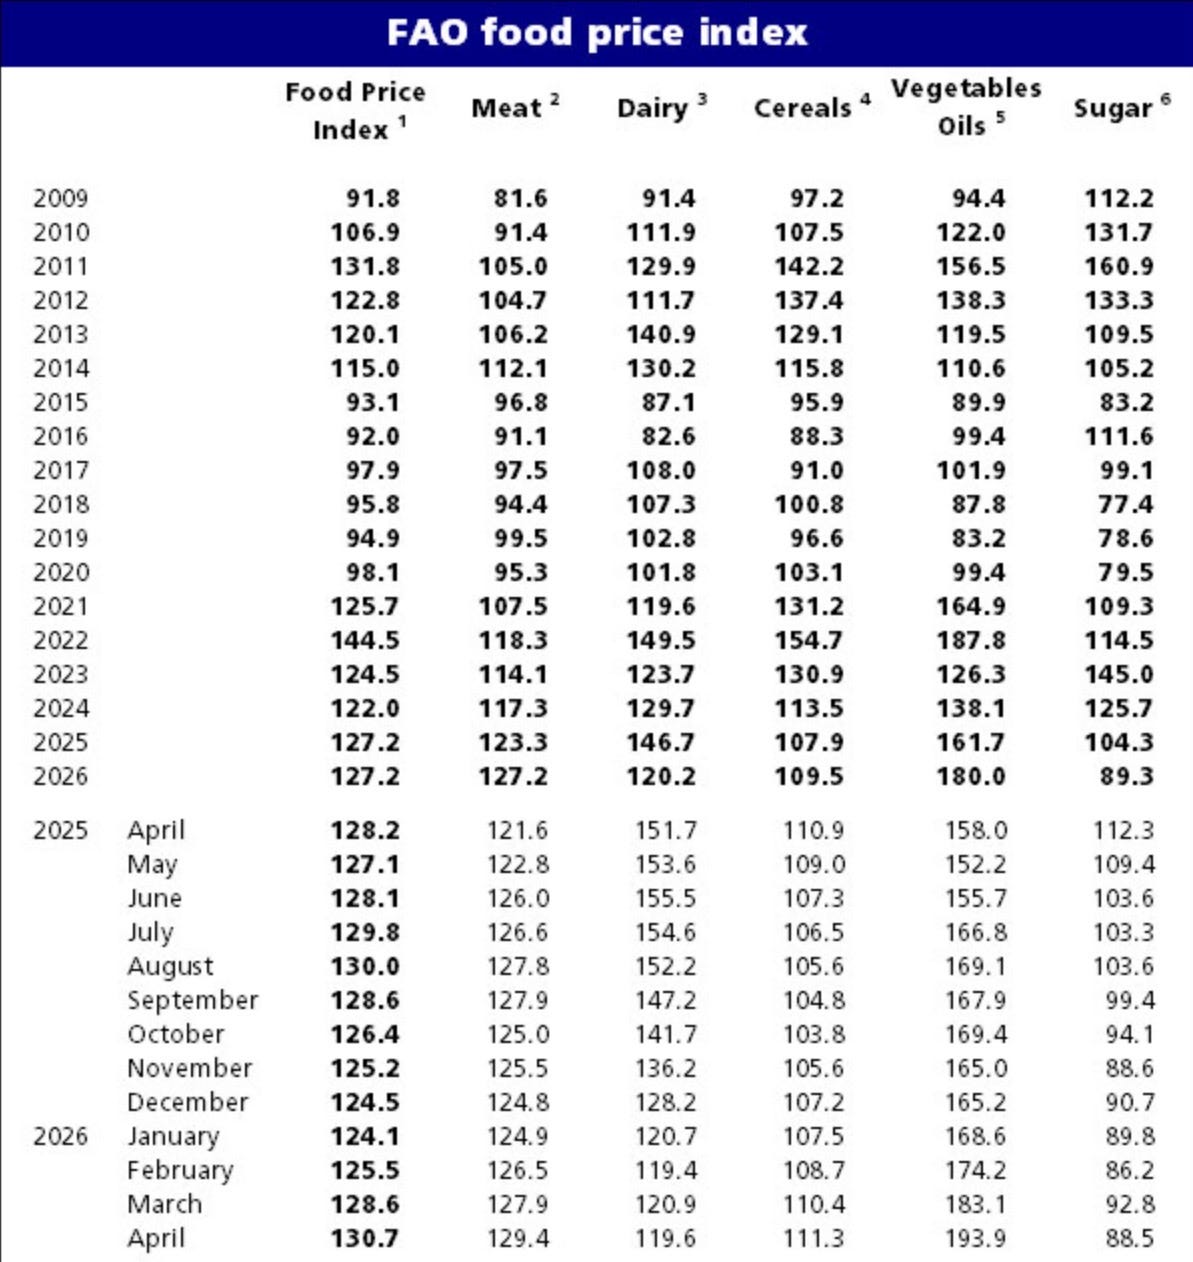
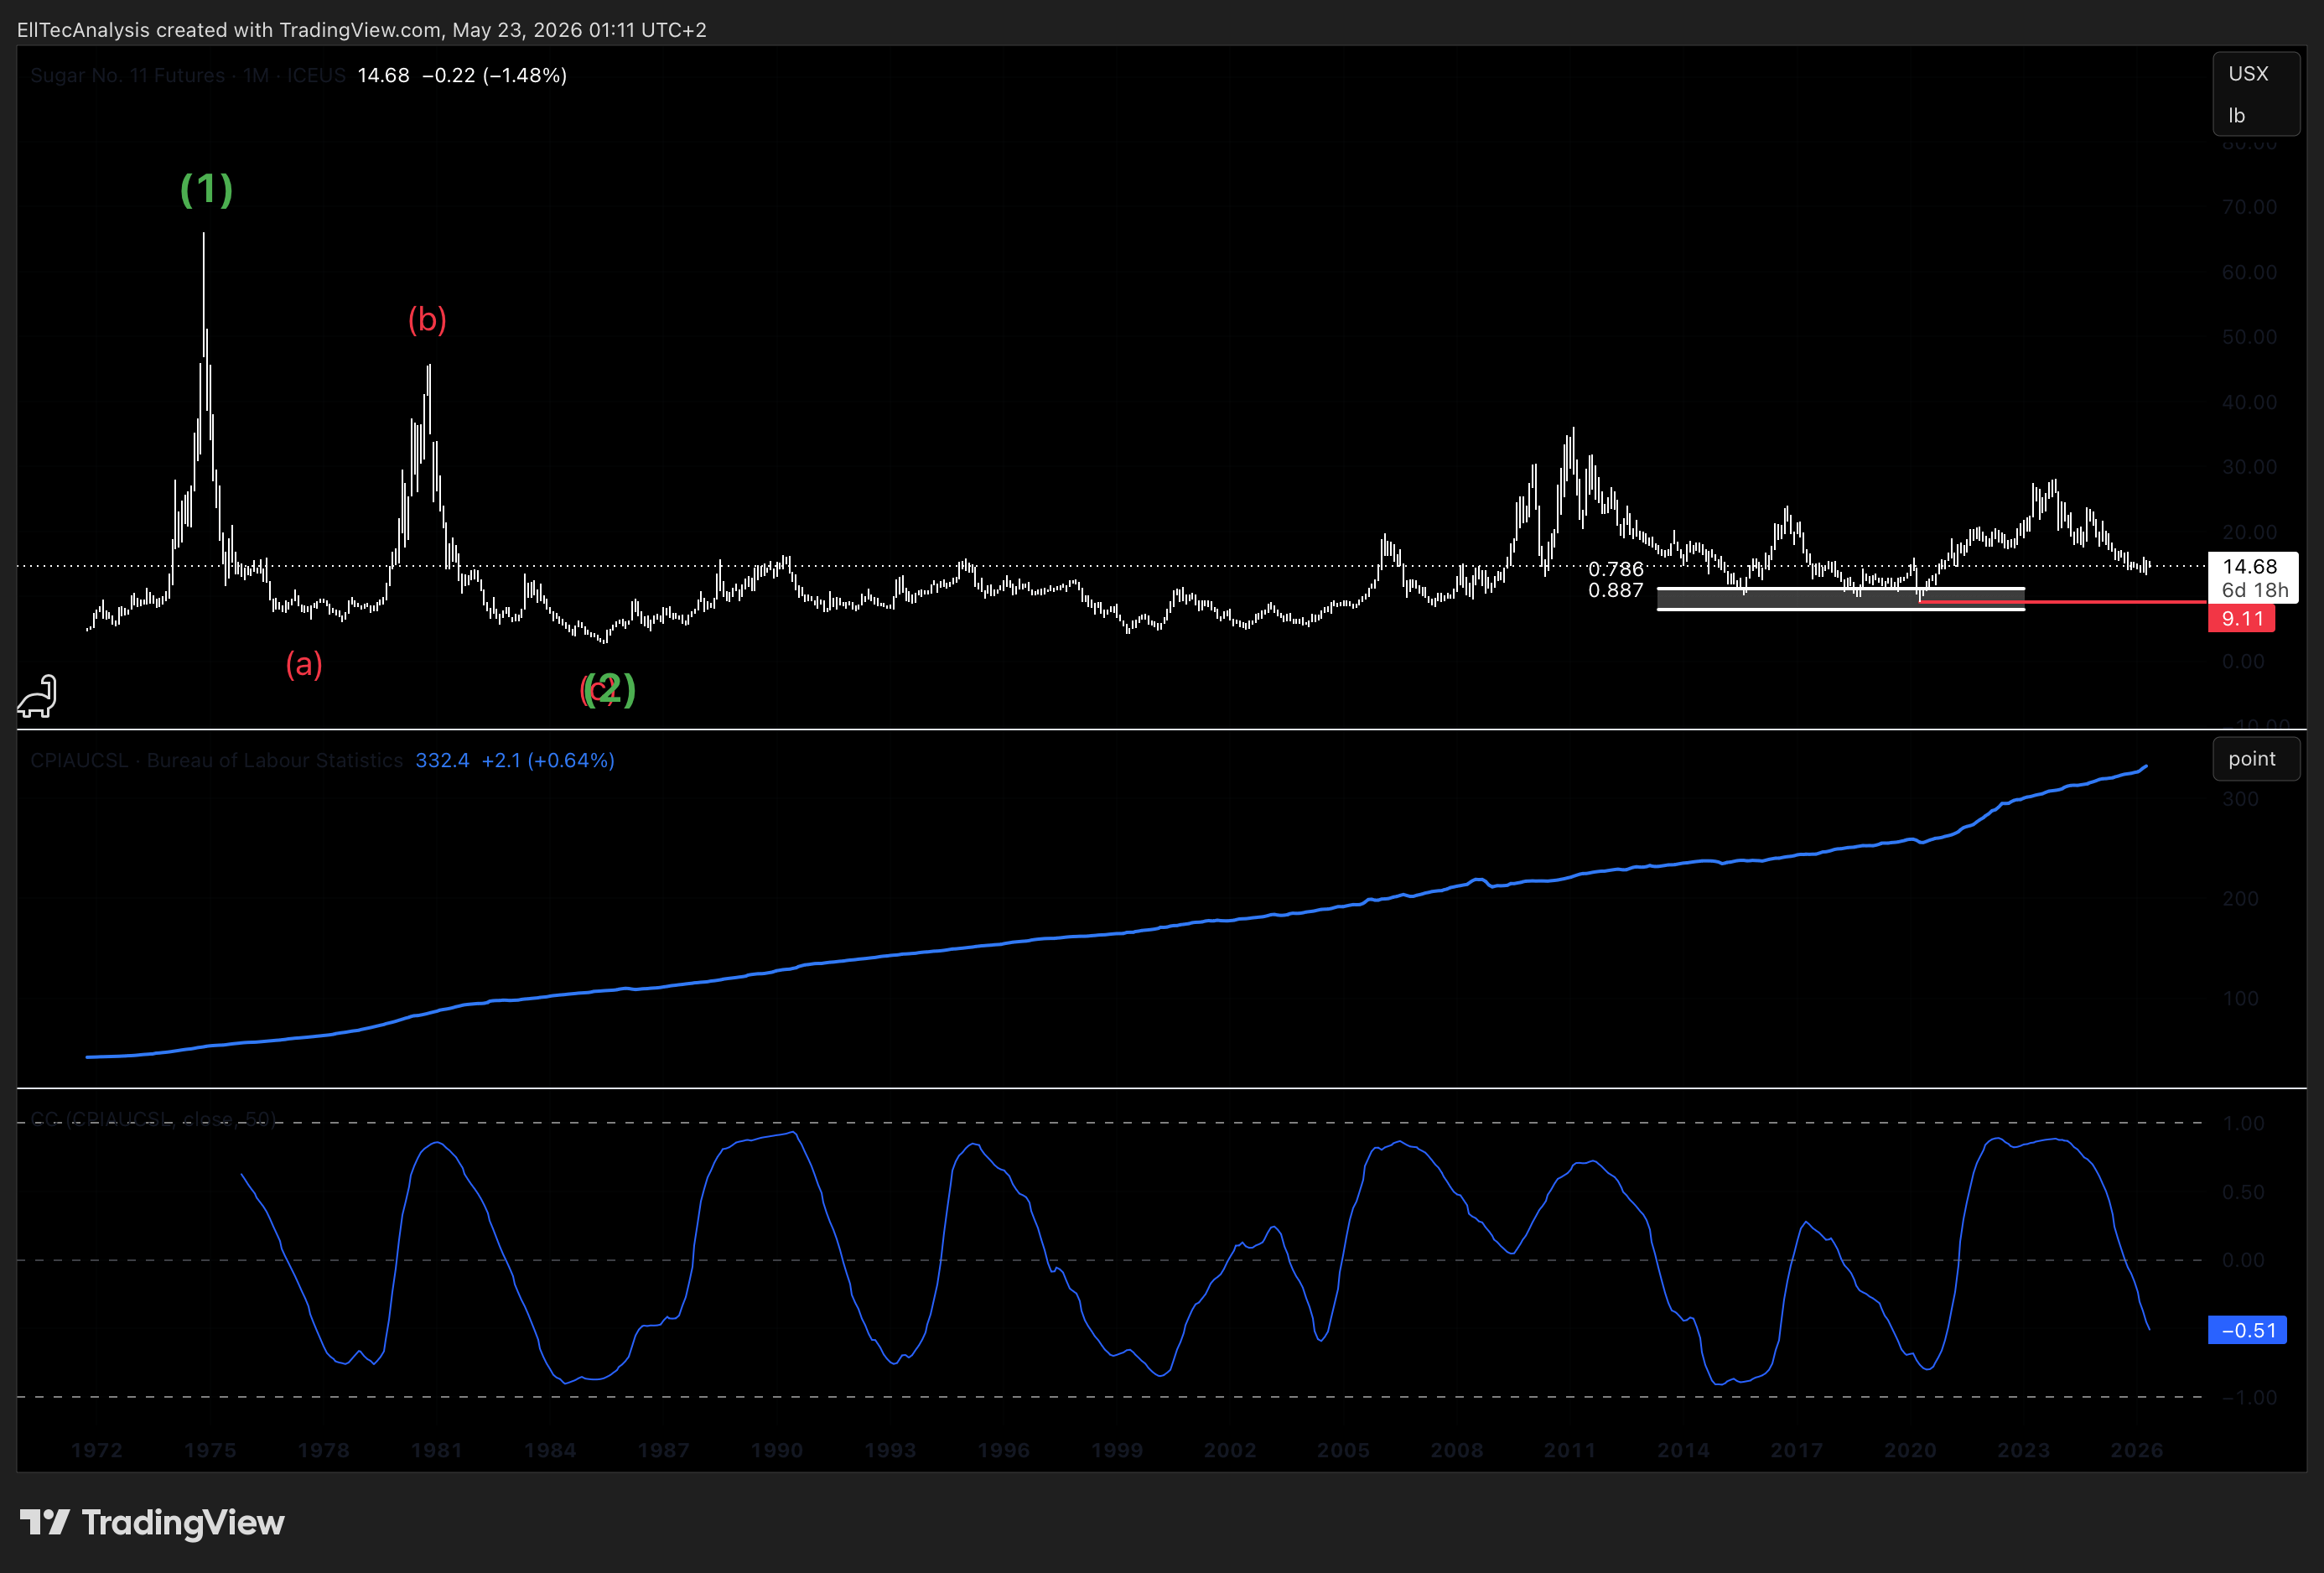
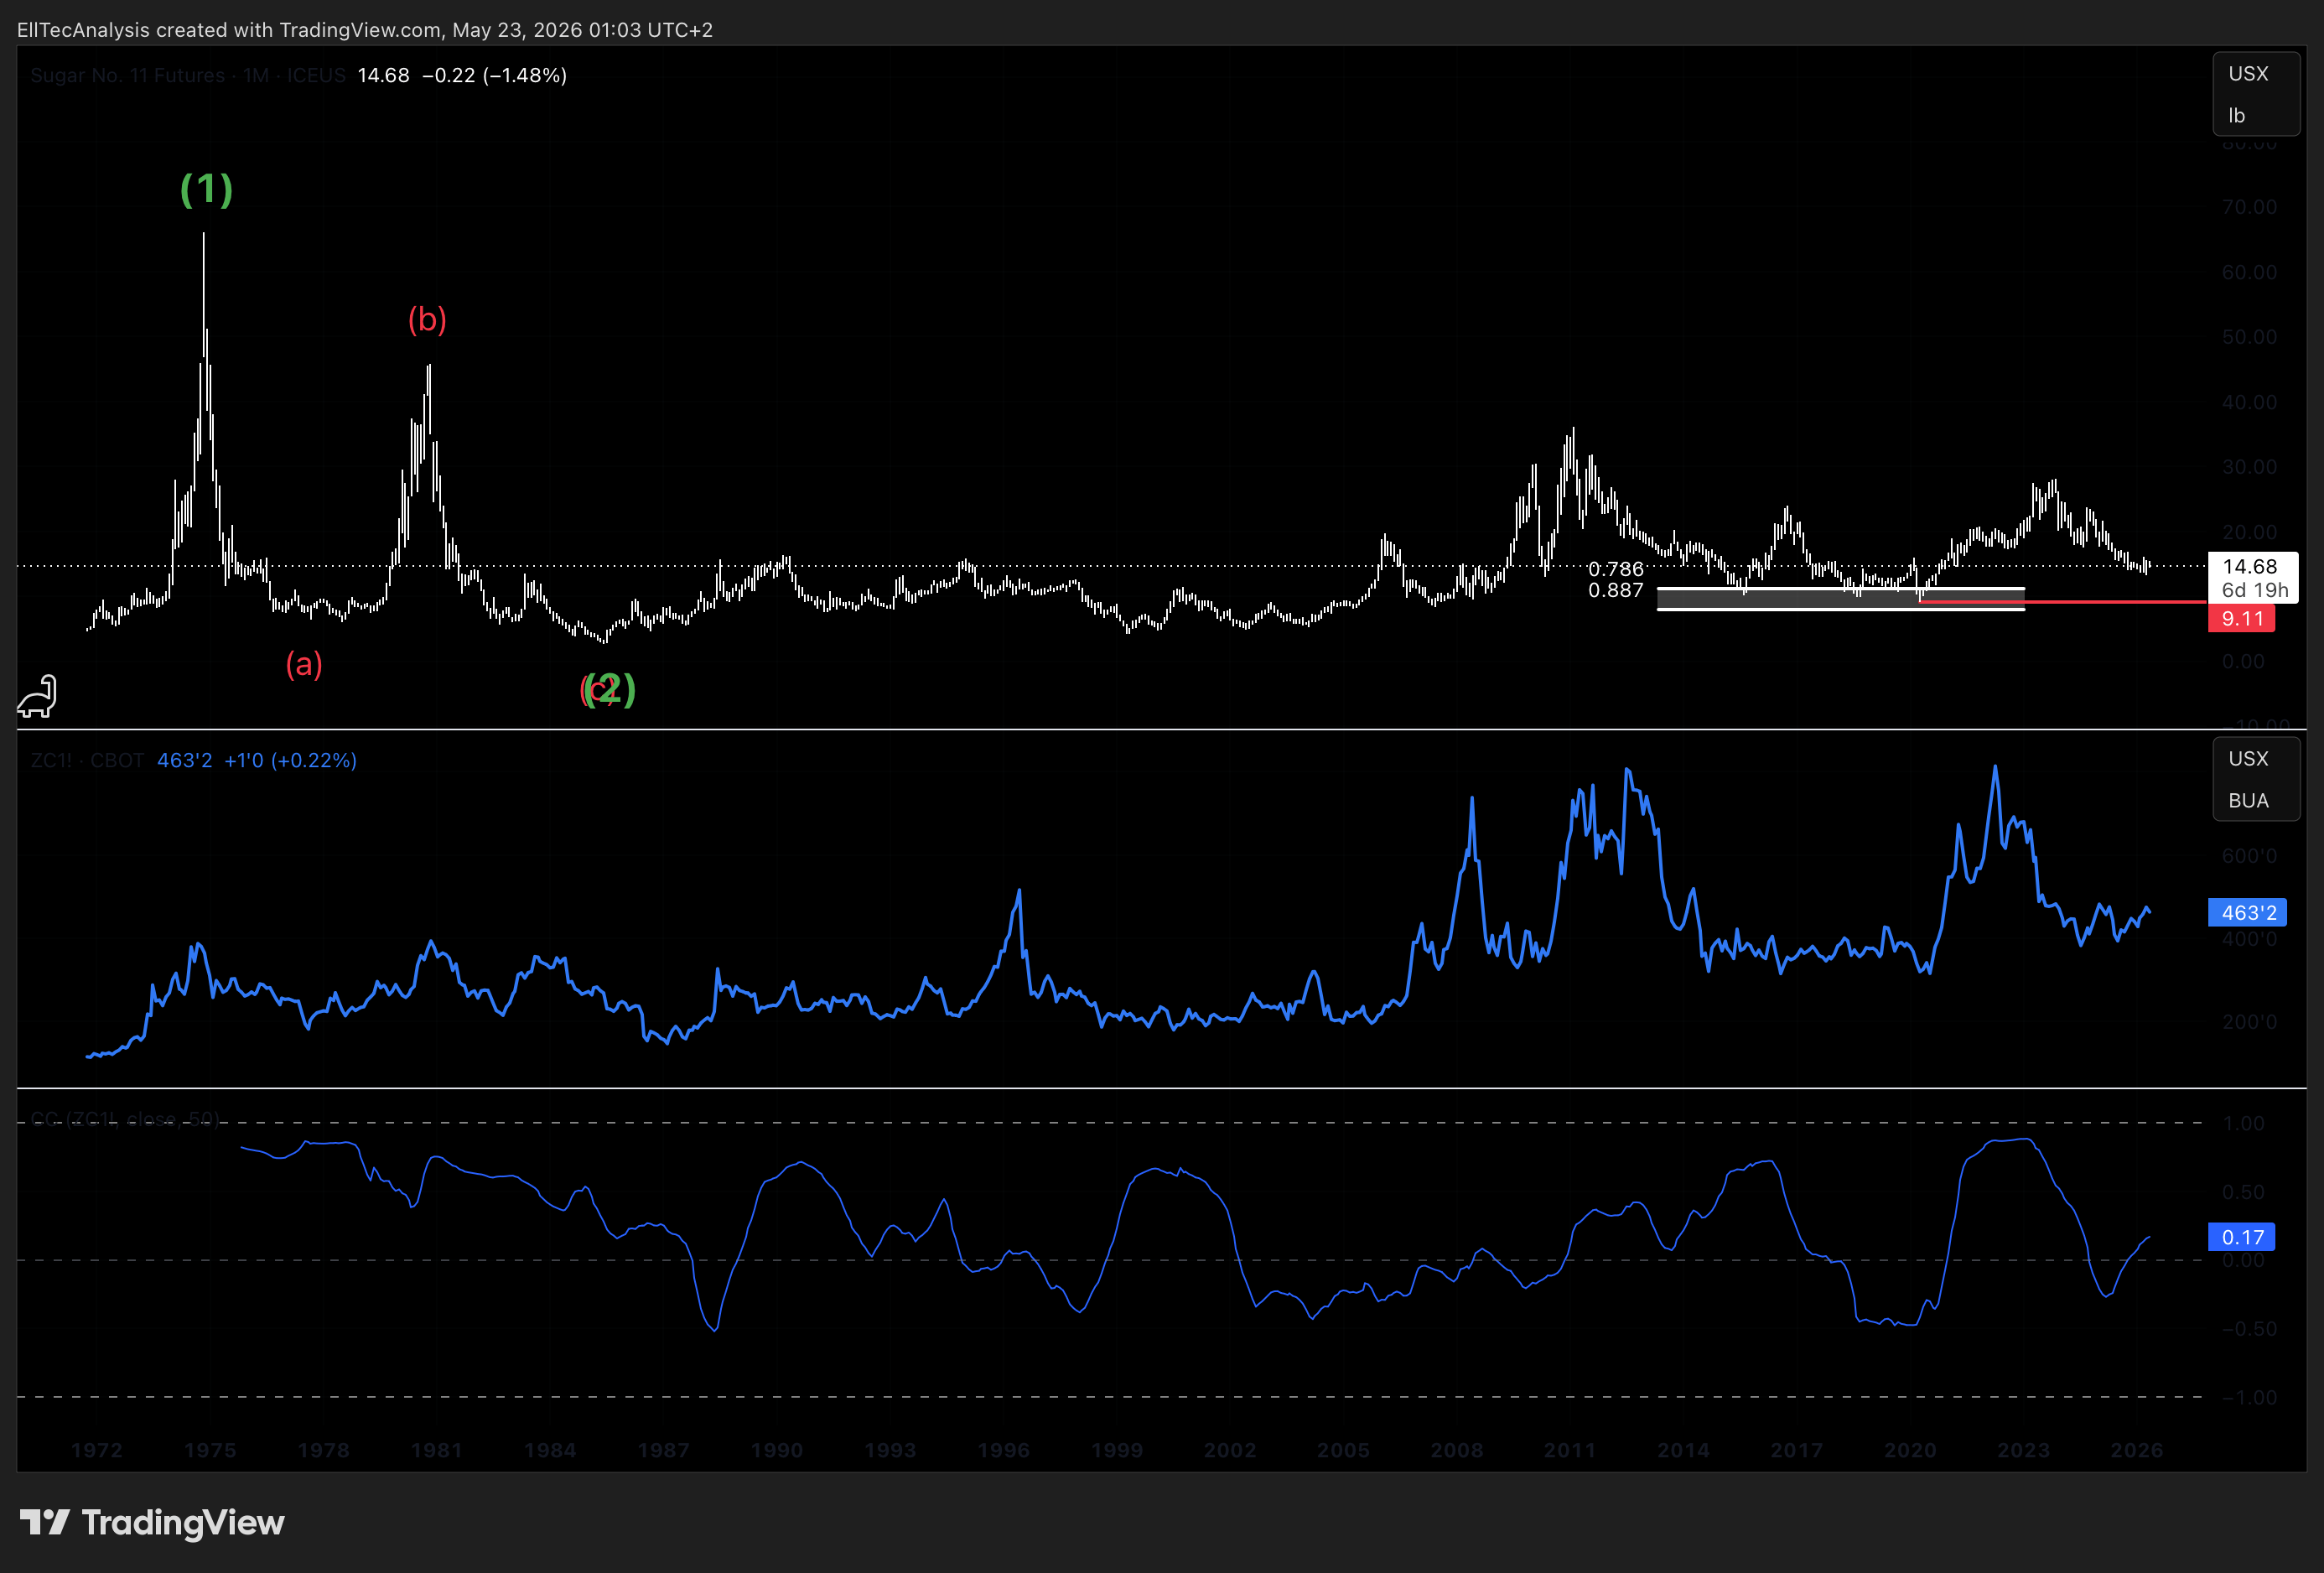
Sugar is a core component of global food price indices, and its price dynamics are monitored by central banks and policymakers as a food inflation input. During periods of broad inflationary pressure, sugar tends to benefit from simultaneous demand pull and commodity speculation flows. Conversely, deflationary or disinflationary environments can suppress agricultural commodity valuations. The interaction between the global inflation cycle and the sugar wave structure will be an important contextual factor as the anticipated Wave 3 expansion develops. In the displayed graphic, all food prices rose from 2009 to 2026 except sugar, indicating that sugar underperformed and has a major performance opportunity ahead, which supports the primary scenario displayed below. The Consumer Price Index also indicates that sugar underperformed significantly and has large upward potential because sugar moved sideways while the Consumer Price Index rose.
3. Technical Analysis — Elliott Wave Framework
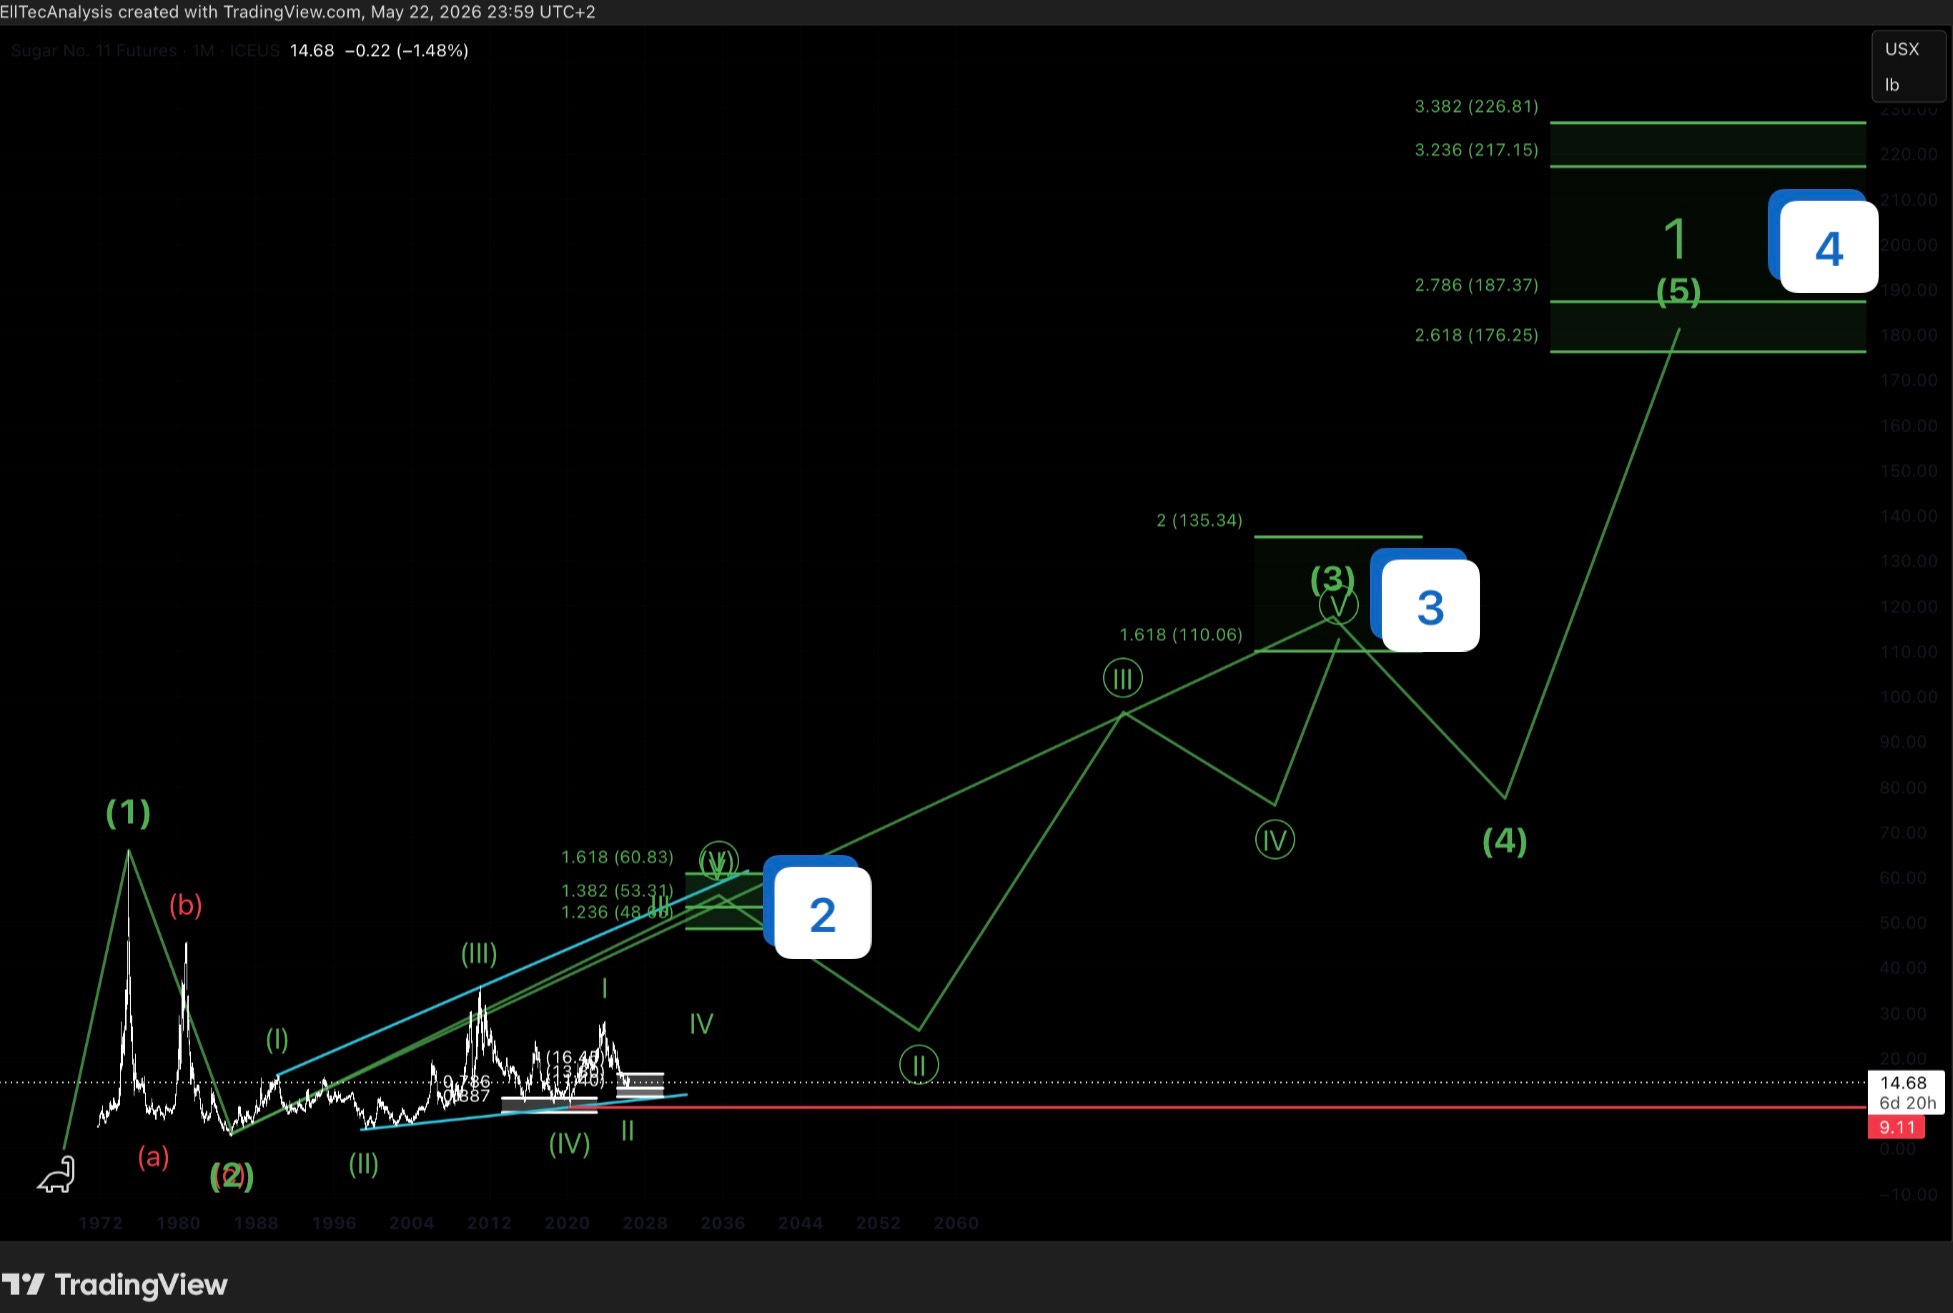
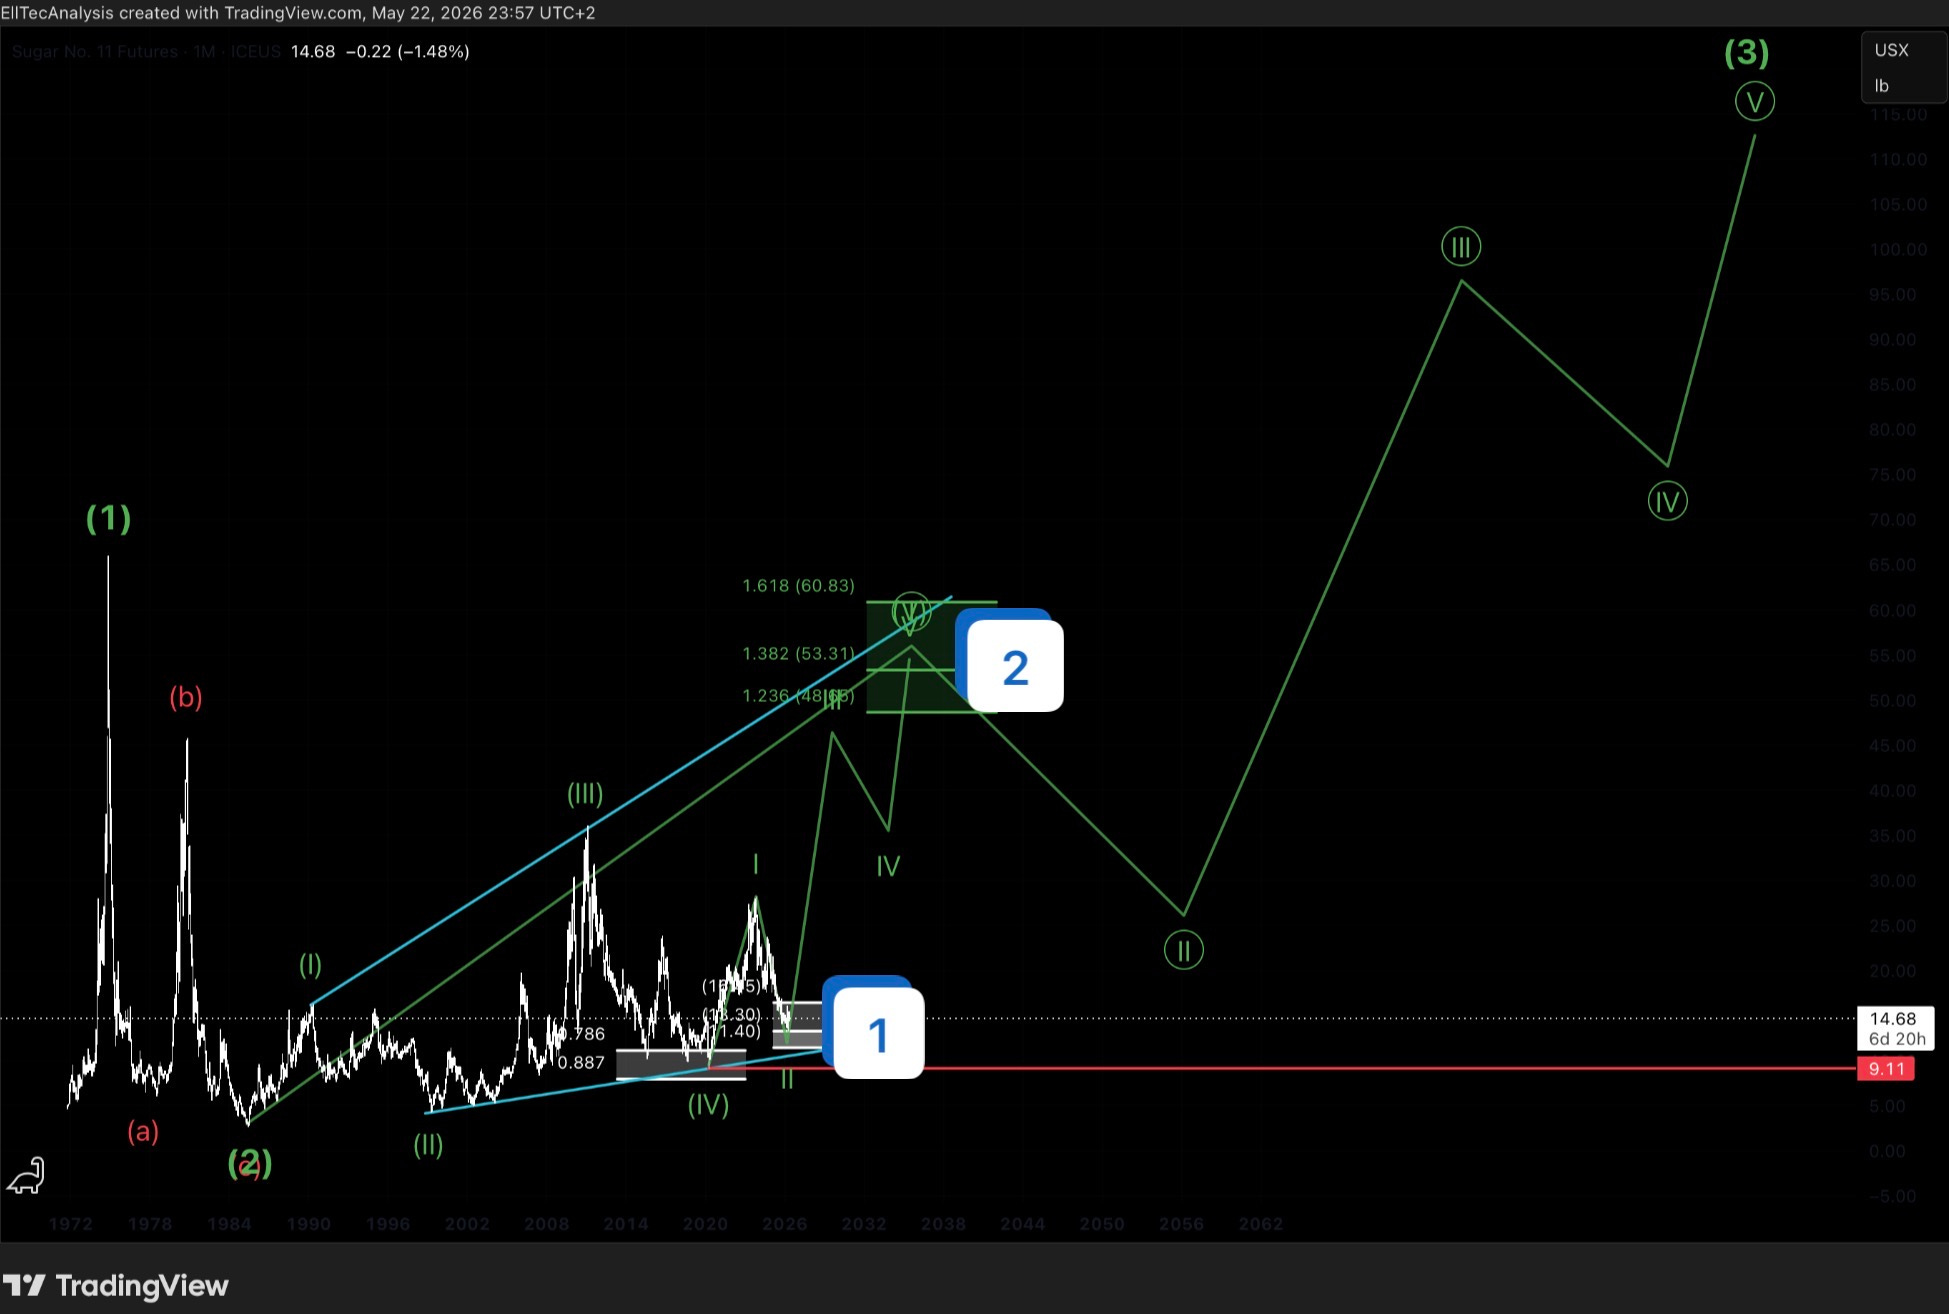
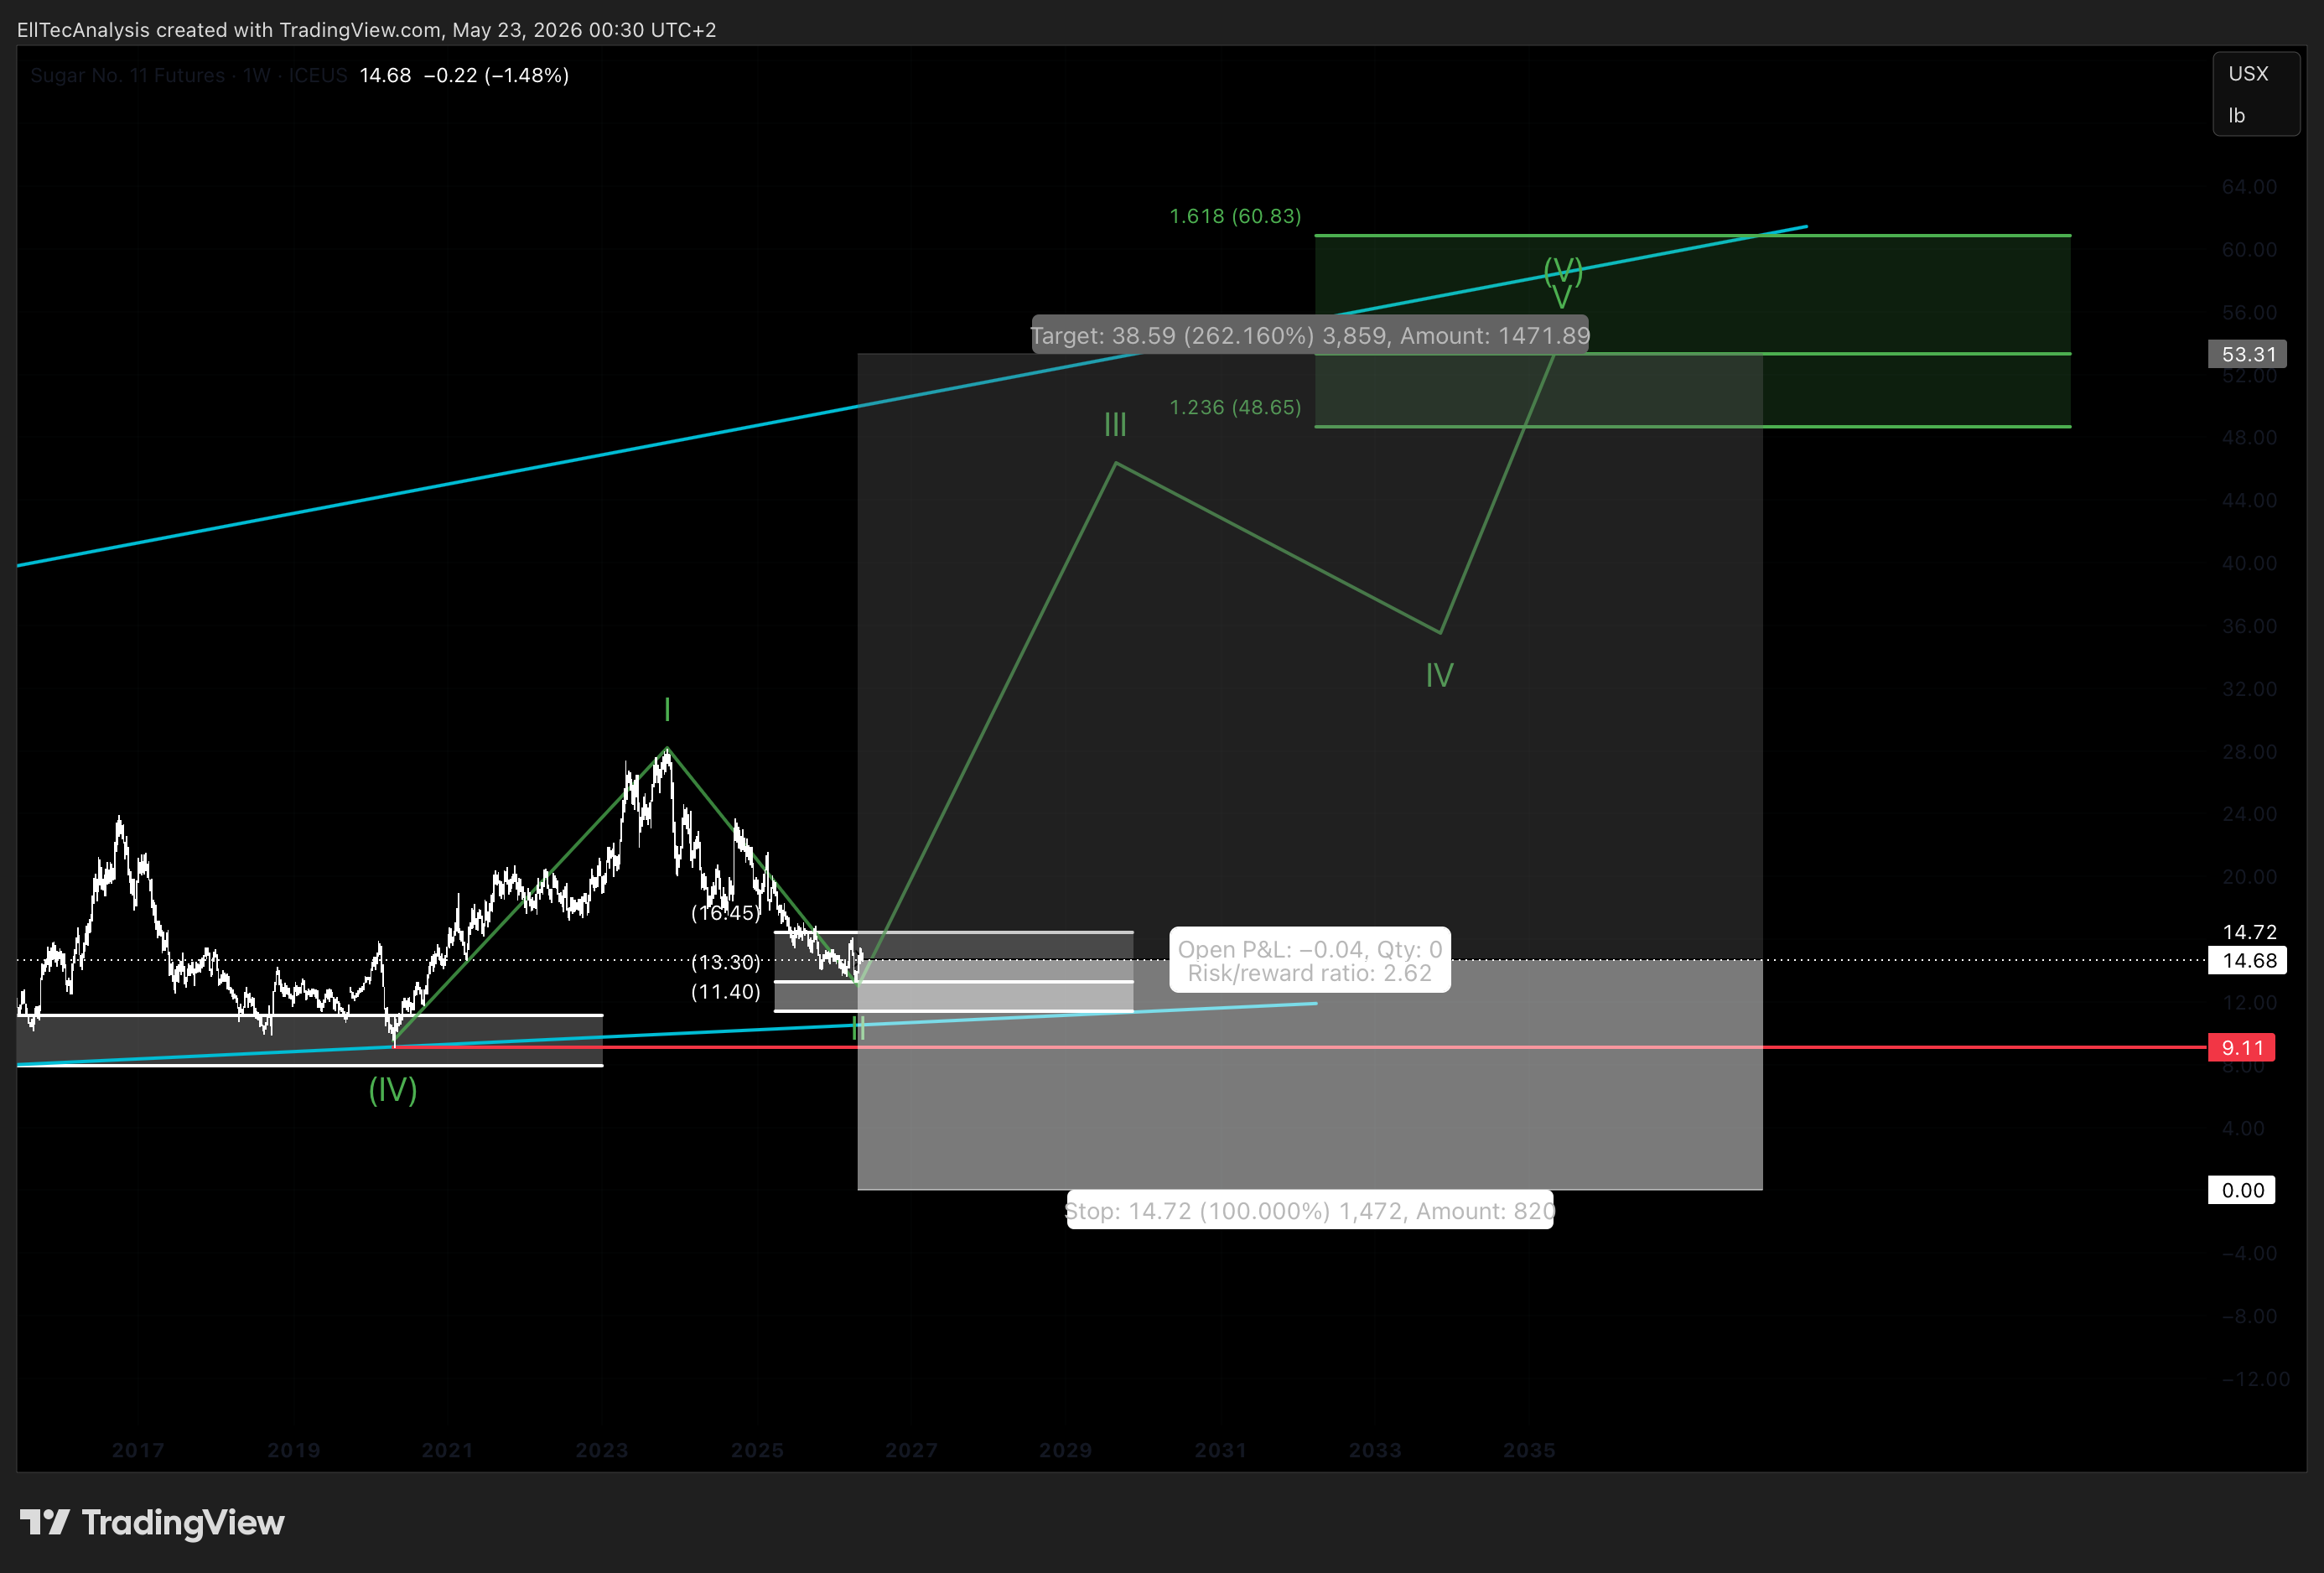
From an Elliott Wave perspective, Sugar Futures are interpreted to be completing a multi-degree structural setup that positions the commodity for a significant long-term expansion. At the broadest degree, the market has already completed a higher-degree Wave 1 impulse and a subsequent higher-degree Wave 2 correction, and is currently developing within the early stages of a higher-degree Wave 3 expansion. This macro degree context is critical — Wave 3 expansions are typically the most powerful and extended impulsive phases within any Elliott Wave cycle, frequently driven by fundamental re-rating, increased institutional participation, and expanding momentum.
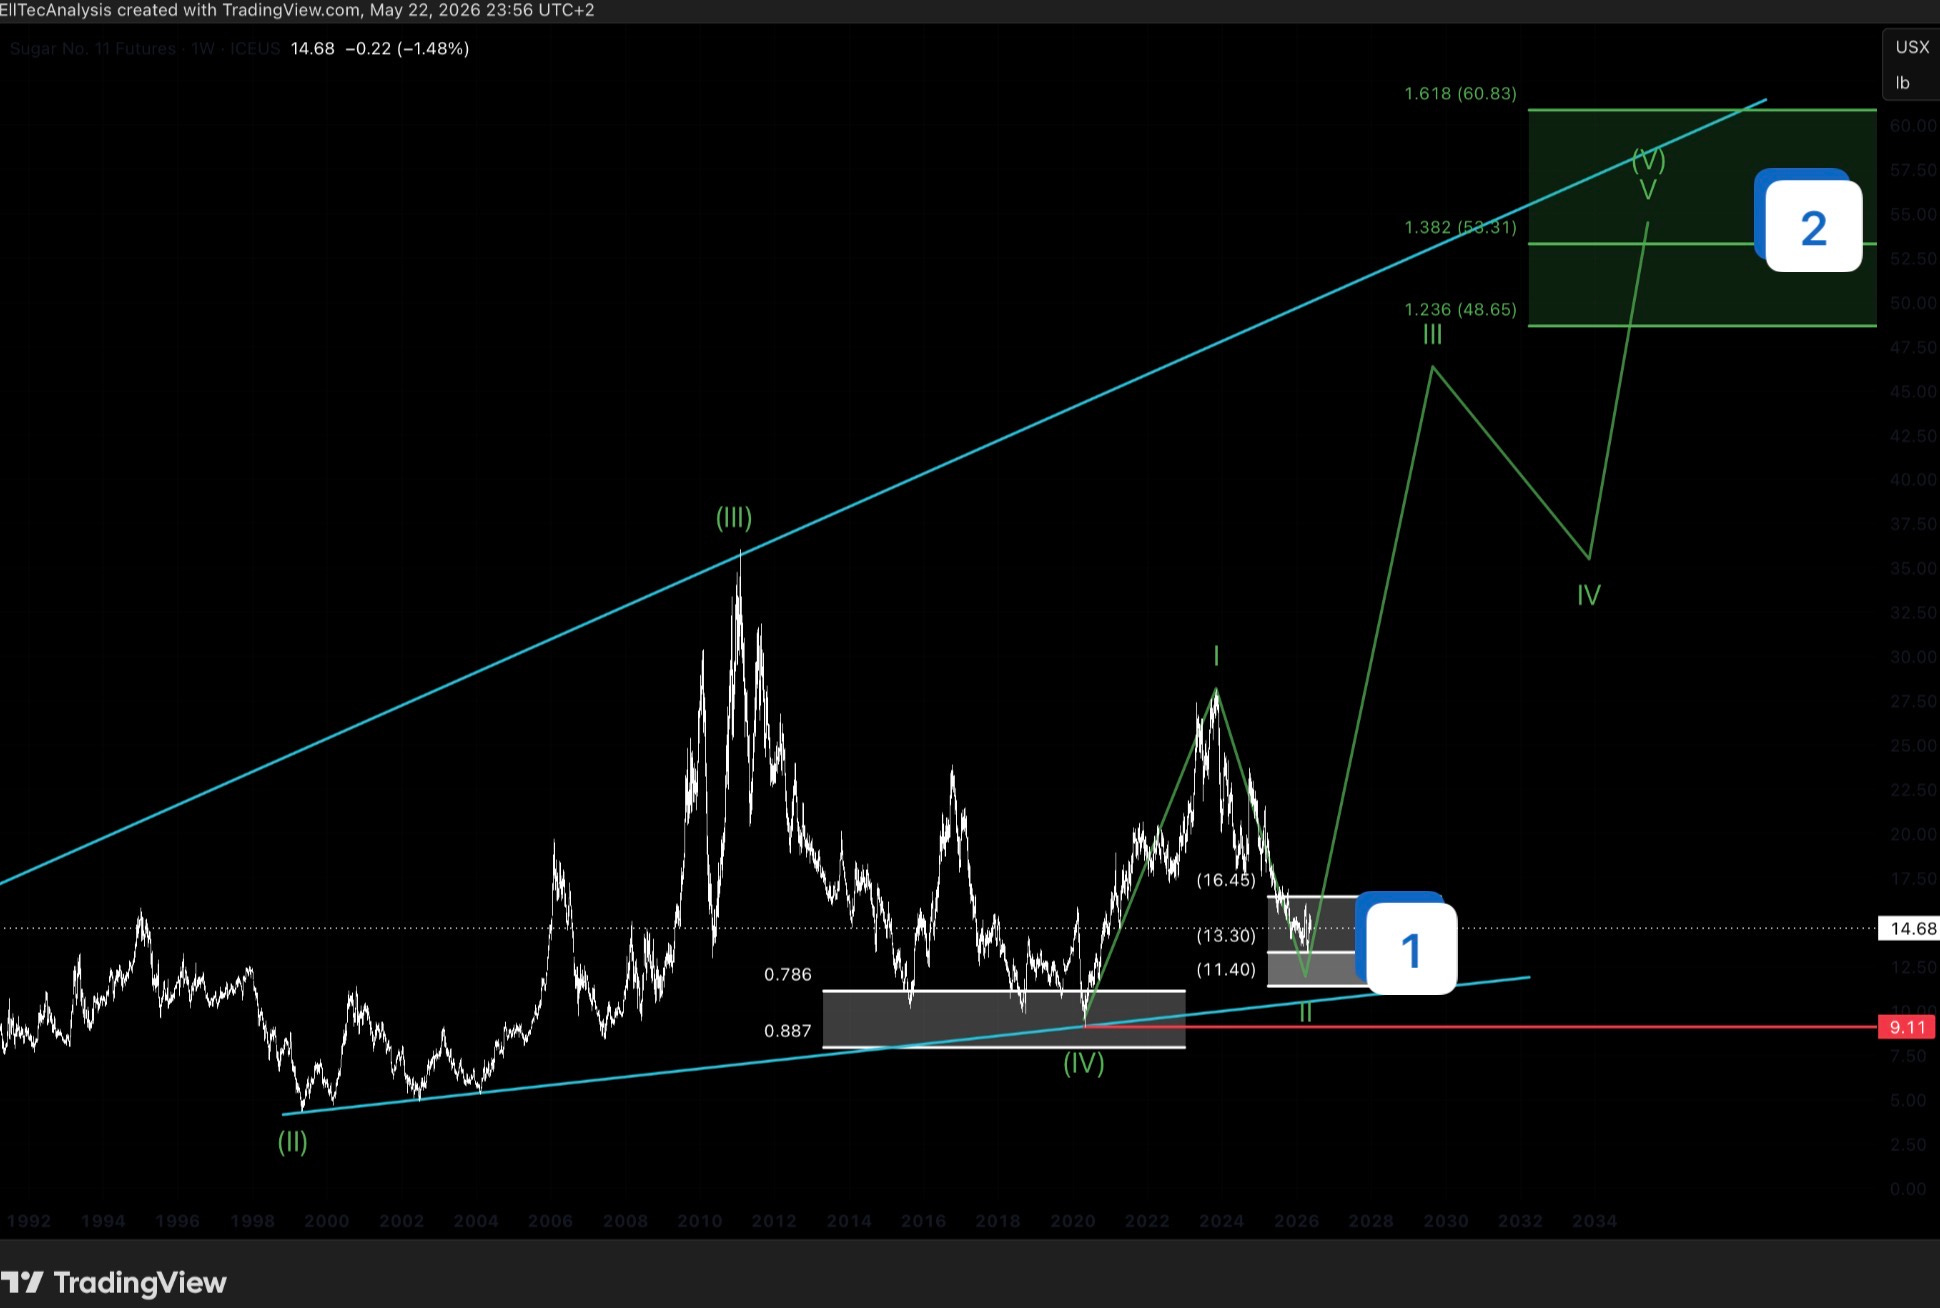
Within this higher-degree Wave 3, the current internal structure is interpreted as a leading diagonal formation, carrying the substructure 3-3-3-3-5. A leading diagonal is characterized by five sub-waves, each of which subdivides in a specific pattern defined by the diagonal type, and occurs most frequently in Wave 1 or Wave A positions within a larger impulsive structure. The first four sub-waves of this diagonal — following the 3-3-3-3 substructure — are assessed to be complete or near-complete. The fifth and final sub-wave of the diagonal, which follows the sub-structure of a five-wave impulse, is expected to provide the terminal thrust of this diagonal structure, completing the internal Wave 1 of the higher-degree Wave 3 expansion.
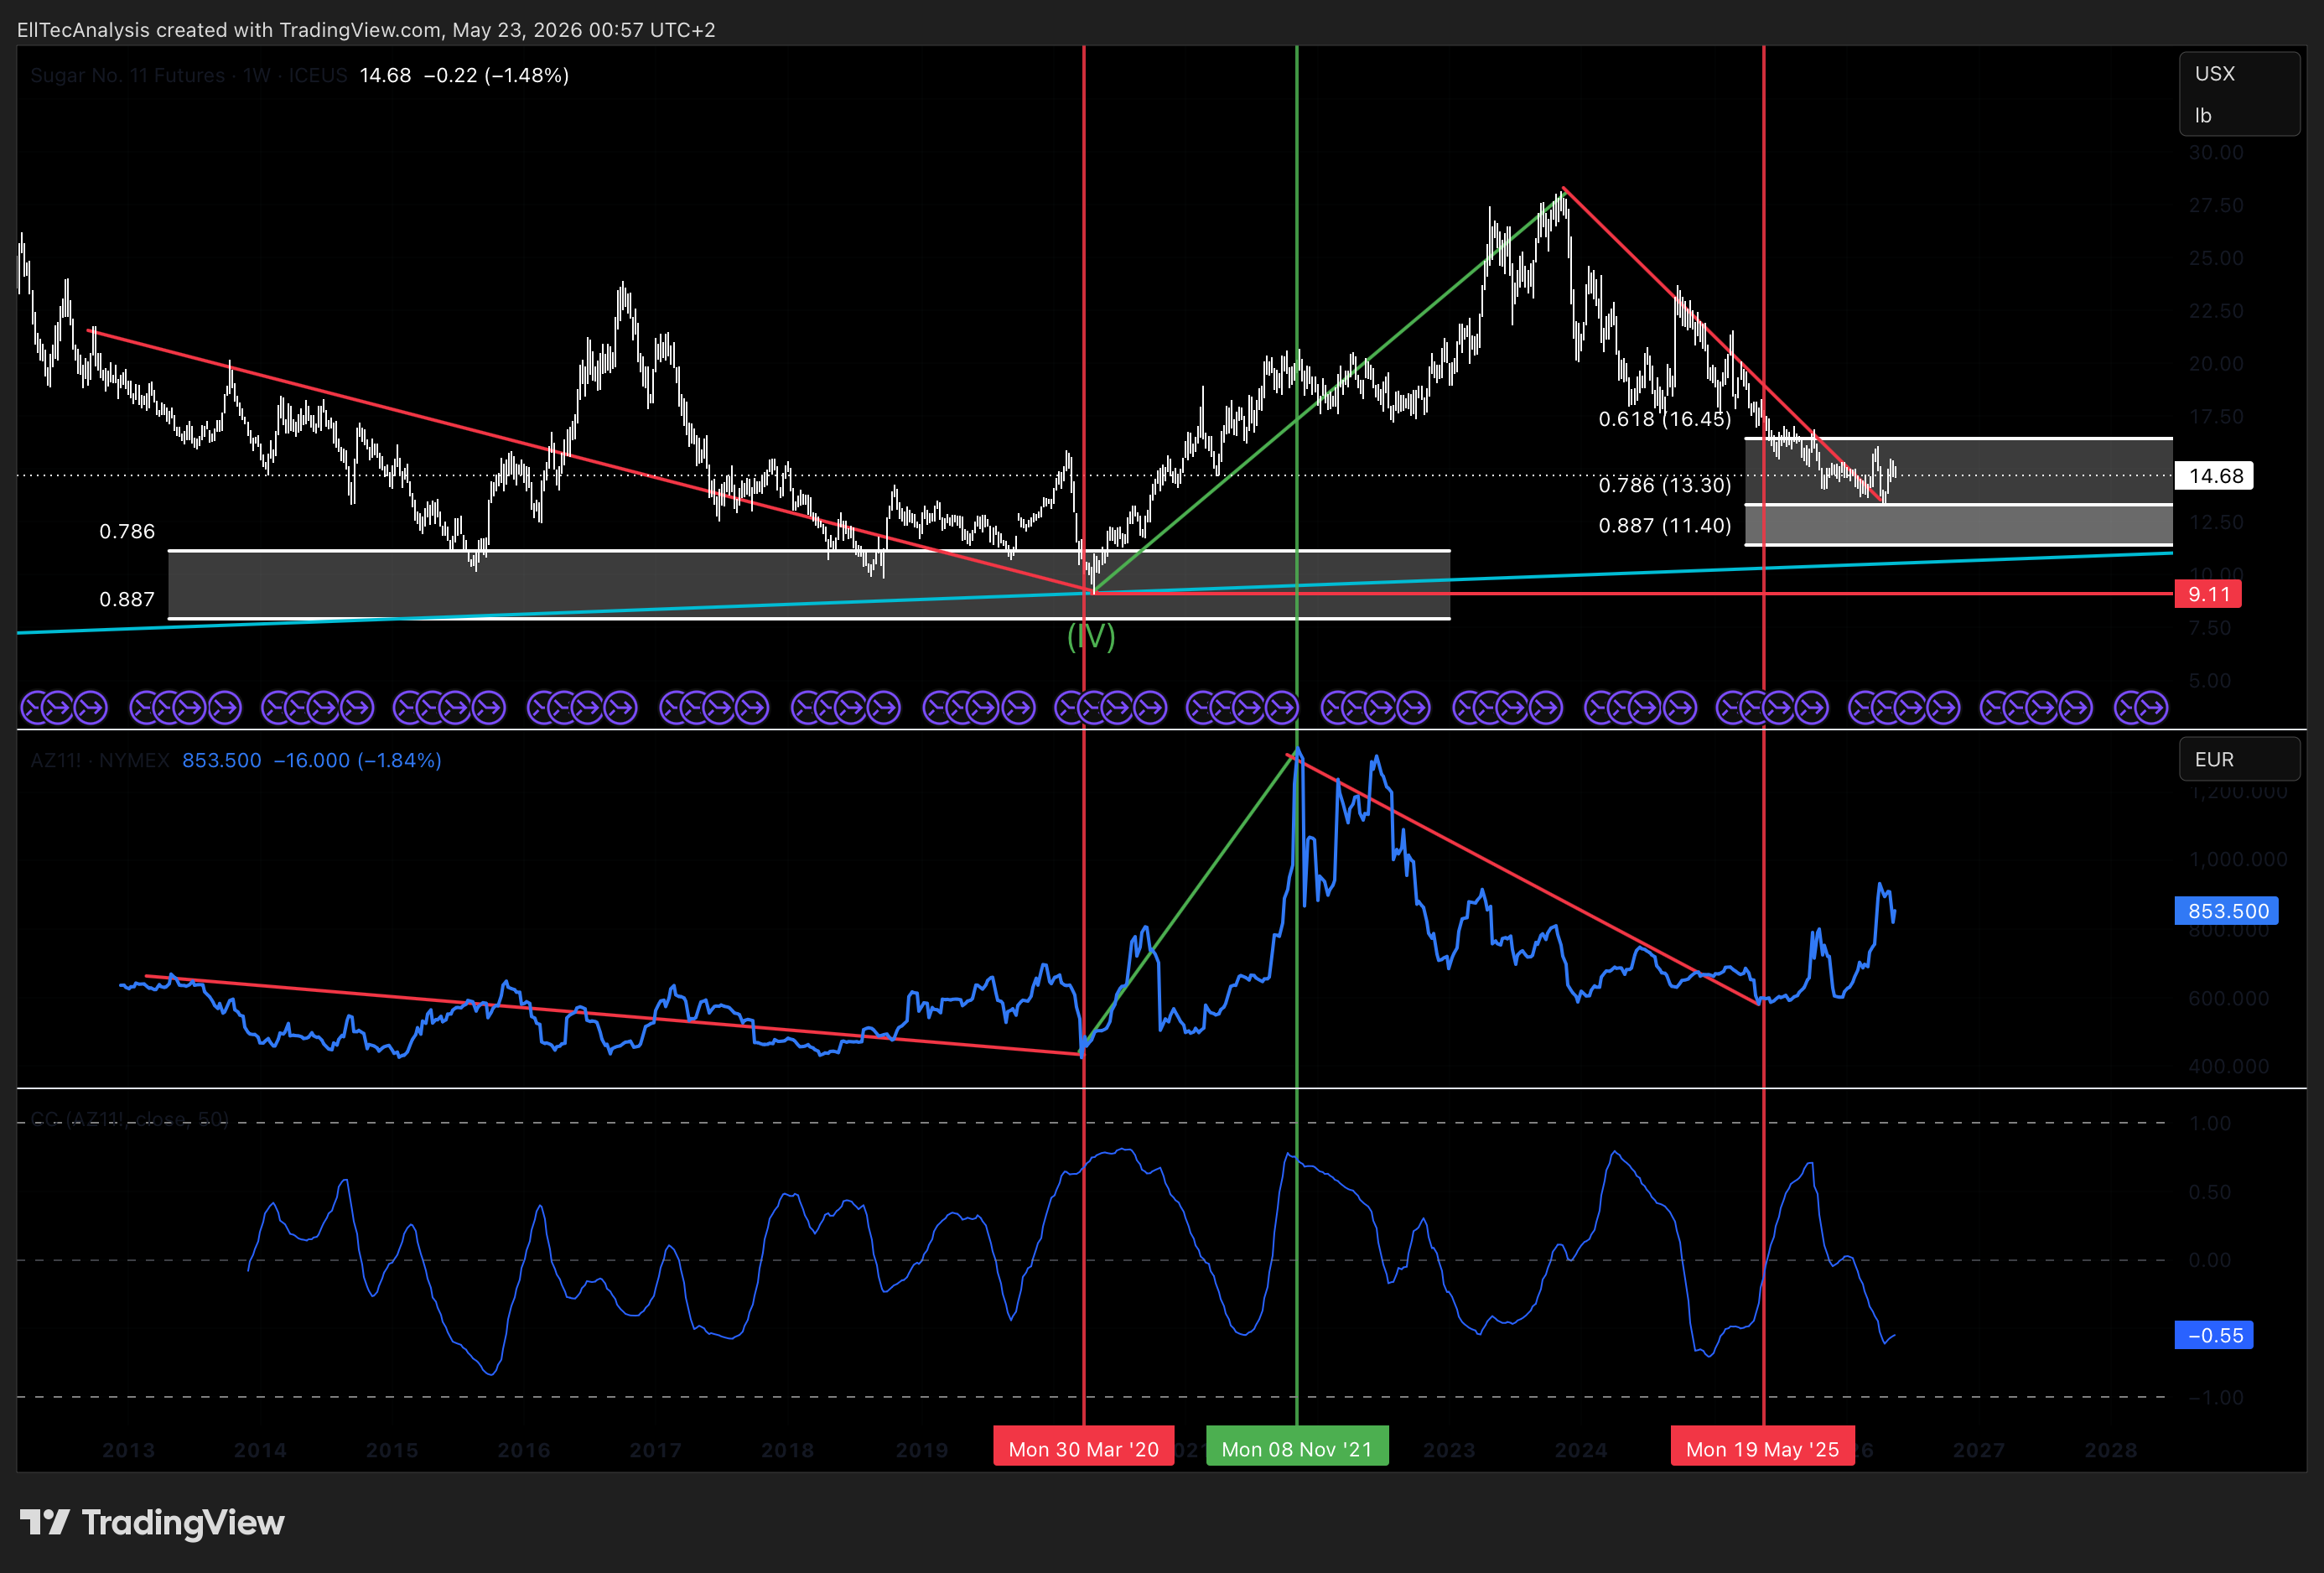
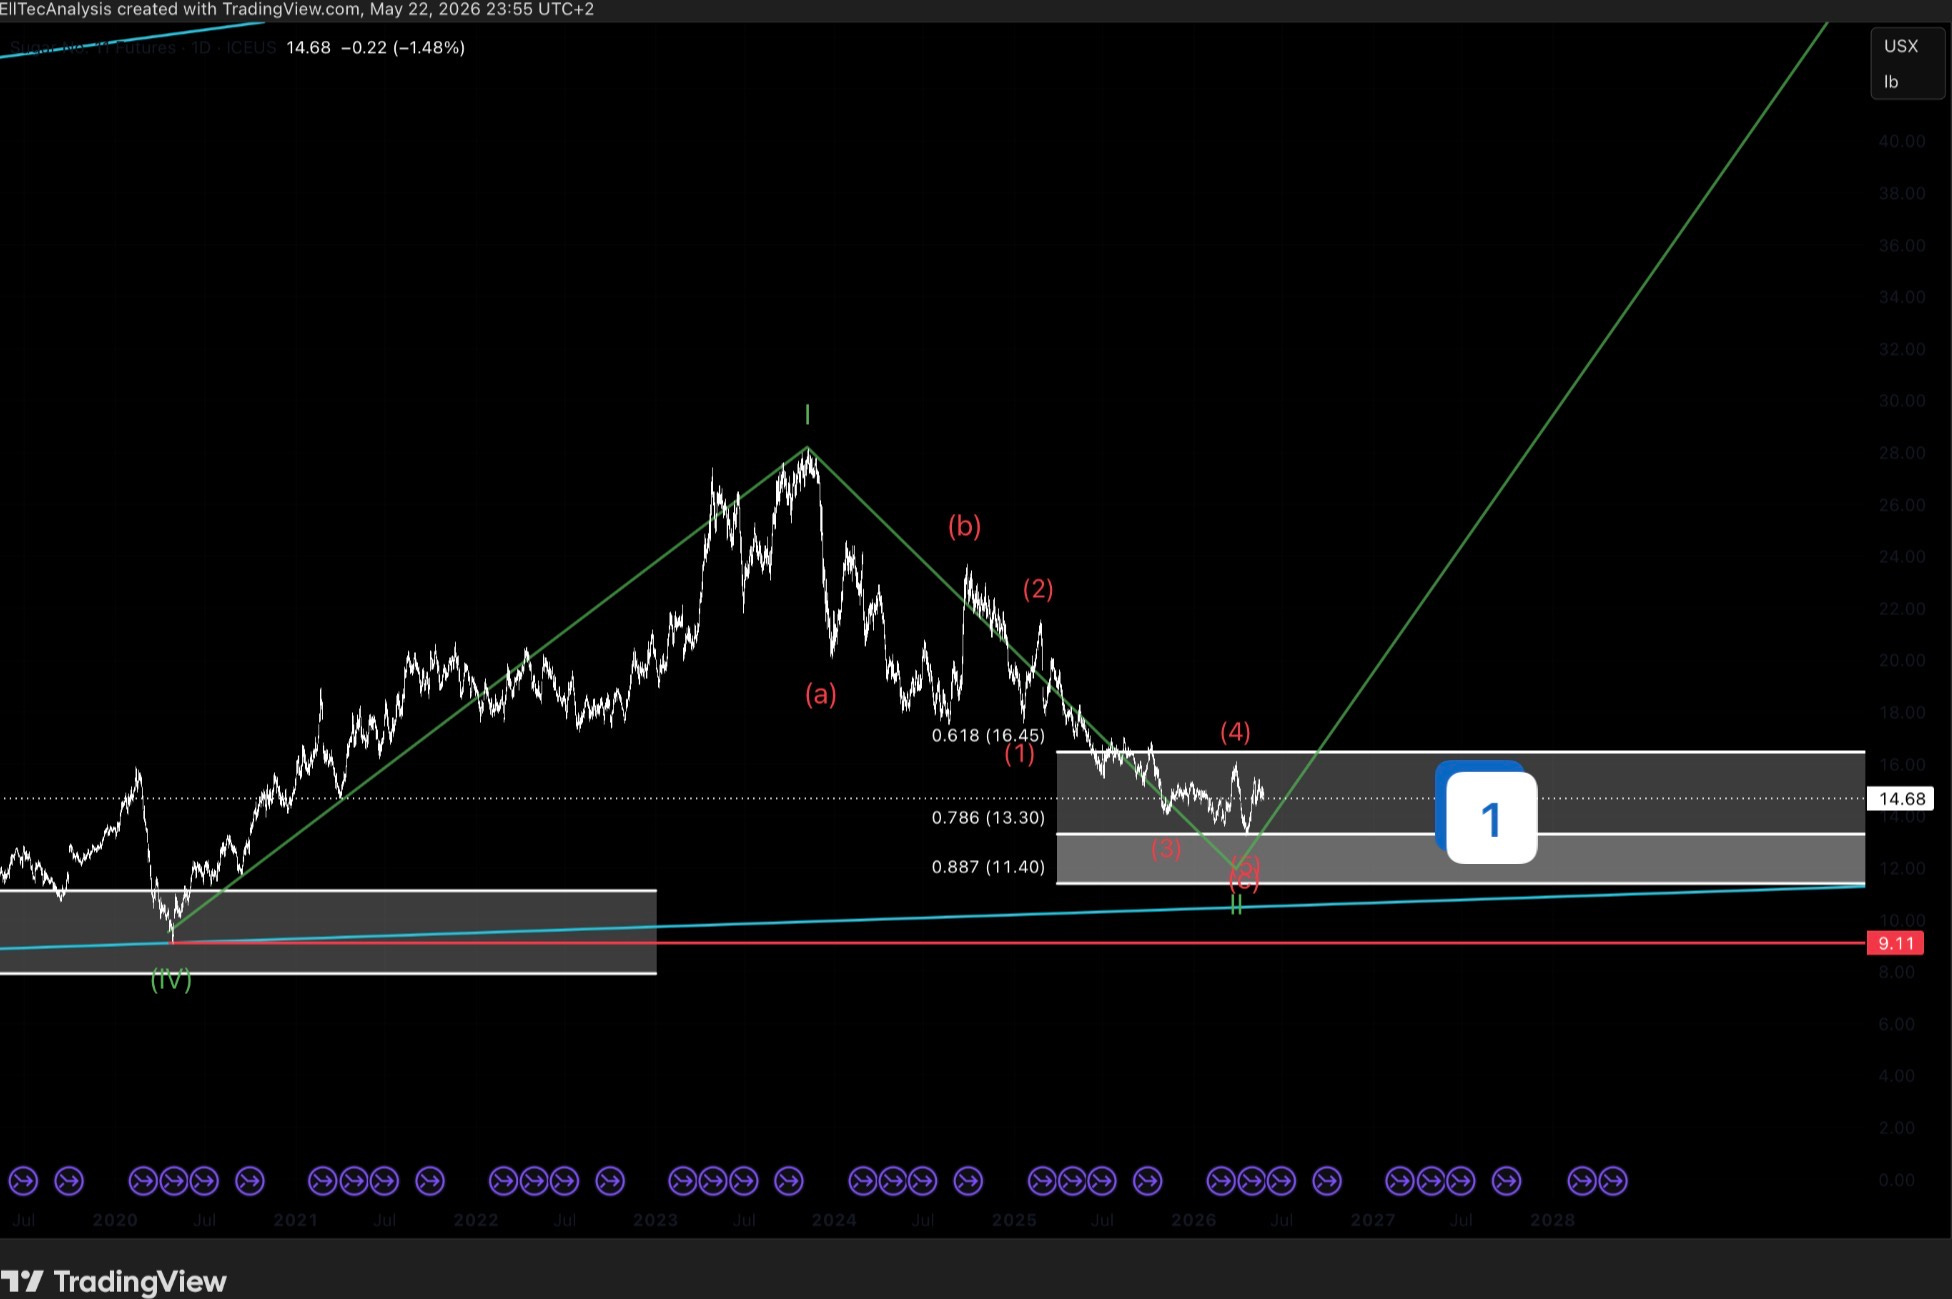
At the most immediate degree, the market is currently positioned within Target Zone 1, which represents the completion zone for the Wave 2 correction relative to the diagonal’s internal structure. The sub-wave count within the current correction is sufficiently developed to support the interpretation that Wave 2 has either already completed or is in its terminal phase. A further marginal extension of the correction deeper within Target Zone 1 remains possible, but the structural framework identifies the current zone as the high-probability reversal area from which the next impulsive Wave 3 advance within the diagonal should originate.
The invalidation level for the current Wave 2 thesis is defined at 9.11 USX per pound. A sustained close below this level would violate the structural parameters of the corrective wave and require a comprehensive recount of the internal wave degrees. As long as 9.11 USX holds, the bullish structural interpretation remains fully intact.
Following the Wave 2 completion, the anticipated sequence is: a Wave 3 impulse upward, a Wave 4 counter-correction, and a final Wave 5 advance completing the diagonal structure. This full five-wave diagonal sequence would constitute the completion of the internal Wave 1 at the next higher degree. A Wave 2 correction at that degree would then follow, providing a secondary entry opportunity before the dominant Wave 3 of the higher-degree Wave 3 expansion resumes to the upside.
Target Zone 1 — Current Wave 2 Completion Zone:
- Upper boundary: 16.45 USX per pound (61.8% Fibonacci retracement)
- Lower boundary: 9.11 USX per pound (structural invalidation level)
This zone defines the current reversal area for the Wave 2 correction. The market is presently trading within this range, and EllTec Analysis identifies this as the primary accumulation zone for the structural long position.
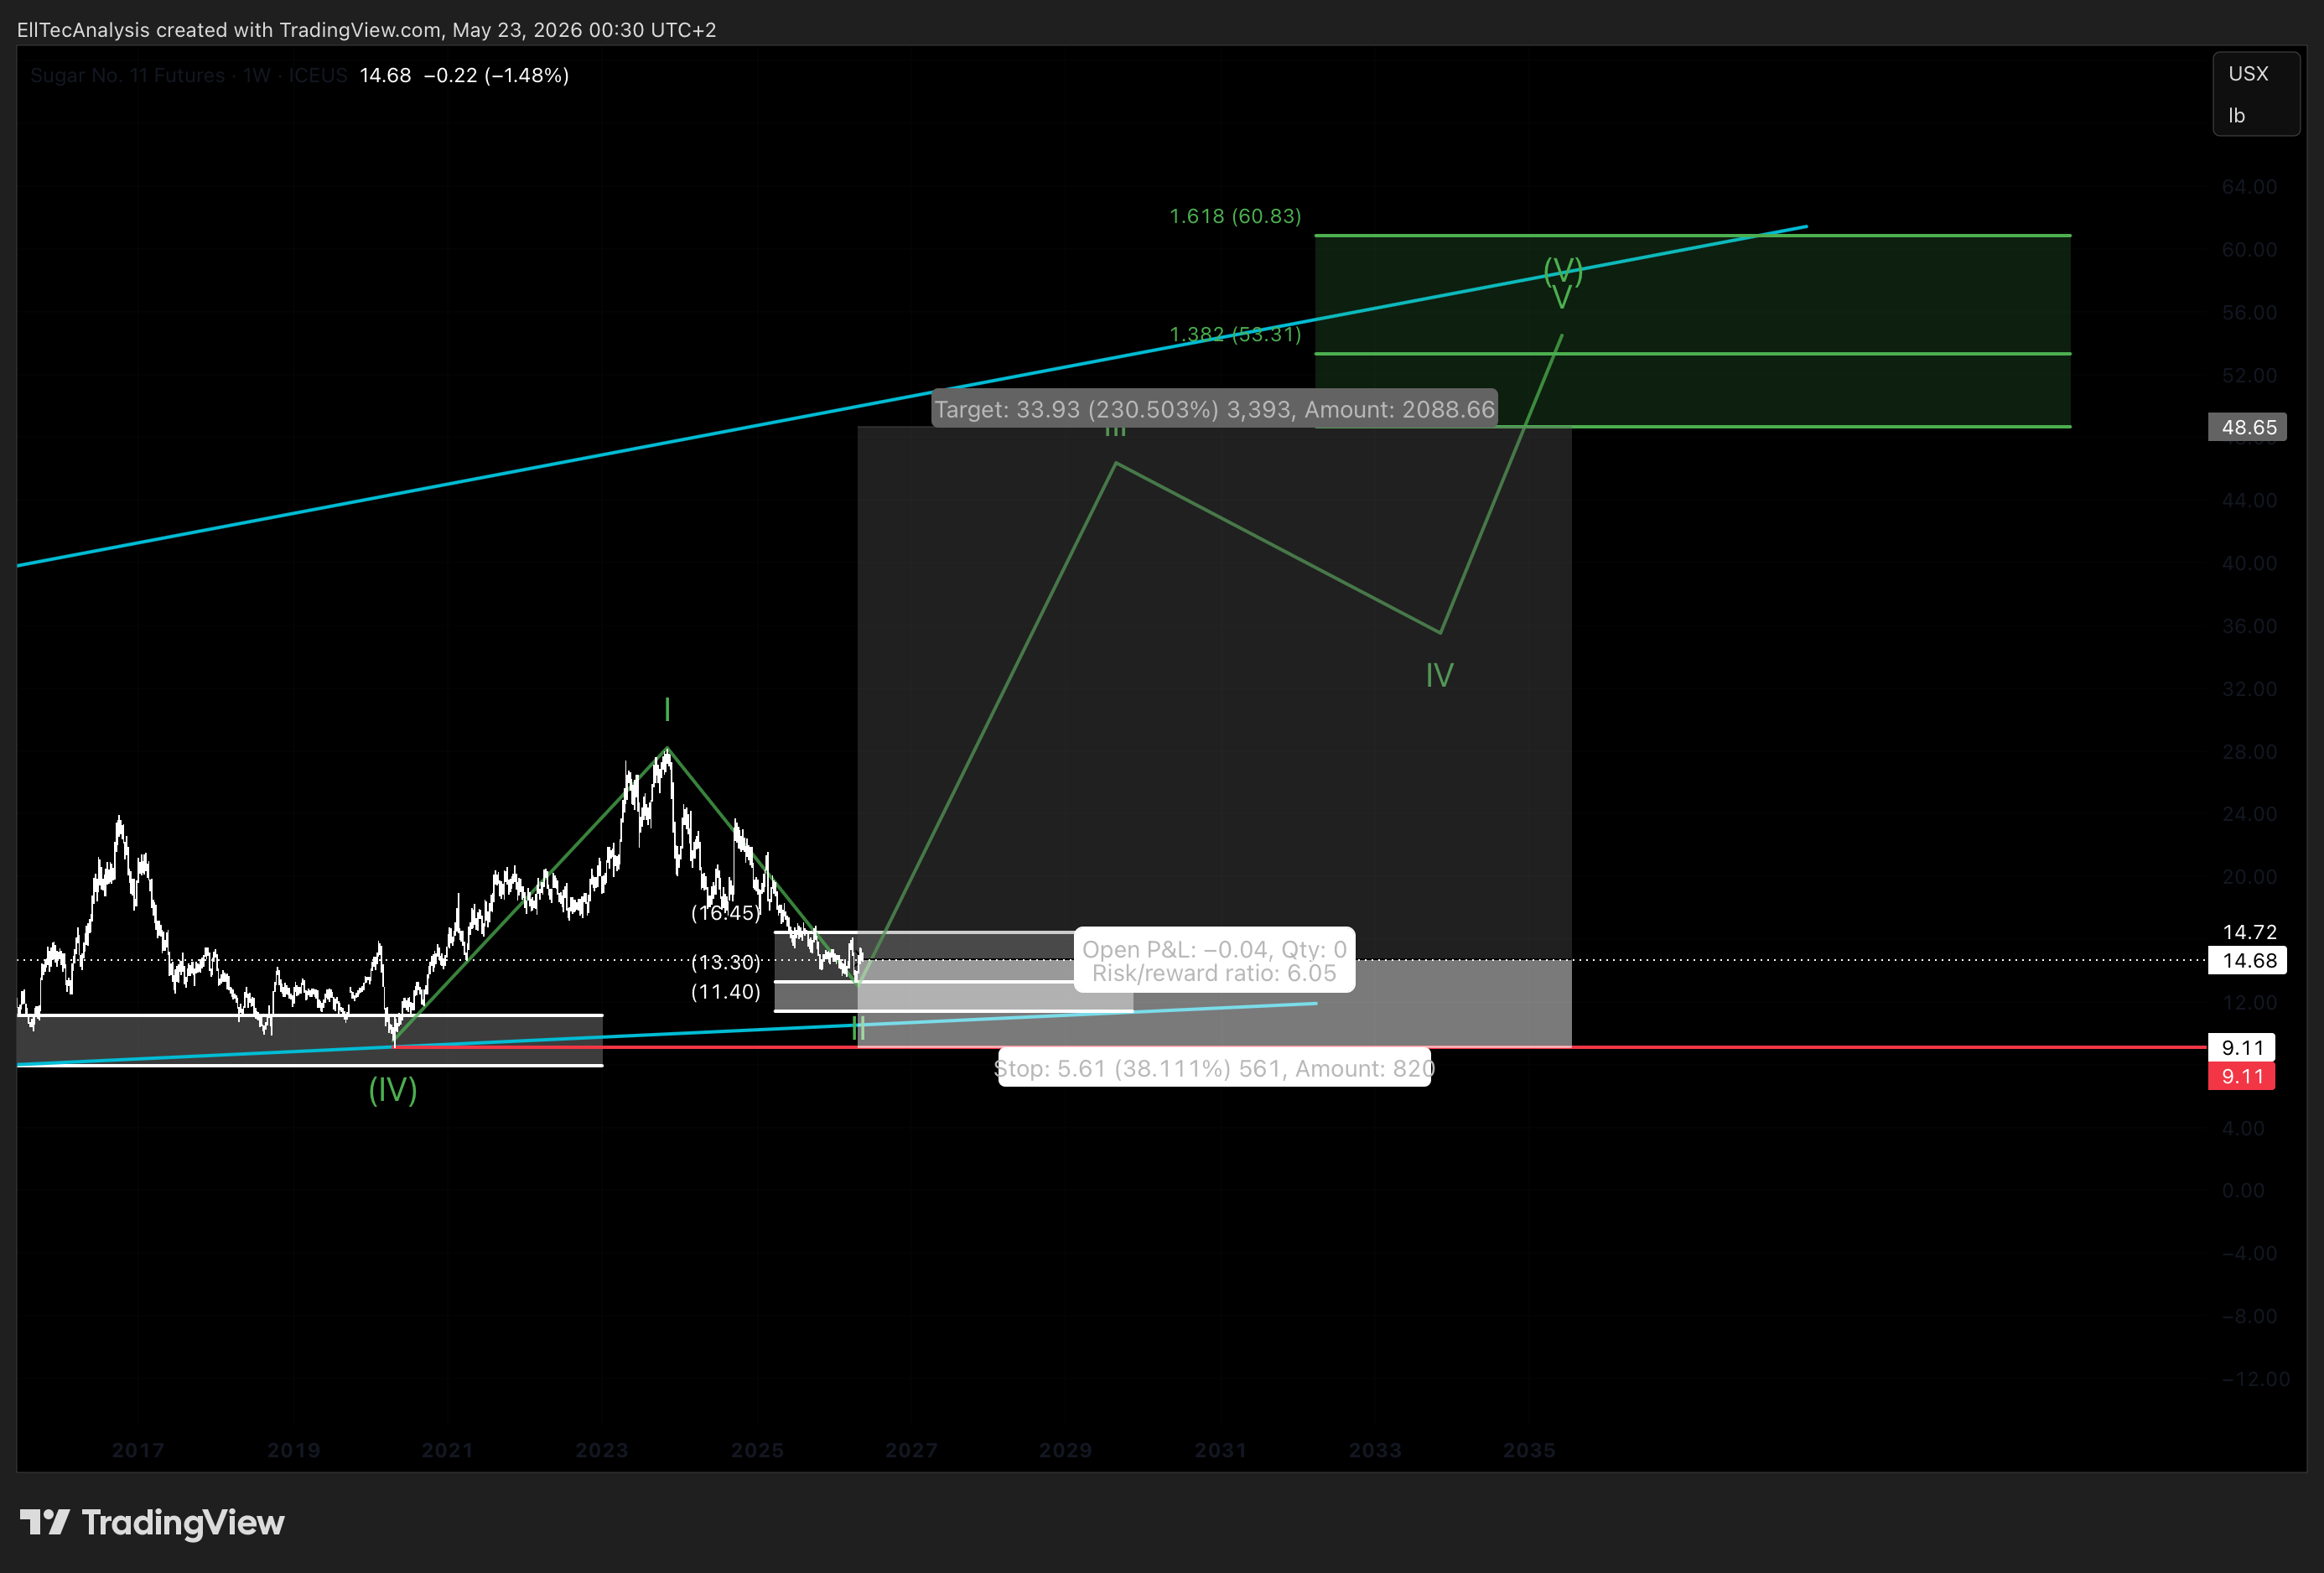
Target Zone 2 — Wave 5 of Diagonal / Internal Wave 1 Completion:
- Lower boundary: 48.65 USX per pound (1.236 Fibonacci extension)
- Upper boundary: 16.83 USX per pound (1.618 Fibonacci extension)
Target Zone 2 represents the projected completion area for the full five-wave diagonal structure, marking the terminal zone for the Wave 5 sub-wave of the diagonal and the completion of the internal Wave 1 at the next higher degree. EllTec Analysis expects the market to reach this zone following a multi-phase impulsive advance from Target Zone 1.
Target Zone 3 — Higher-Degree Wave 3 Completion:
- Lower boundary reference: 110.06 USX per pound (1.618 Fibonacci extension)
Target Zone 3 marks the projected terminal zone for the full higher-degree Wave 3 expansion. This is the most powerful and extended macro degree target in the structural sequence, representing the completion of the dominant impulsive Wave 3 that follows from the structural setup currently developing. A reaction from this zone would define the subsequent higher-degree Wave 4 correction before the final Wave 5 advance.
Target Zone 4 — Very Long-Term Wave 5 Terminal Objective:
- Lower boundary reference: 176.25 USX per pound (2.618 Fibonacci extension)
Target Zone 4 represents the very long-term terminal objective for the full impulsive cycle at the highest degree tracked in this analysis, corresponding to the completion of a higher-degree Wave 5 within an even larger overarching Wave 1 structure. EllTec Analysis recommends this as the absolute maximum holding zone for any position entered in the current structural setup. The risk-reward profile at this level does not justify continued exposure, and a full position exit is recommended upon reaching this zone.
4. Alternative Scenarios
Scenario 1: Break Below 9.11 USX — Wave Structure Invalidation and Recount Required
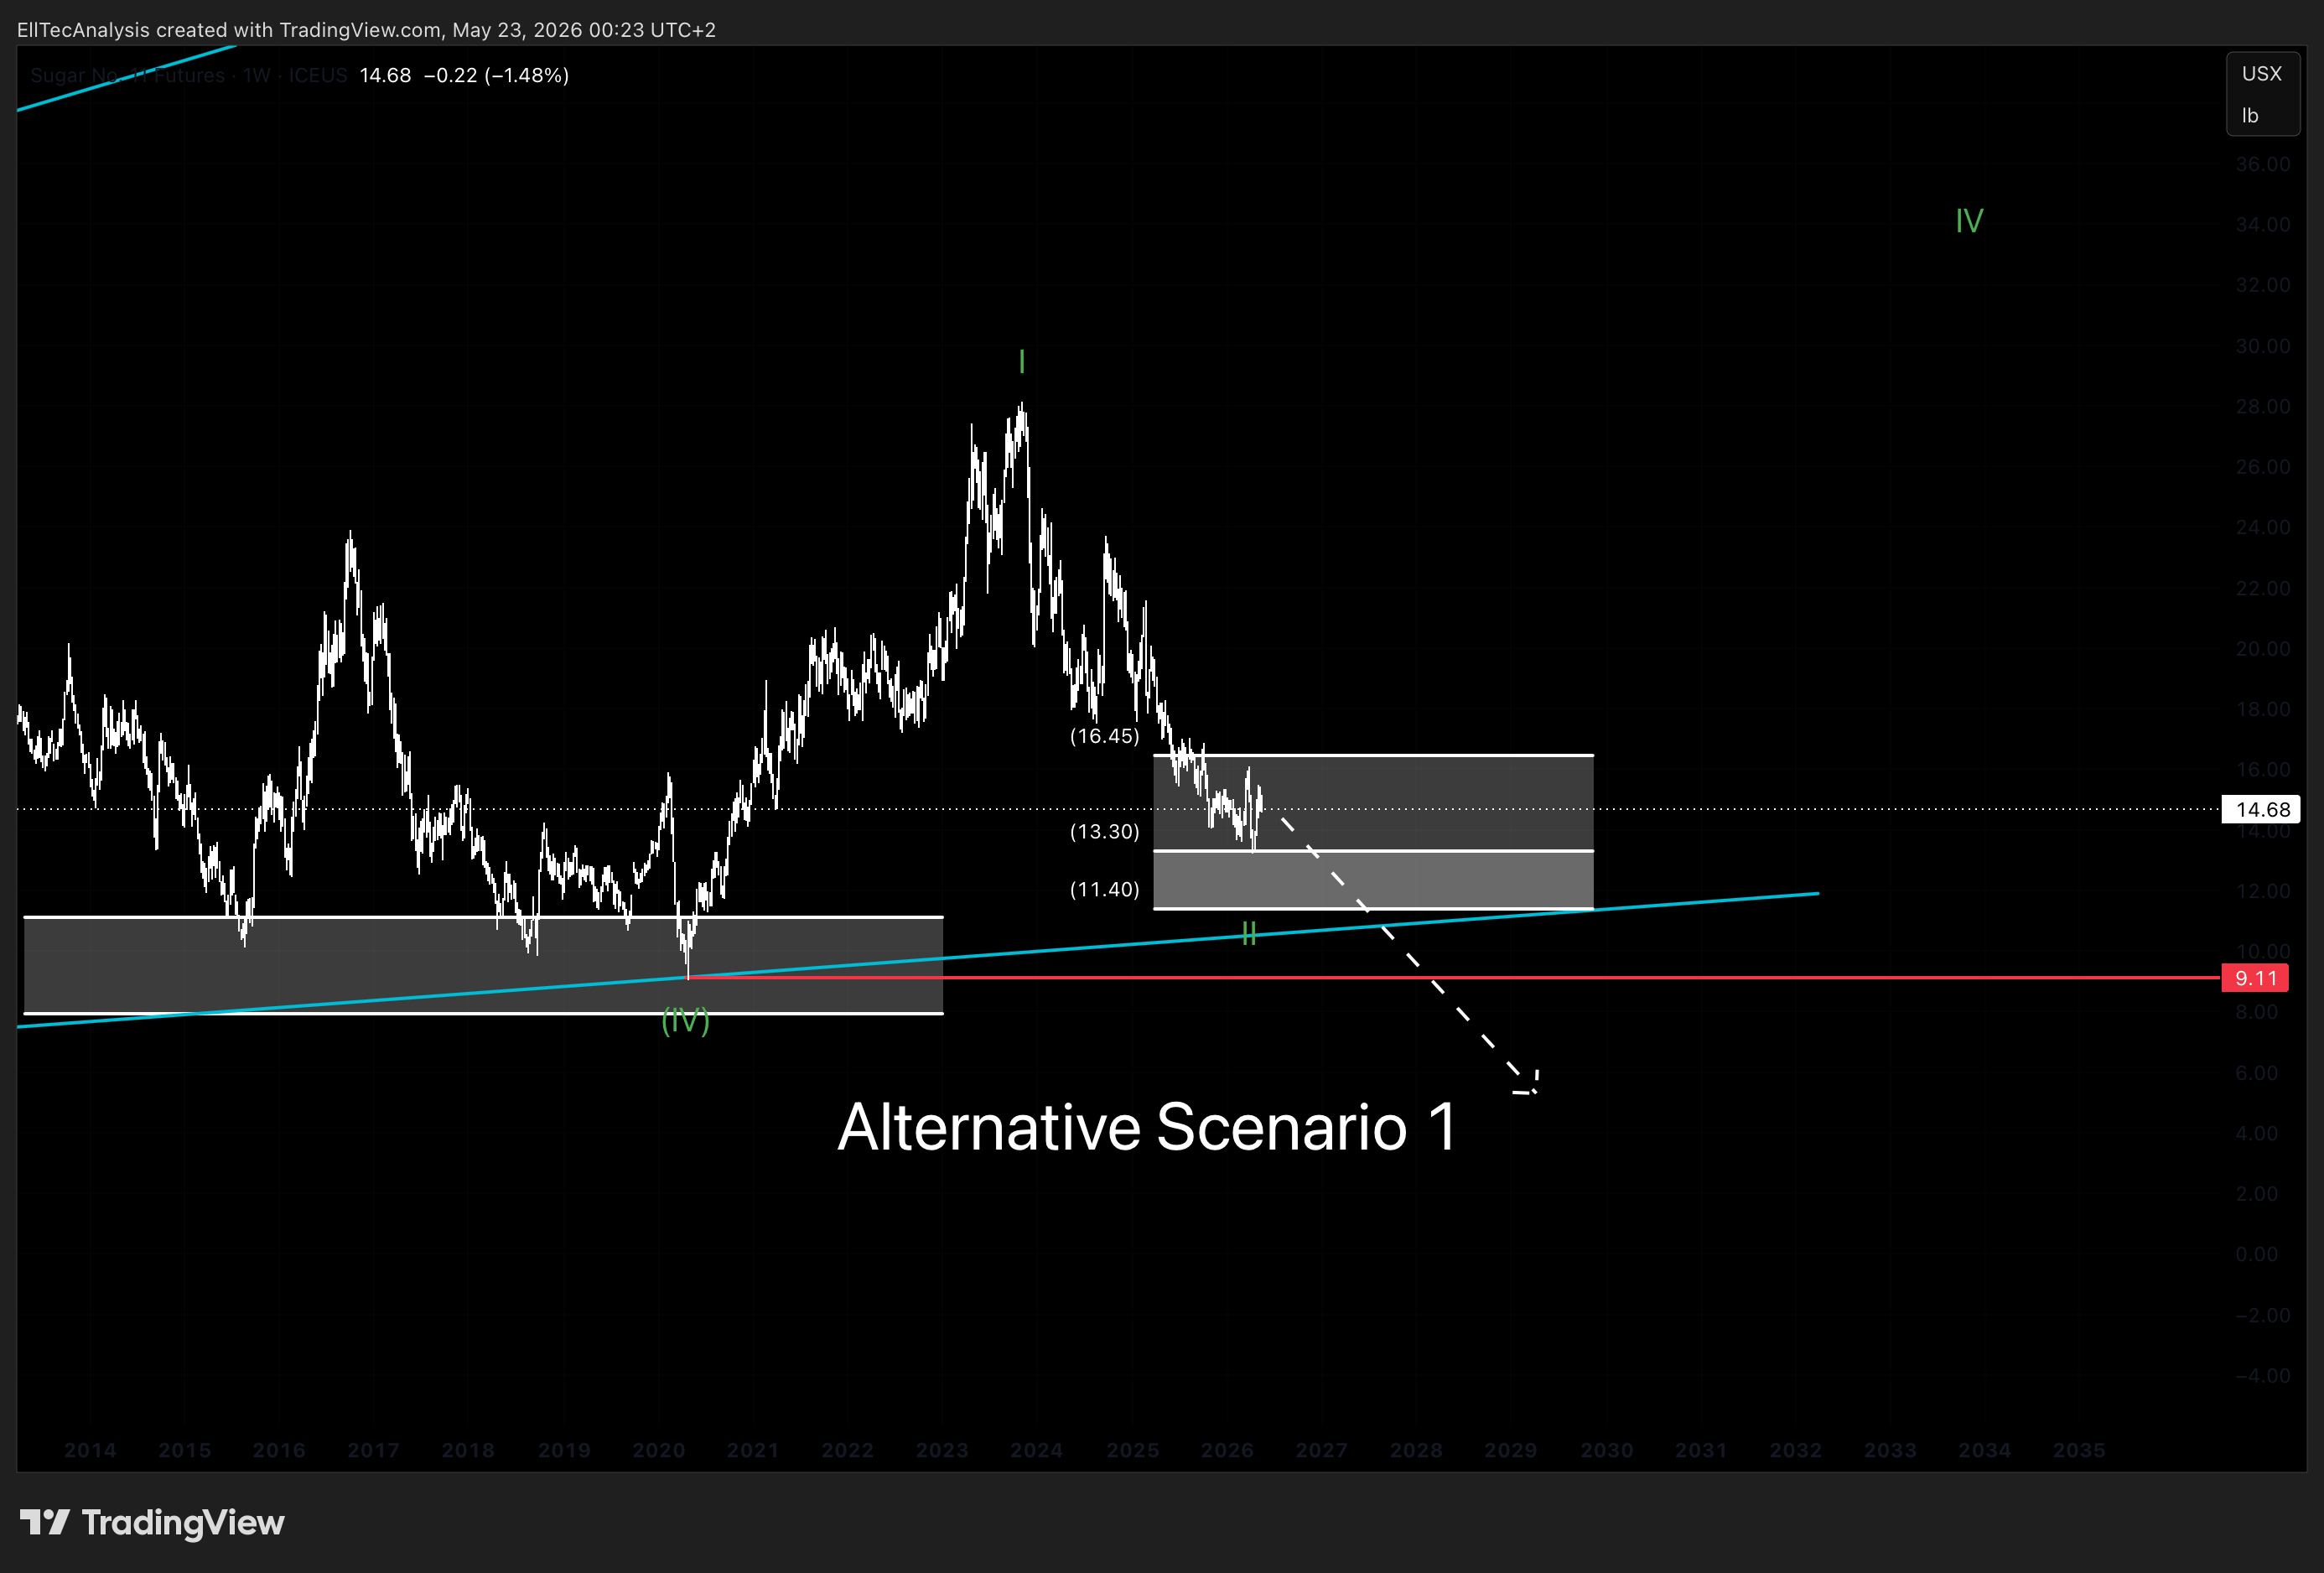
A sustained close below 9.11 USX per pound would invalidate the current Wave 2 corrective interpretation and force a fundamental reassessment of the wave degrees across the entire structure. This scenario would imply that the corrective phase is either deeper in degree than currently assessed or that the wave count requires a structural recount from a higher base. In this case, EllTec Analysis would suspend the current bullish framework, reassess the internal subdivisions at all degrees, and publish an updated interpretation. New lower support zones and revised Fibonacci structures would be calculated and communicated accordingly.
Scenario 2: Diagonal Misidentification — Corrective B-Wave Structure
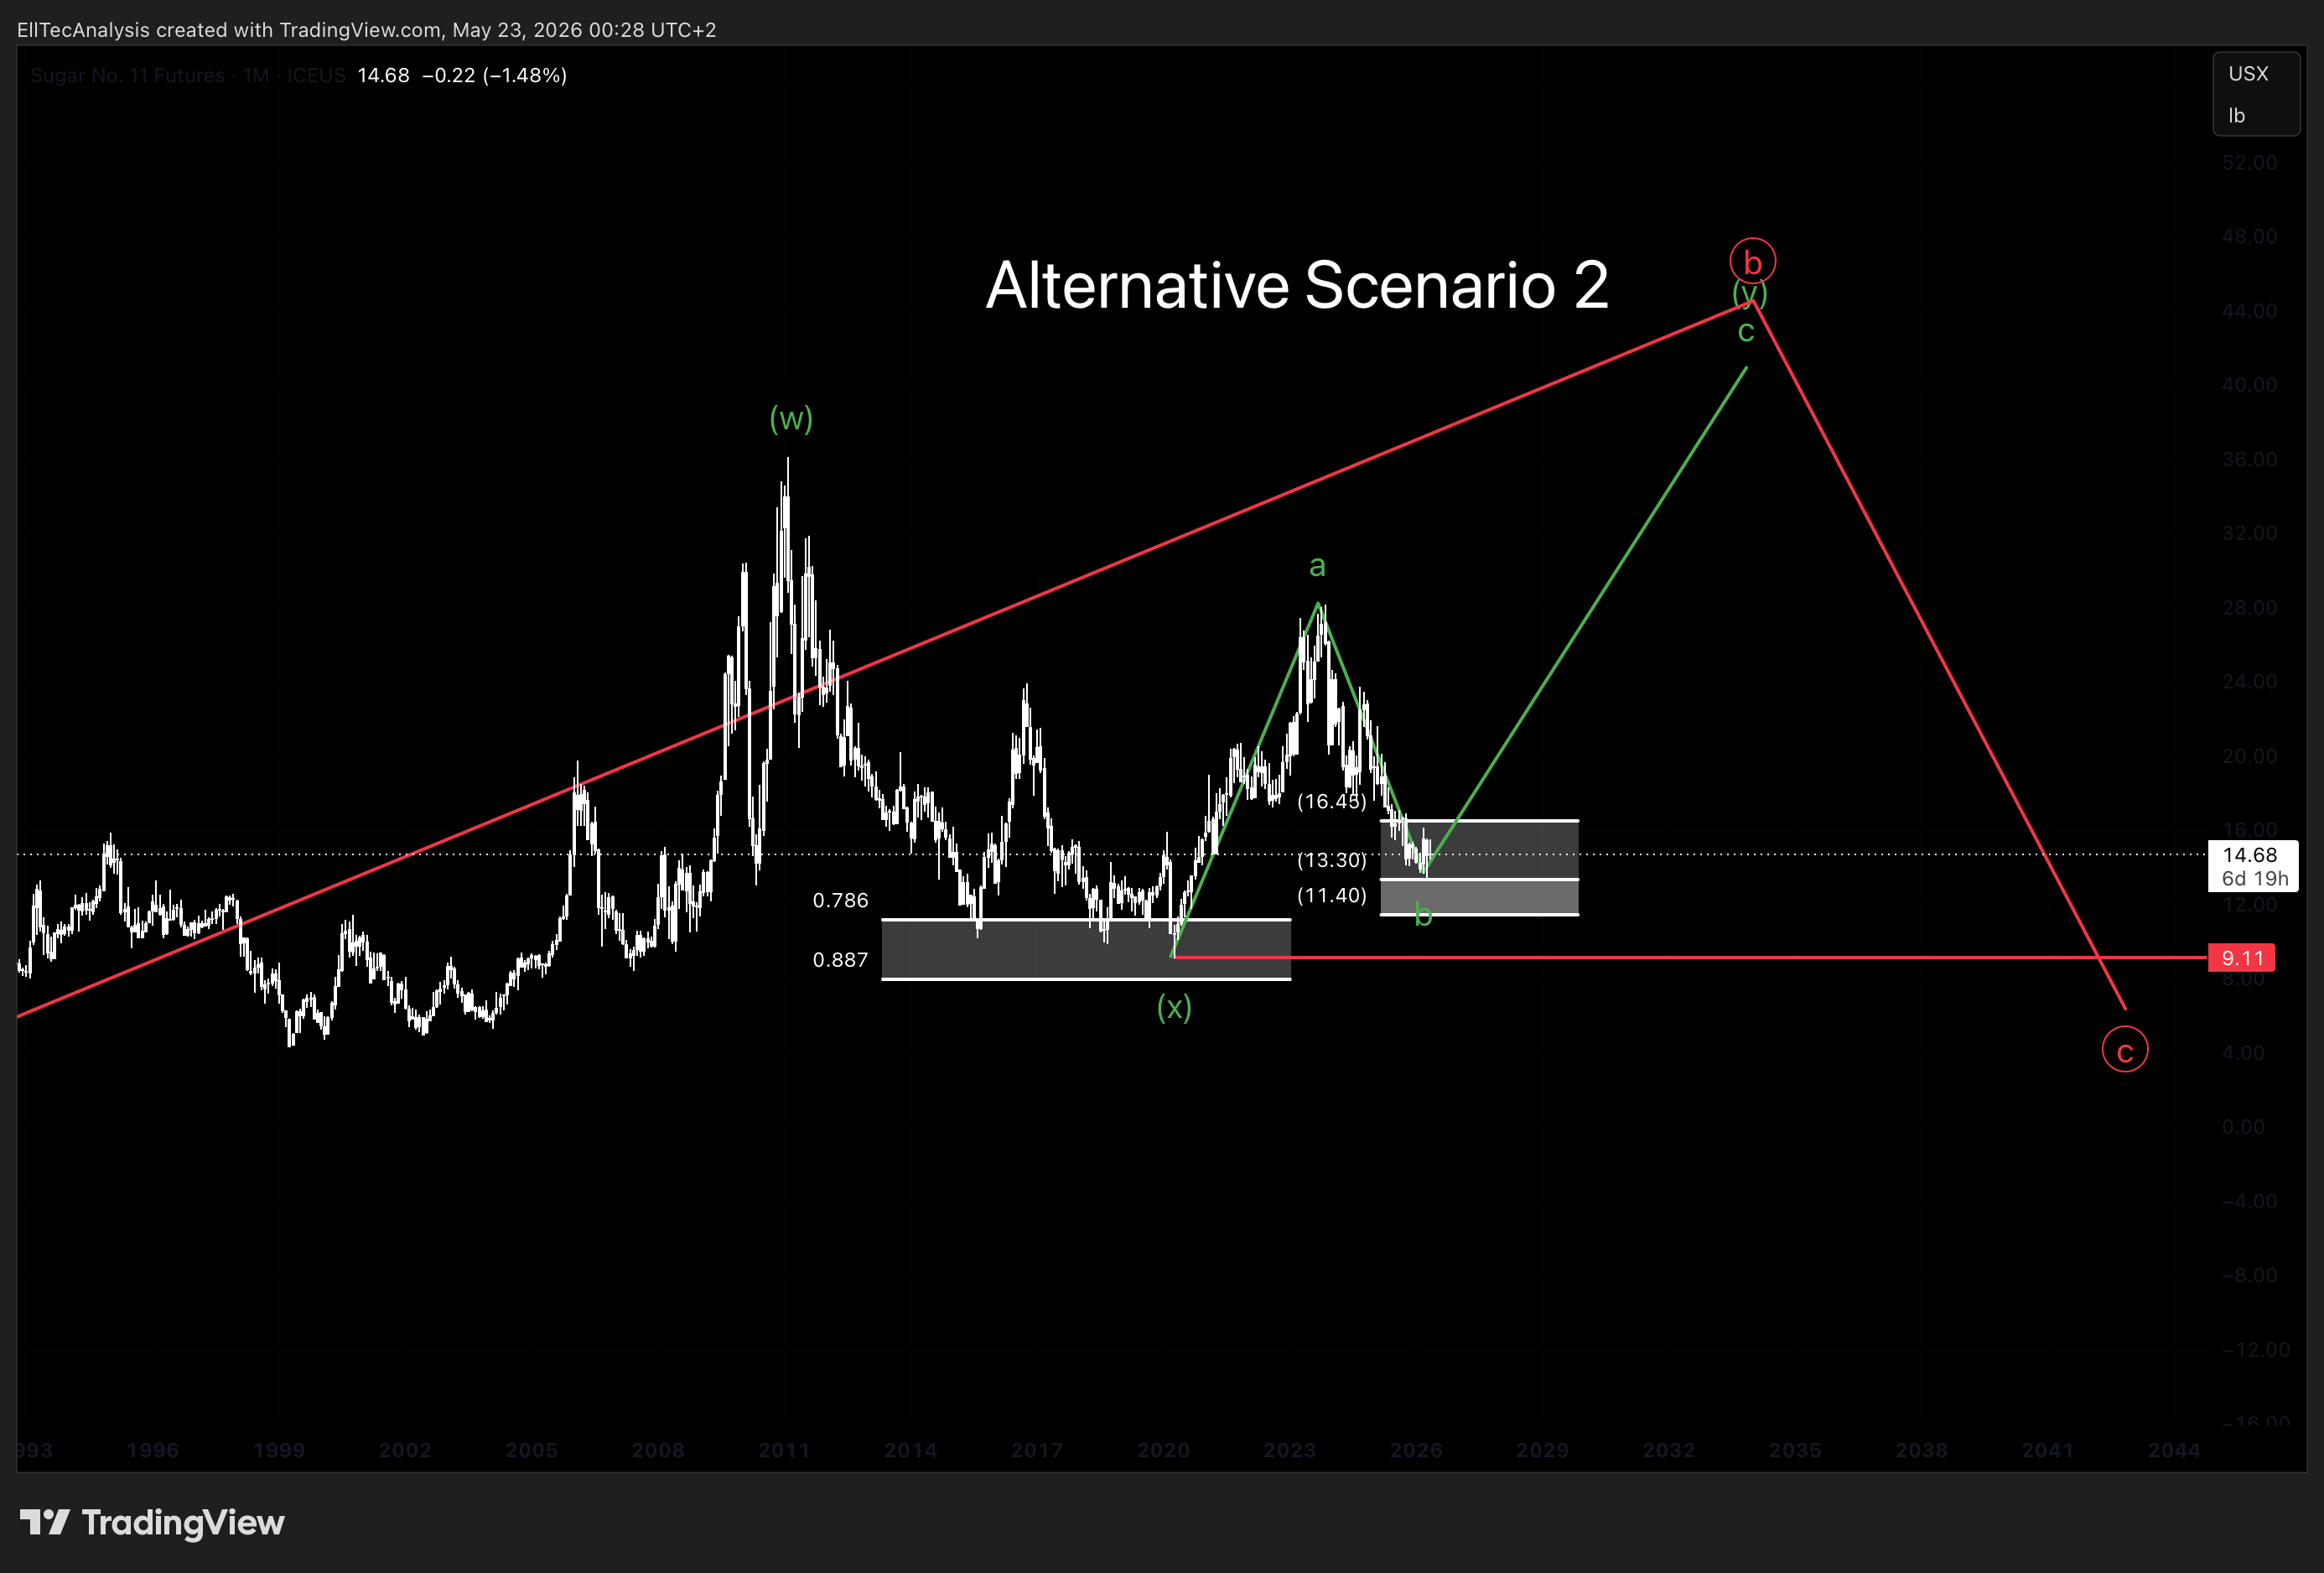
An alternative structural interpretation considers the possibility that the current formation is not a leading diagonal but rather an internal B-wave correction within a higher-degree complex corrective structure. Under this reading, the sub-waves currently labeled as Wave 3 and Wave 4 of the diagonal would instead represent the WX legs of a WXY corrective pattern, with the market currently forming the Y-wave component. In this scenario, the anticipated upside move from the current zone would represent the Y-wave advance rather than a clean impulsive Wave 3 expansion, meaning that the move could terminate well short of Target Zone 2 before reversing into a potentially significant C-wave decline to new lows. This scenario becomes more credible if the internal structure of the current advance from Target Zone 1 displays corrective rather than impulsive characteristics. EllTec Analysis will monitor the unfolding sub-wave structure closely and communicate any necessary adjustments to the primary count.
5. Potential Trading Plan
The trade framework for Sugar Futures reflects the high-conviction structural setup identified within Target Zone 1, balanced against the acknowledged uncertainty of the sub-wave count at the current juncture. The asymmetric risk-reward profile of the multi-year wave expansion thesis justifies an immediate and decisive entry approach rather than a staged accumulation strategy.
Entry Framework:
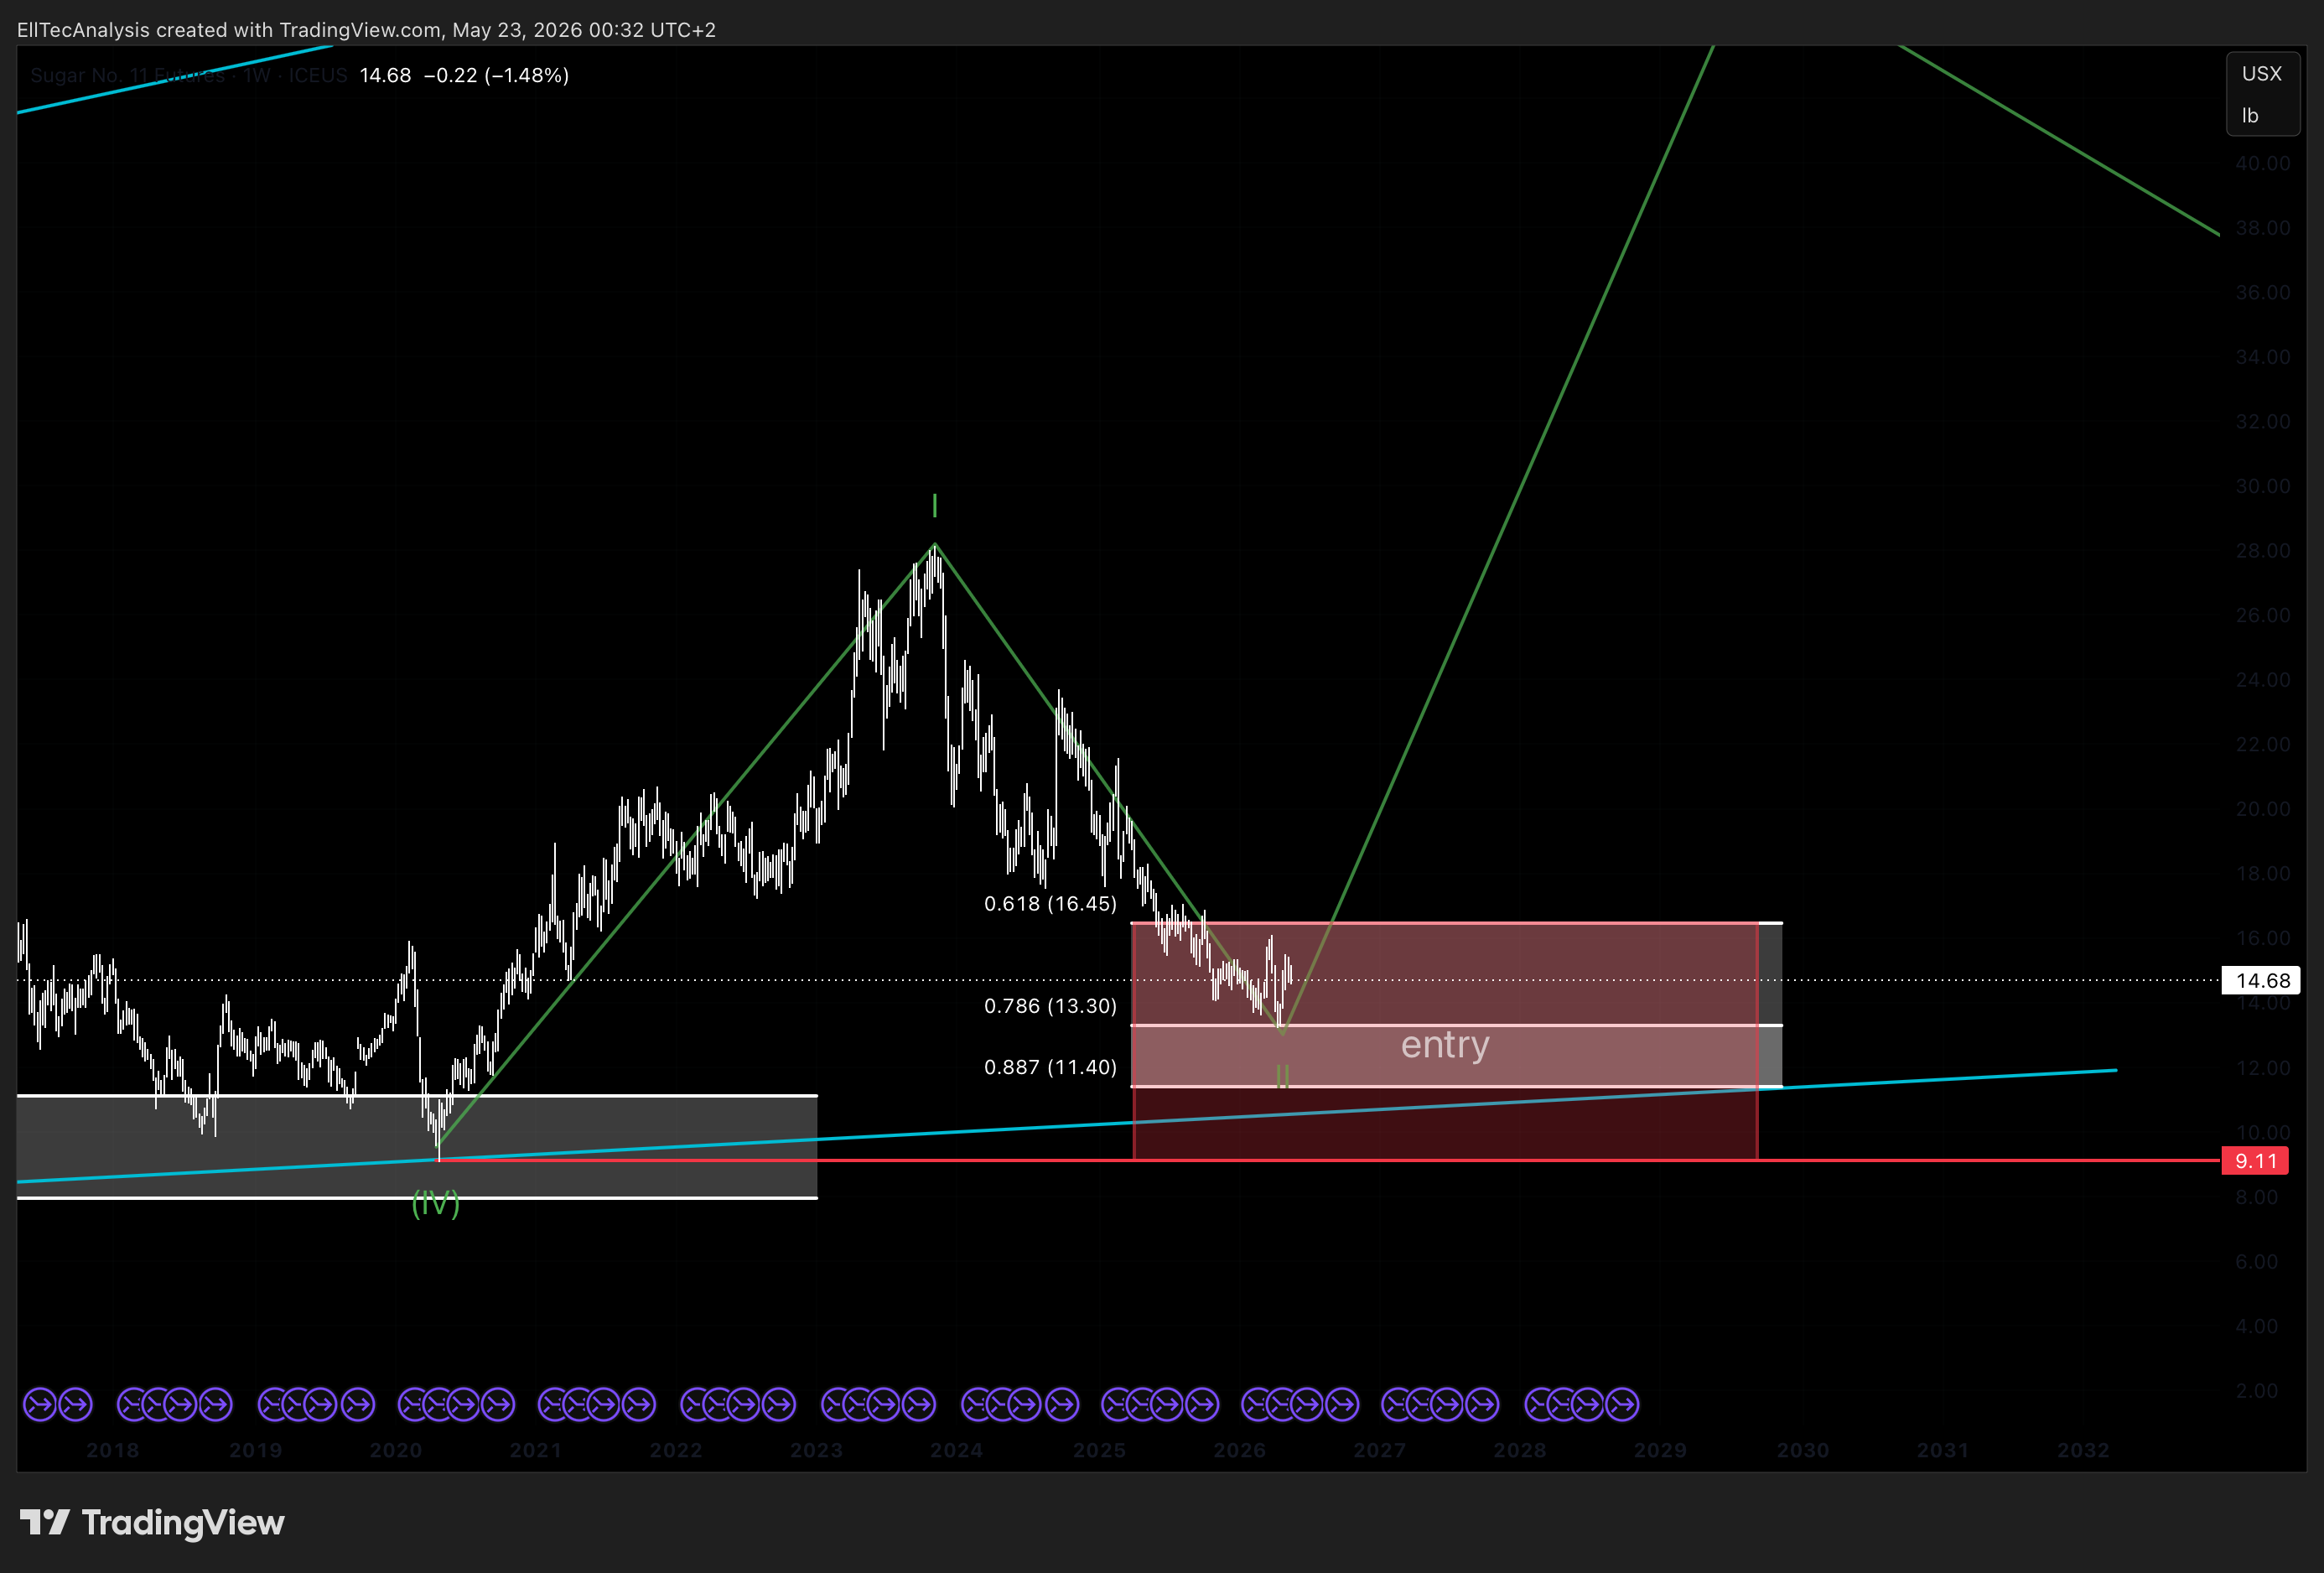
- Full desired allocation within Target Zone 1 — between 16.45 USX per pound and 9.11 USX per pound
EllTec Analysis recommends establishing the complete intended position within Target Zone 1 at current levels, without waiting for a deeper retracement toward the lower boundary of the zone. The structural rationale is that the Wave 2 correction may already be complete based on the existing sub-wave count, and any further delay in establishing the position introduces the risk of missing the initial impulsive Wave 3 launch from this zone. The magnitude of the multi-degree expansion thesis — projecting a potential move from current levels into the 48.65 to 110.06 USX range over multiple years — makes partial commitment or excessive caution structurally inconsistent with the identified opportunity.
Stop Loss:
EllTec Analysis does not recommend a conventional stop loss for this position. The structural basis for this recommendation lies in the multi-year time horizon of the thesis and the extreme asymmetry between the downside invalidation risk at 9.11 USX and the projected upside targets. Given the long history of sugar futures trading and the commodity’s irreplaceable role in global food systems, a position entered within Target Zone 1 carries a structural quality that justifies holding through interim volatility without a hard stop. That said, investors who require defined downside parameters can set a discretionary stop loss at 9.11 USX per pound, at which point the structural thesis would be invalidated and the position would no longer be supported by the wave framework.
Profit Target Framework:
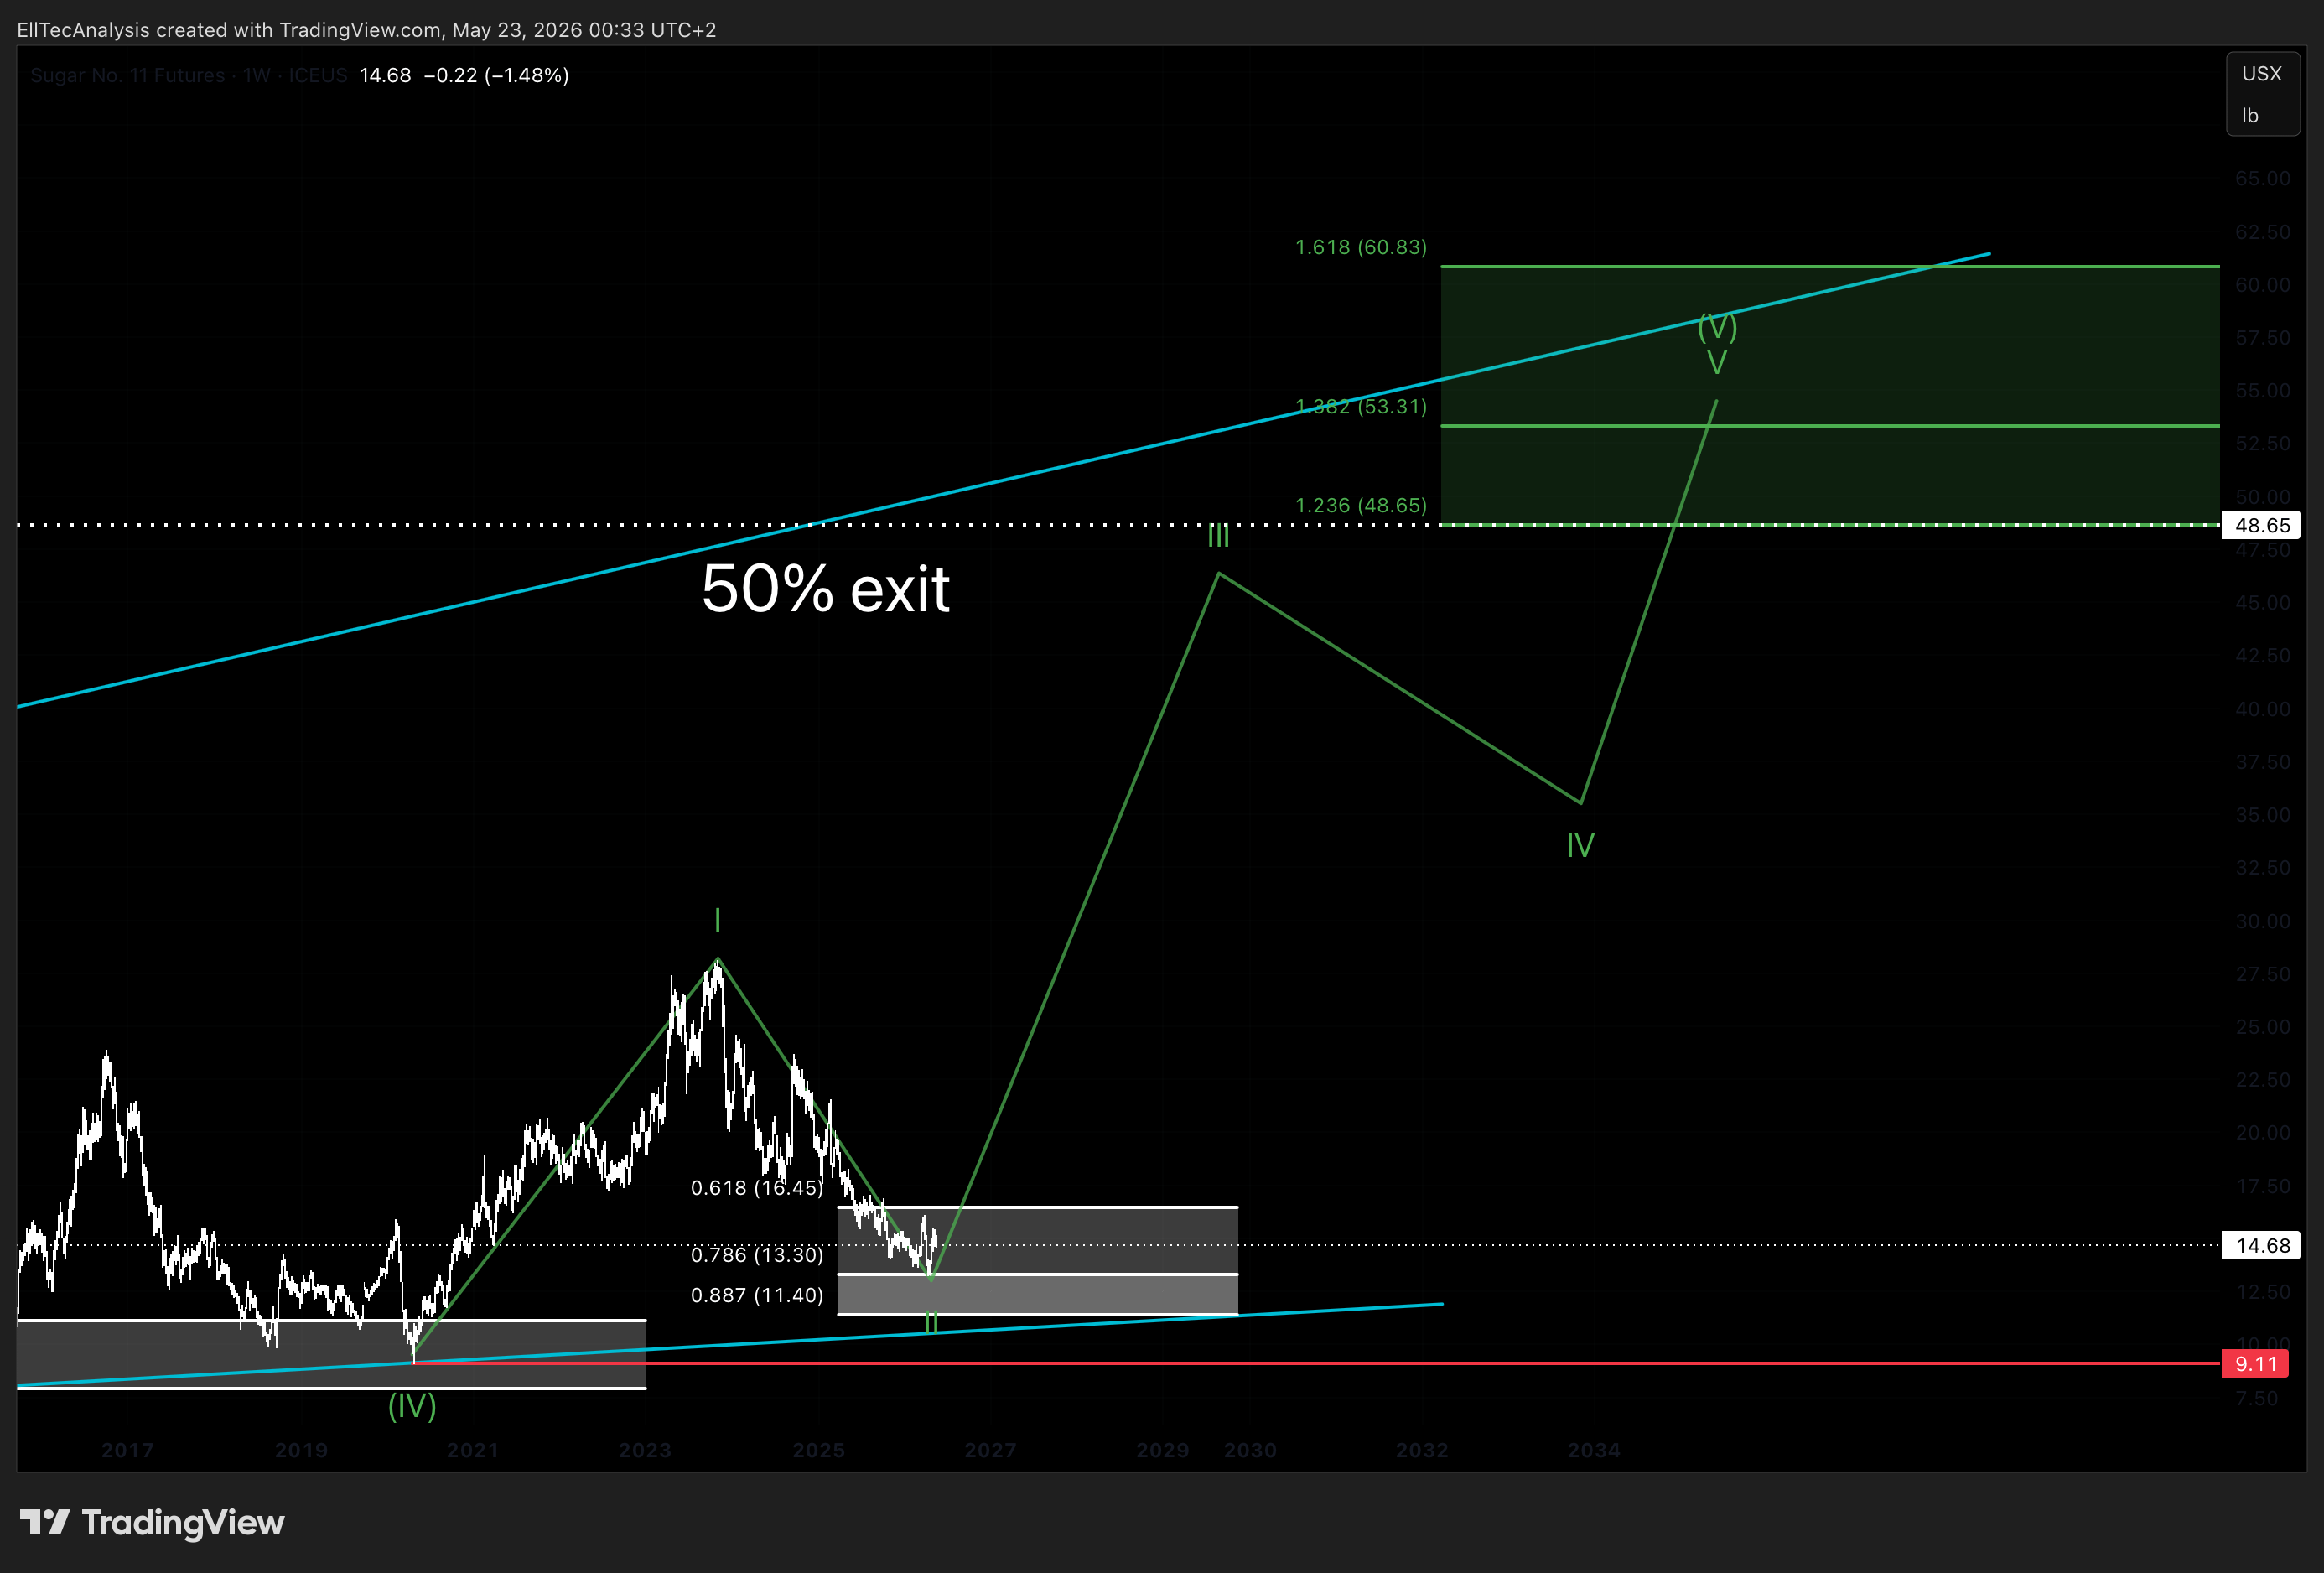
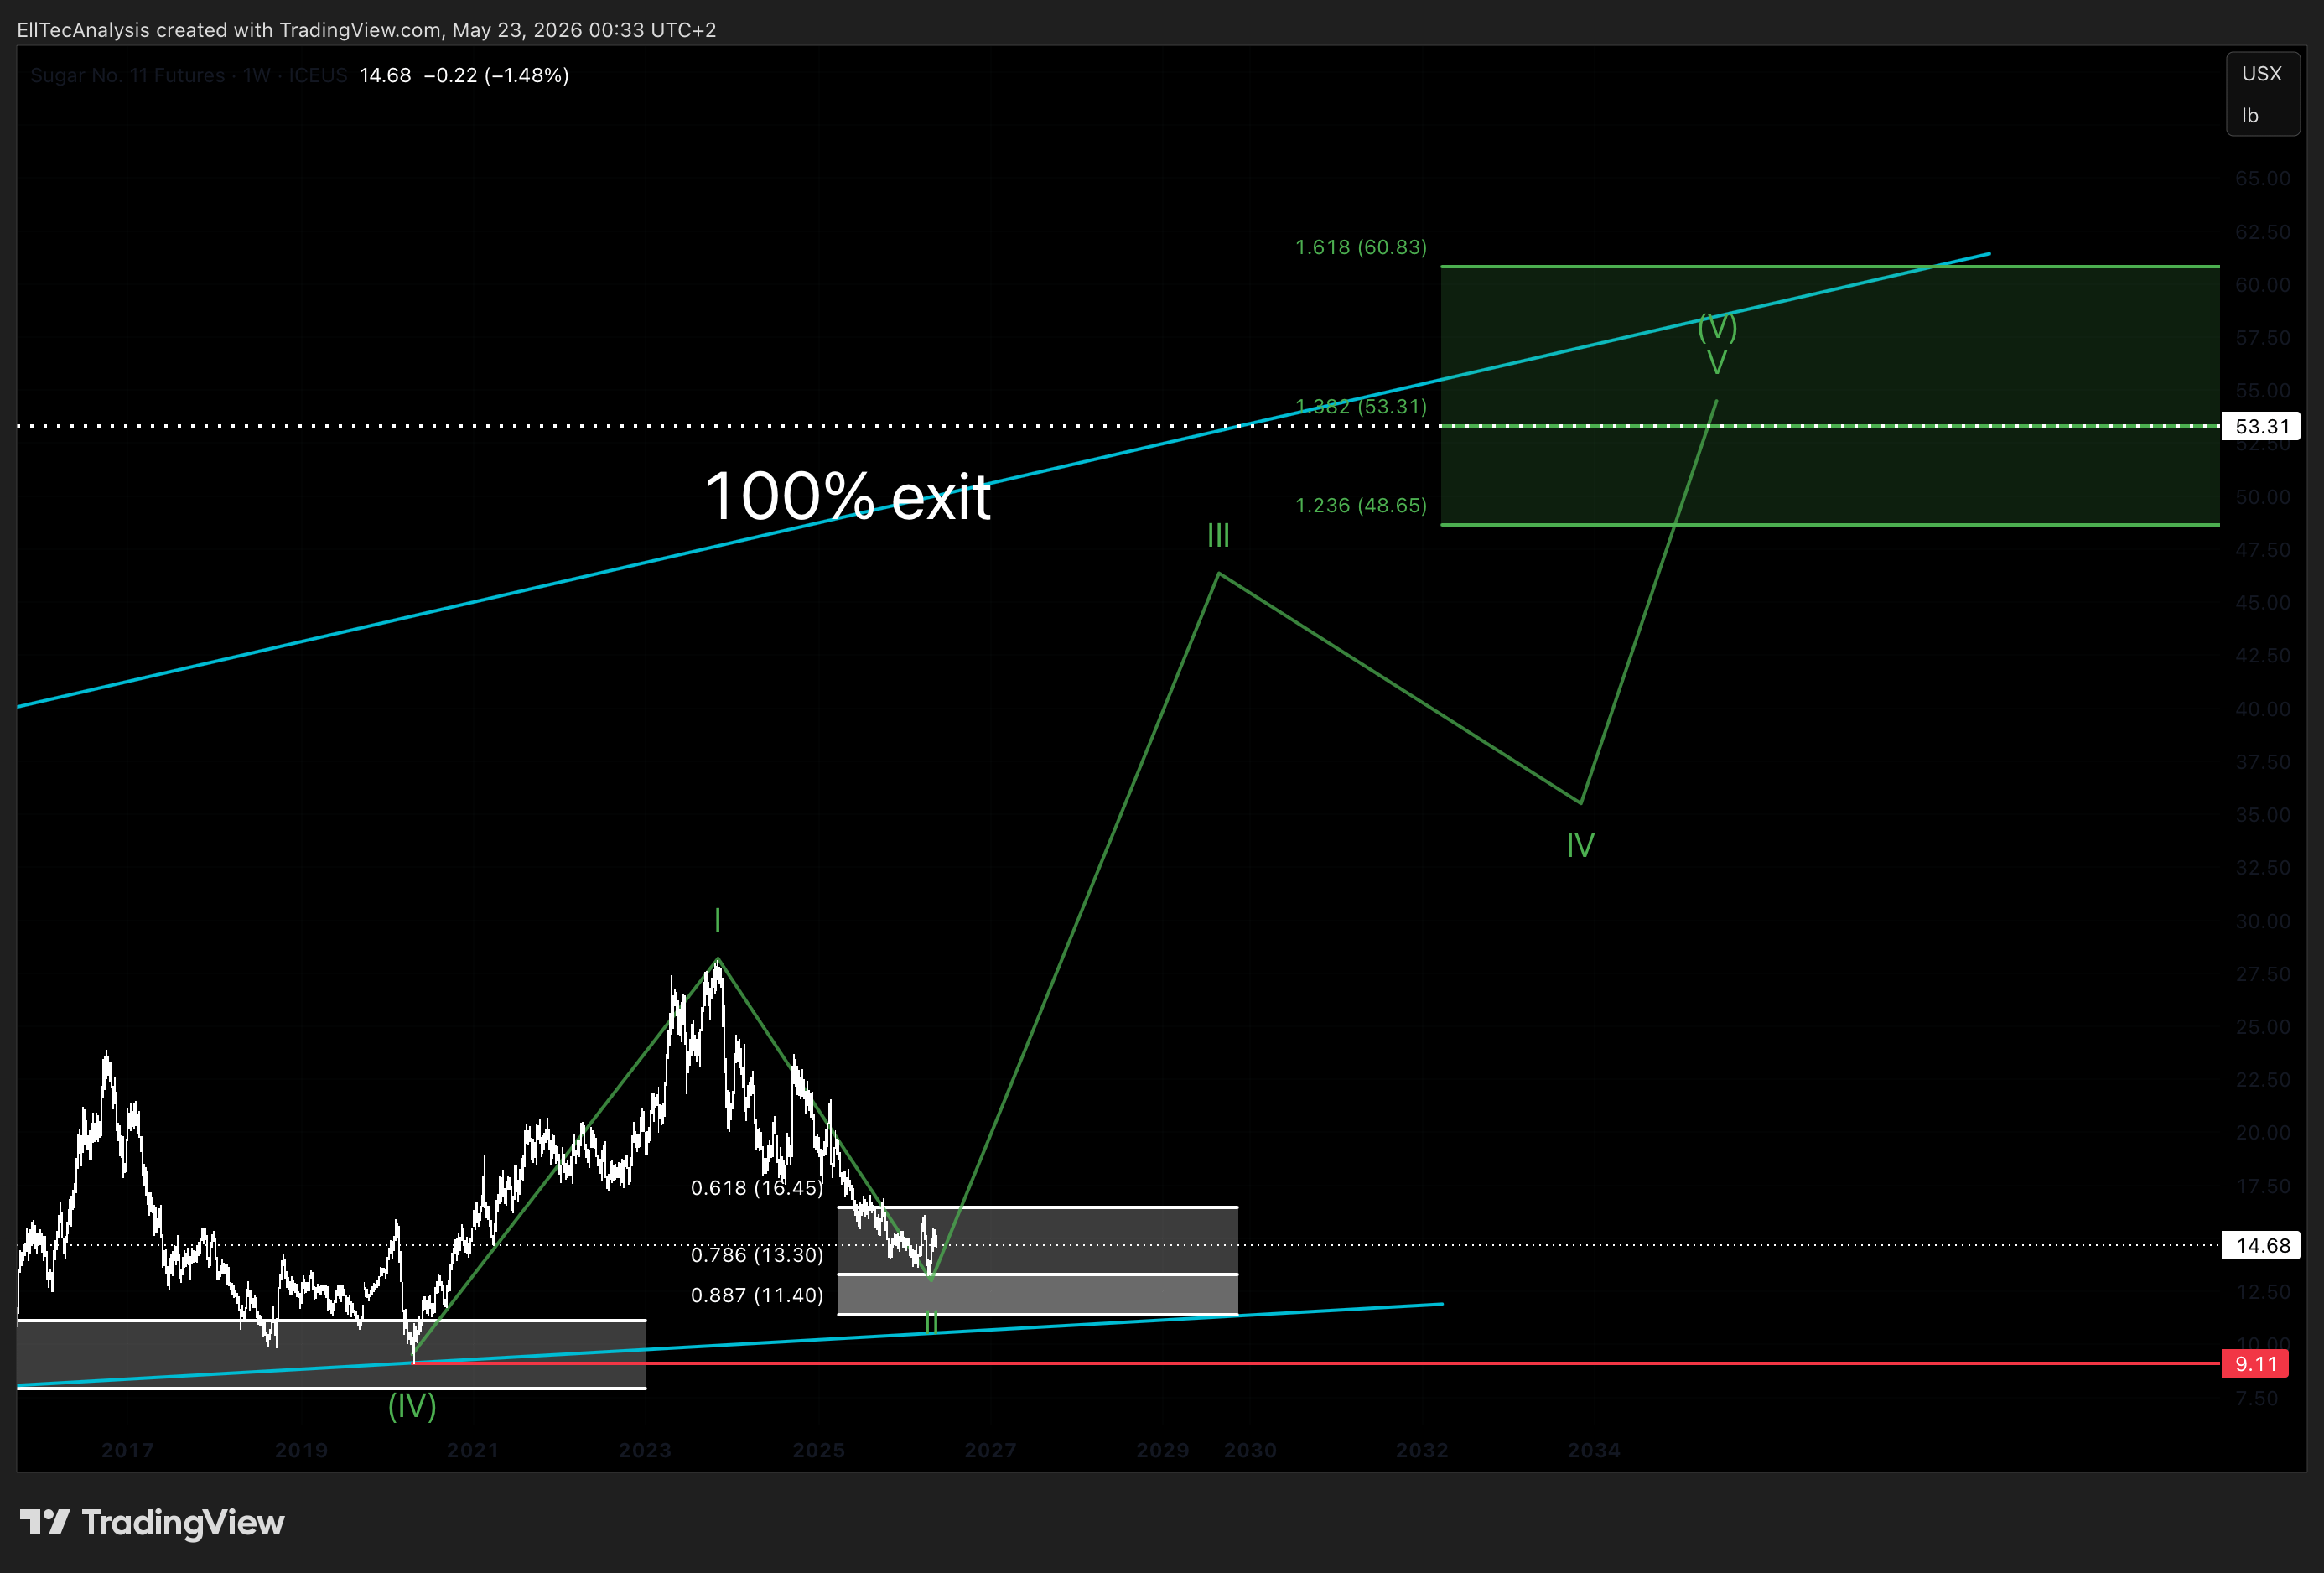
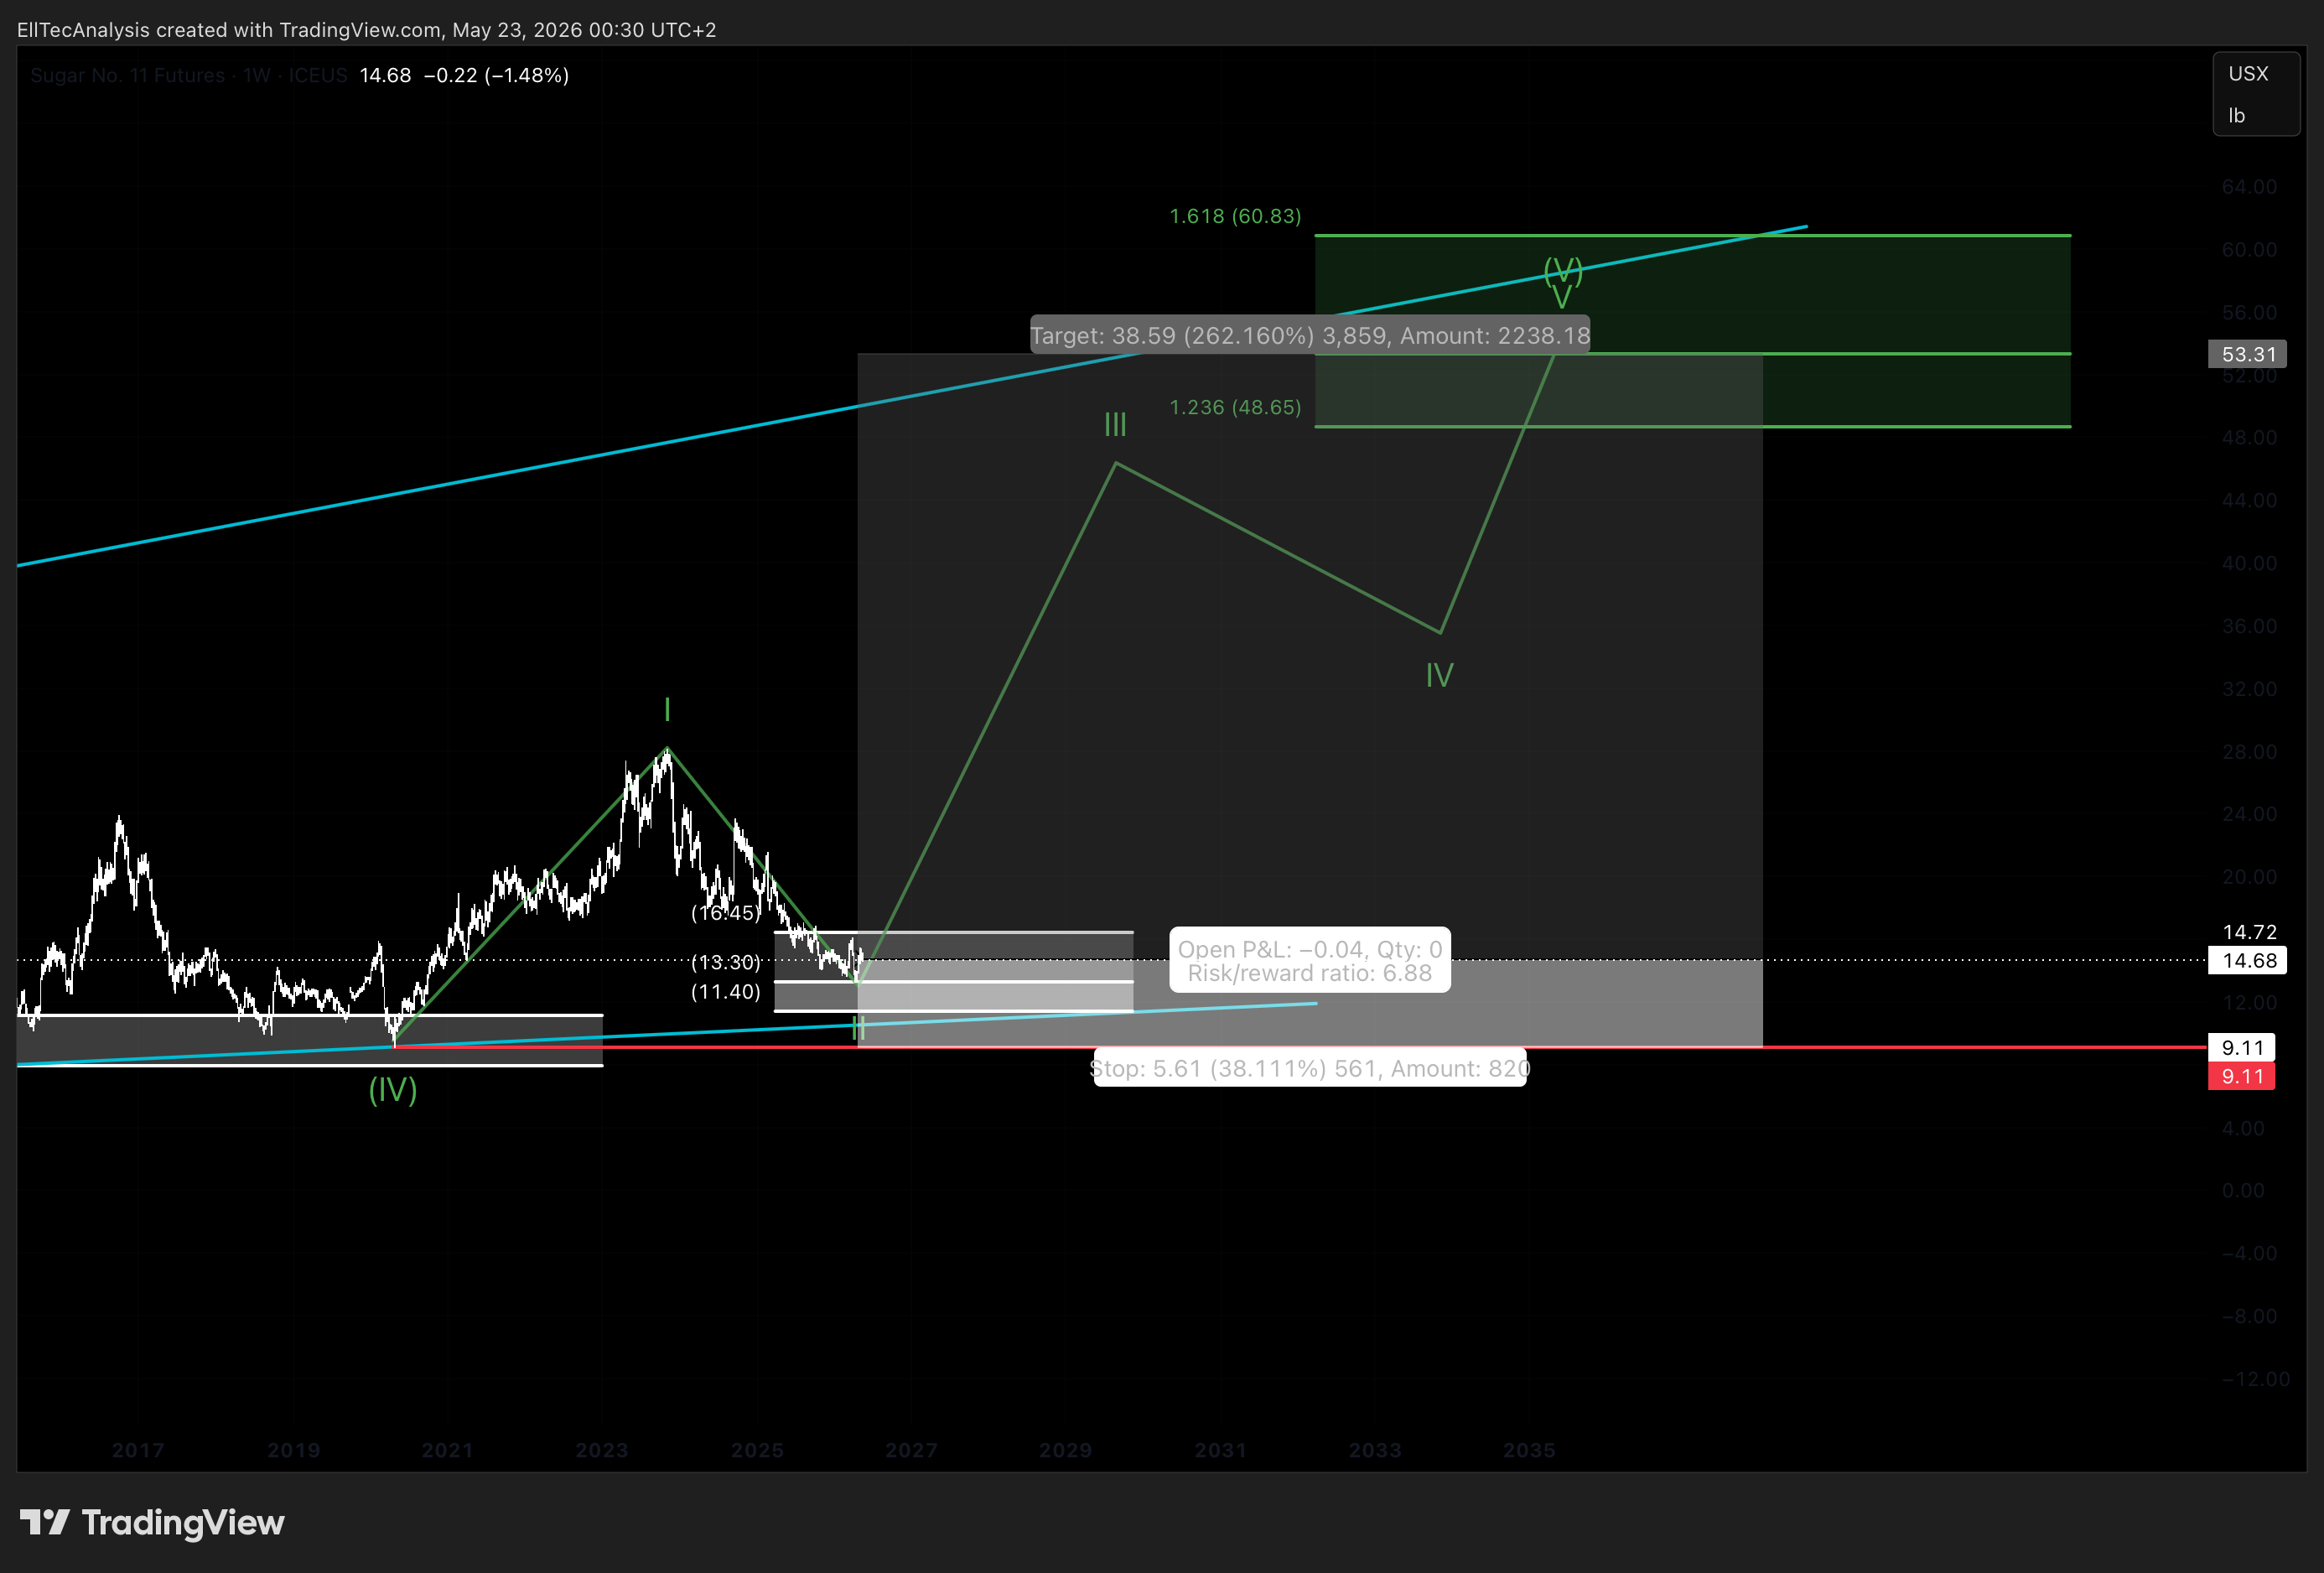
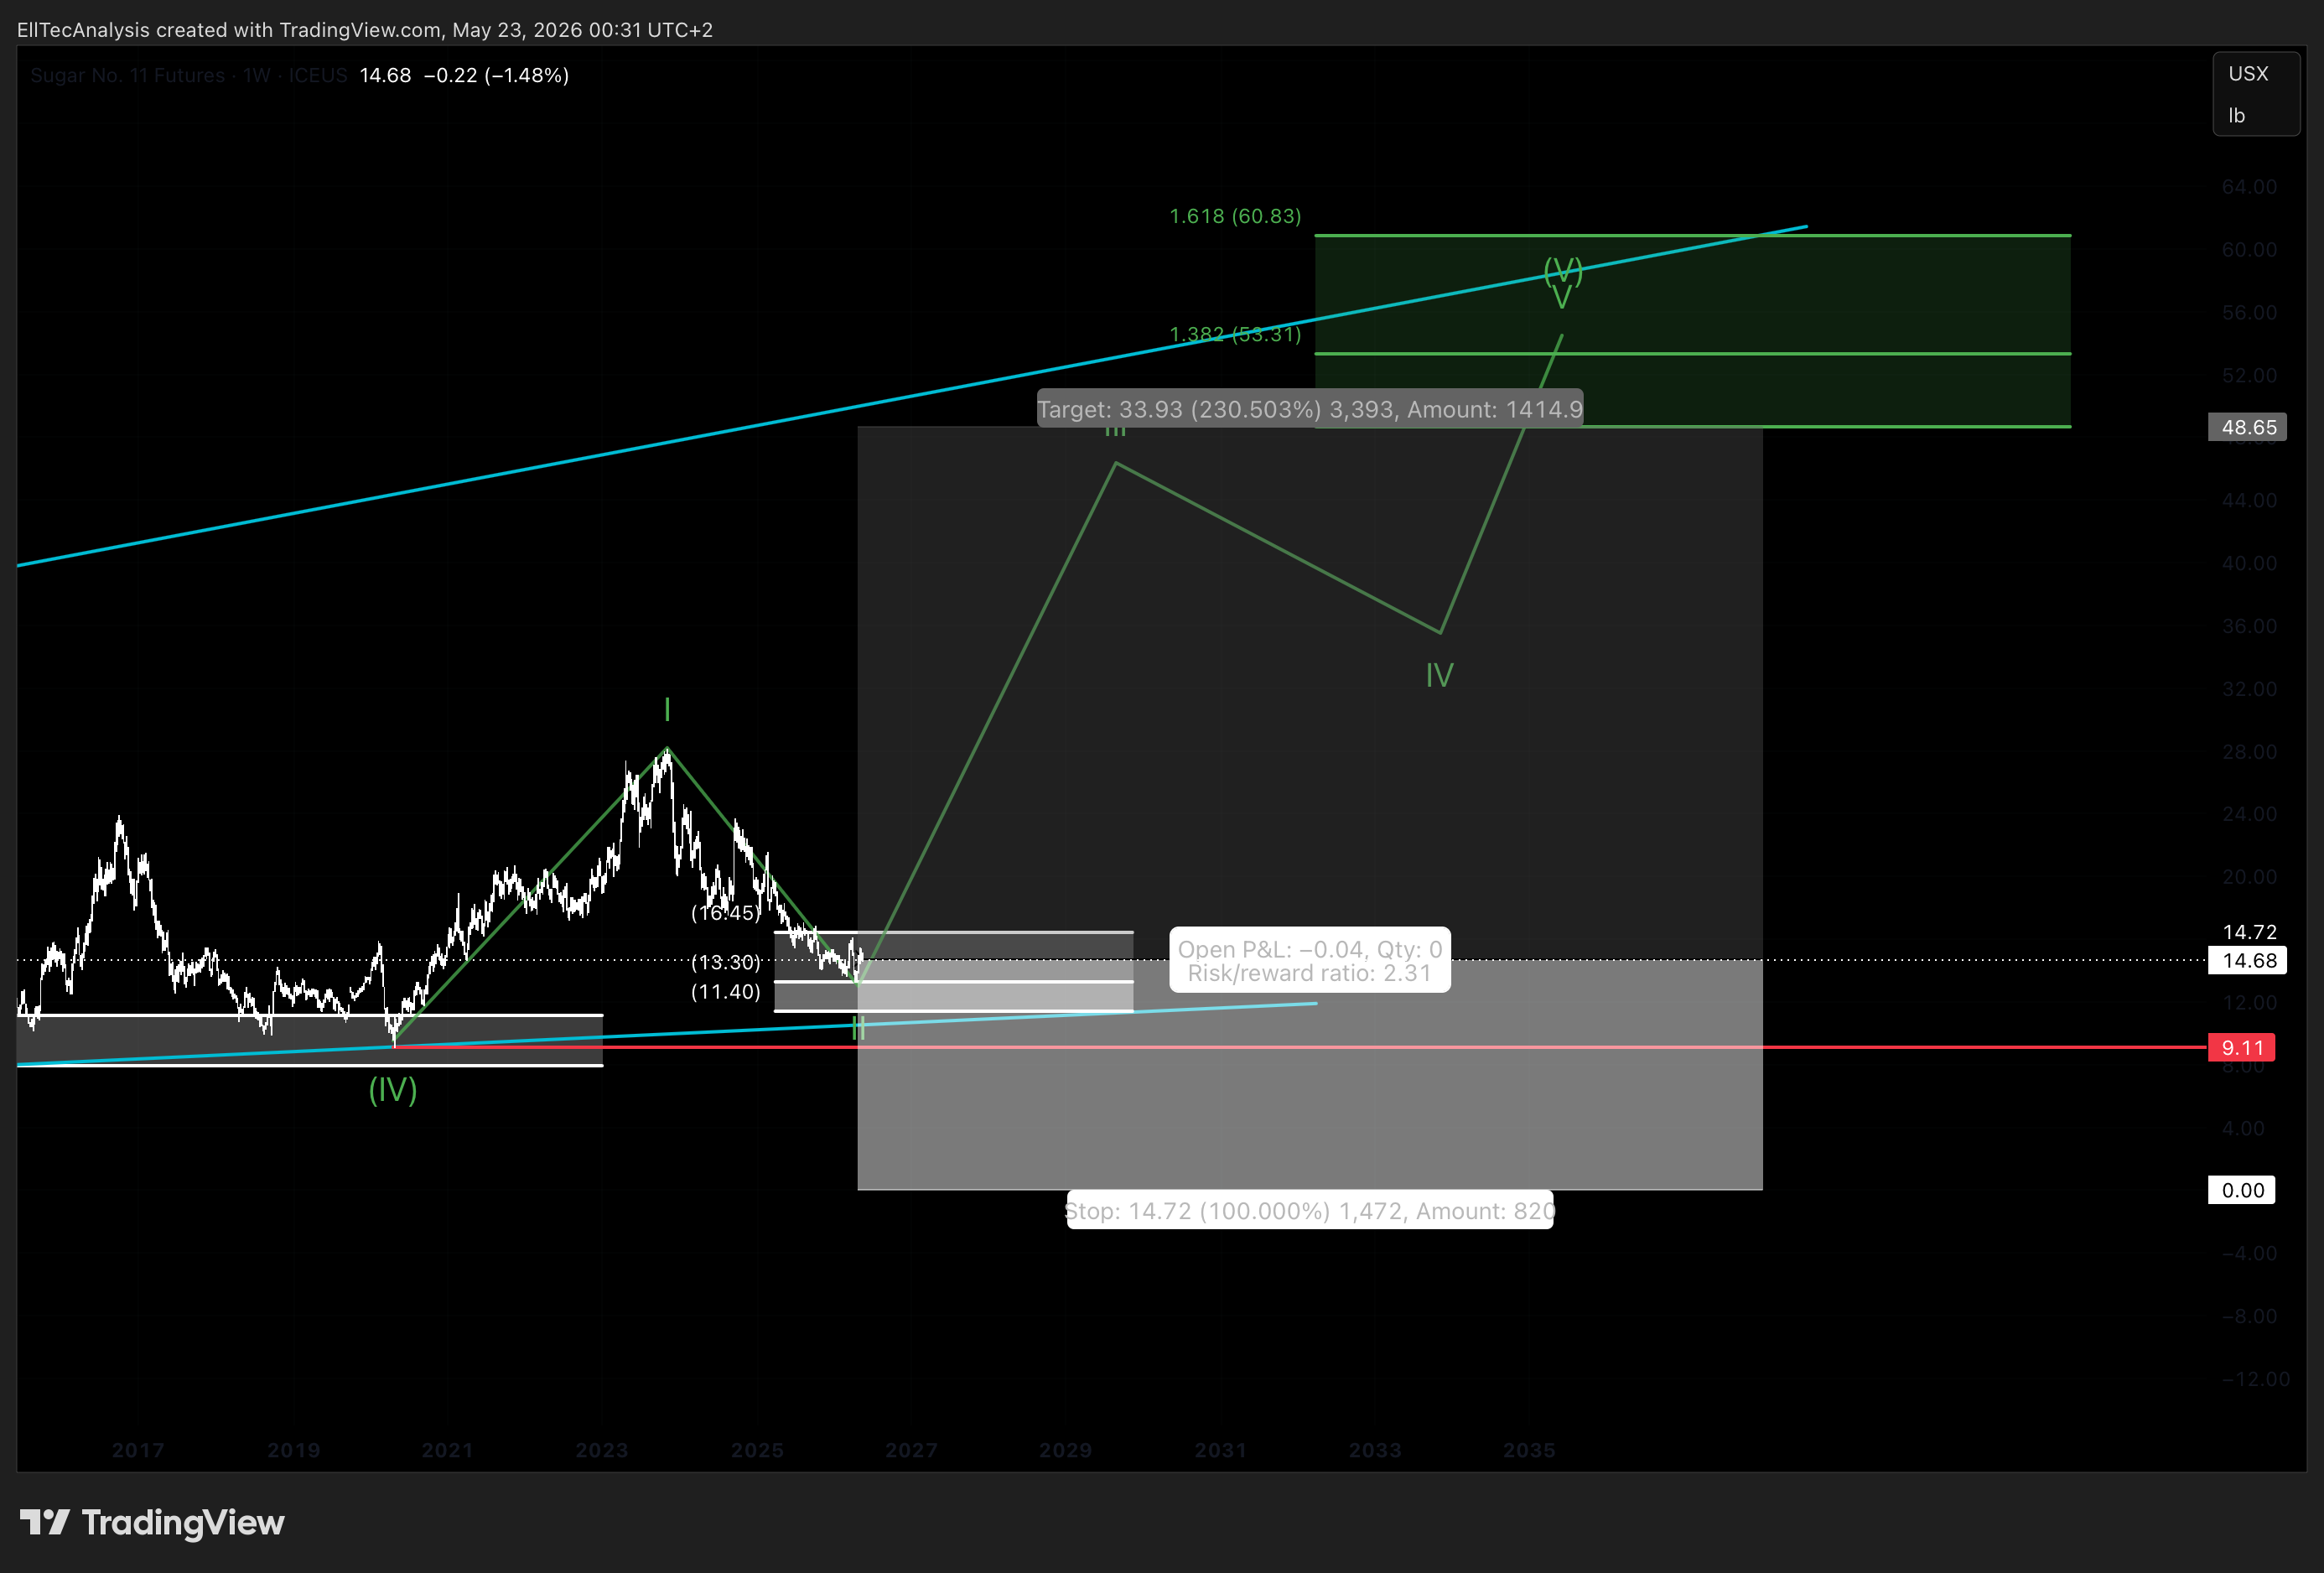
- 50% partial exit at the lower boundary of Target Zone 2 — 48.65 USX per pound (1.236 Fibonacci extension)
- Remaining 50% exit at 53.31 USX per pound (1.382 Fibonacci extension)
EllTec Analysis splits the exit across the 1.236 and 1.382 Fibonacci extension levels within Target Zone 2, rather than holding through to the upper boundary of the zone. The rationale is that the terminal phase of a fifth wave within a diagonal structure, which completes the Wave 5 sub-wave and closes out the internal Wave 1, is expected to finalize somewhere between the 1.382 and 1.618 extension levels. Executing the full exit before the upper boundary ensures that the position is fully realized within the highest-probability reversal corridor and avoids the risk of giving back gains in the subsequent Wave 2 correction at the next higher degree. Following that Wave 2 pullback, EllTec Analysis will evaluate a re-entry opportunity for the dominant higher-degree Wave 3 advance toward Target Zone 3 and ultimately Target Zone 4.
6.Seasonality
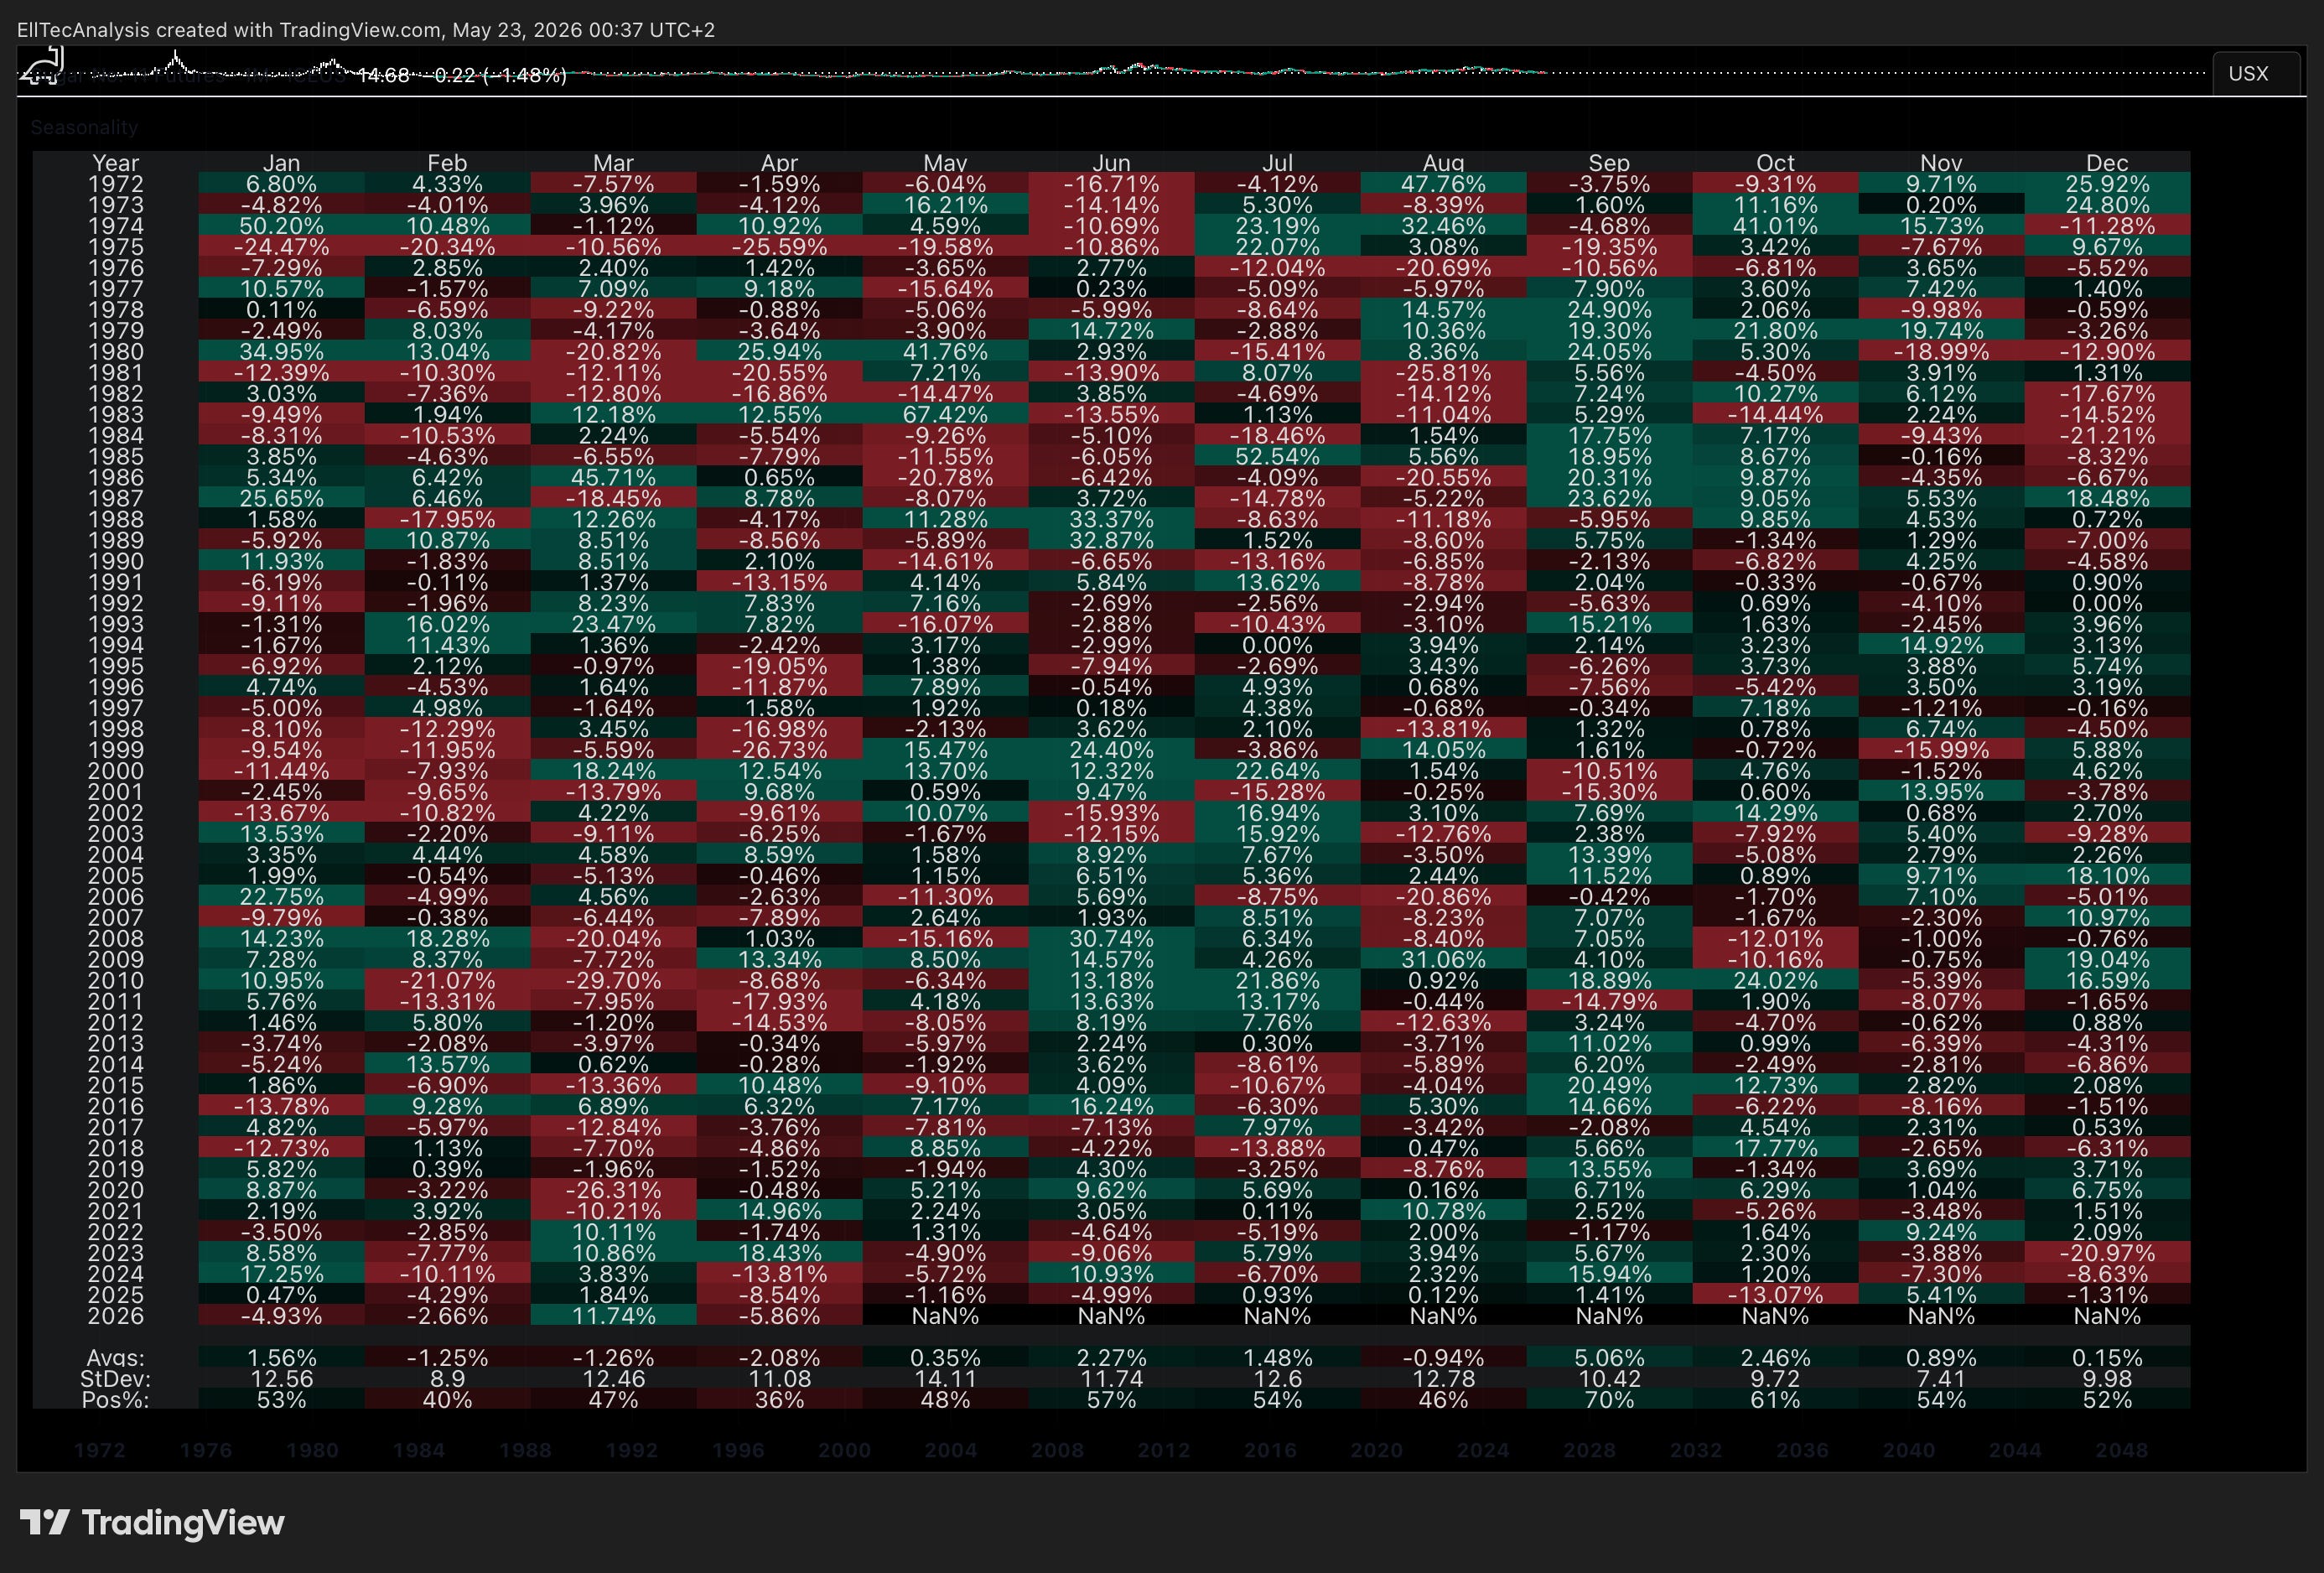
Seasonality indicates historical, that February to May are not good performing months. This fits in the correction in the last months to March 23th 2026. June to January are way better months, based on the seasonality average performance. So a positioning for this months does make sense, when looking at Seasonality. Combined with the primary scenario, a potential trend reversal, from a corrective Wave 2 into an bullish Wave 3 extension, becomes more likely.
7. Risk Assessment
Risk Score: 2-3
Sugar Futures carry a moderate risk profile within the commodity futures universe, reflecting a balance between the structural clarity of the long-term wave framework and the inherent volatility and complexity of speculative commodity exposure. The Sugar #11 contract is one of the most seasoned and liquid commodity futures available globally, with a continuous trading history extending well before 1972 and a physical market of genuine global economic importance. Sugar is an essential agricultural commodity deeply embedded in food systems, industrial processing chains, and emerging market consumption patterns worldwide, characteristics that provide a fundamental demand floor and support the long-term structural bull thesis.
The primary sources of risk elevation to a score of 3 are the single-commodity concentration inherent in a direct futures position, the significant price volatility that characterizes sugar markets across cycles, and the genuine uncertainty surrounding the precise sub-wave count at the current juncture. The alternative scenario of a misidentified diagonal and an unfolding complex B-wave corrective structure, while assessed as the lower-probability interpretation, cannot be dismissed and introduces the possibility of a structurally more complex path before the anticipated expansion materializes.
Additionally, the exogenous policy risk from major producing governments, particularly India’s export management framework and Brazilian ethanol policy decisions, introduces non-structural surprise risk that can create sharp short-term dislocations independent of the technical wave structure. For investors accessing this market through futures contracts directly, leverage management and position sizing discipline are essential risk controls given the inherent volatility of the instrument.
Disclaimer
This analysis is for informational purposes only and does not constitute financial advice. All information is provided without guarantee. Markets involve risks, and past performance is not indicative of future results. Please do your own research or consult a licensed advisor. EllTec Analysis assumes no liability for decisions based on this content.