

Nasdaq Inc.
The Long Road Down before the Generational Opportunity


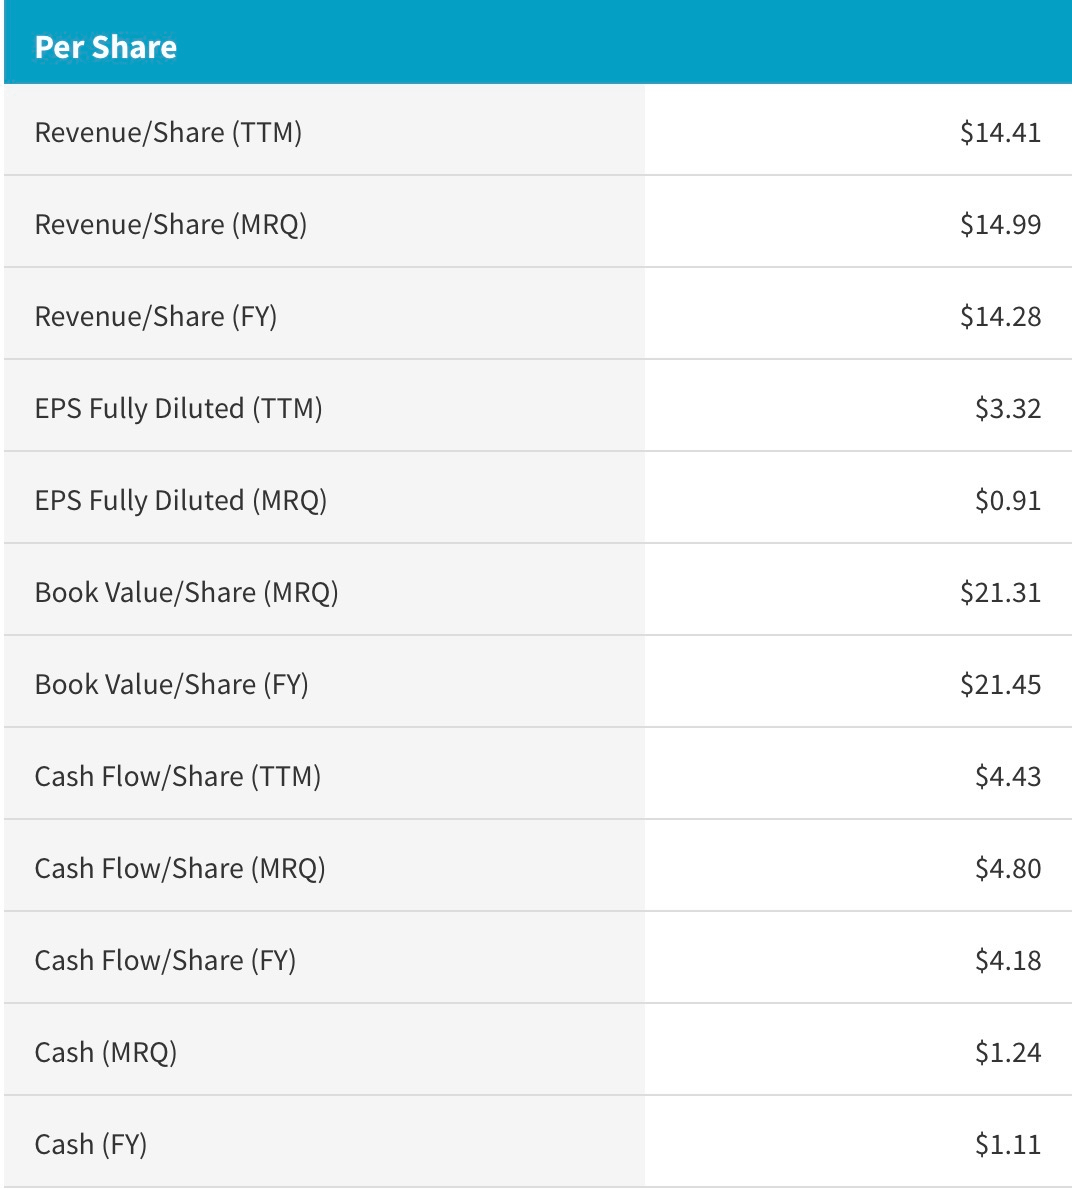
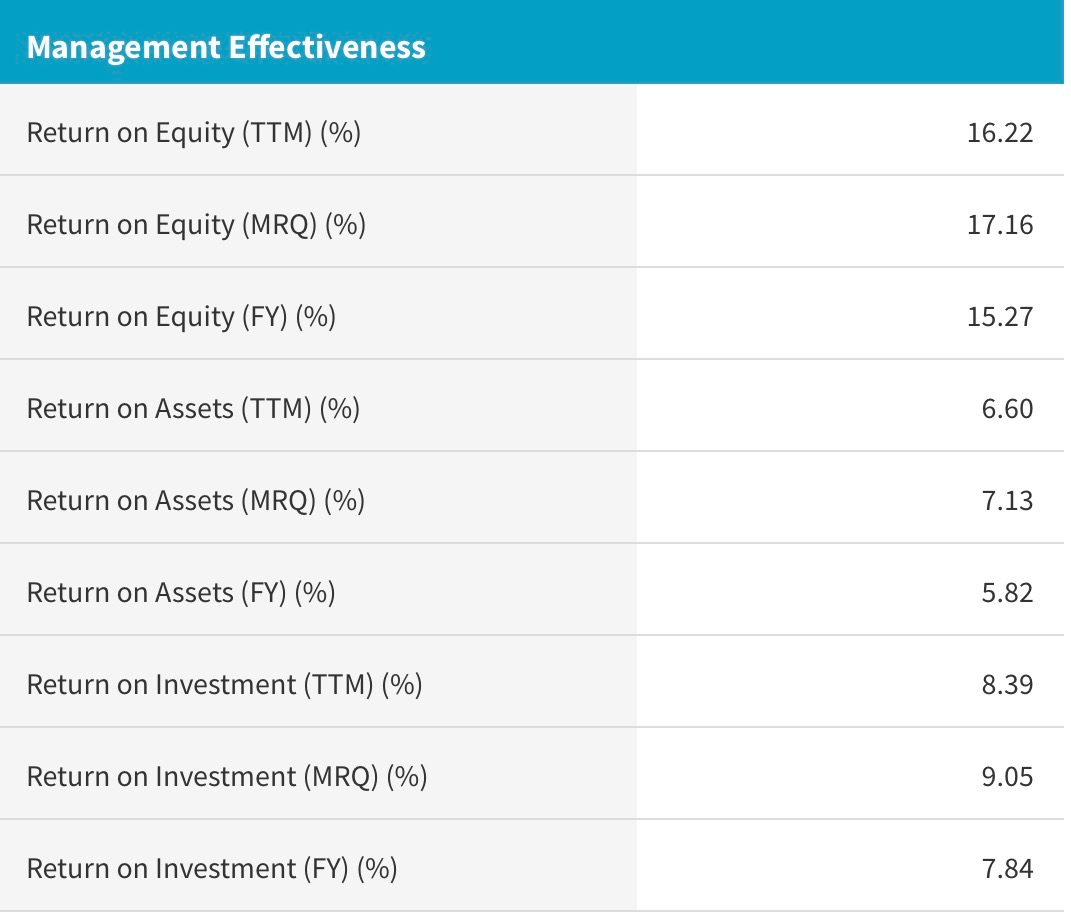
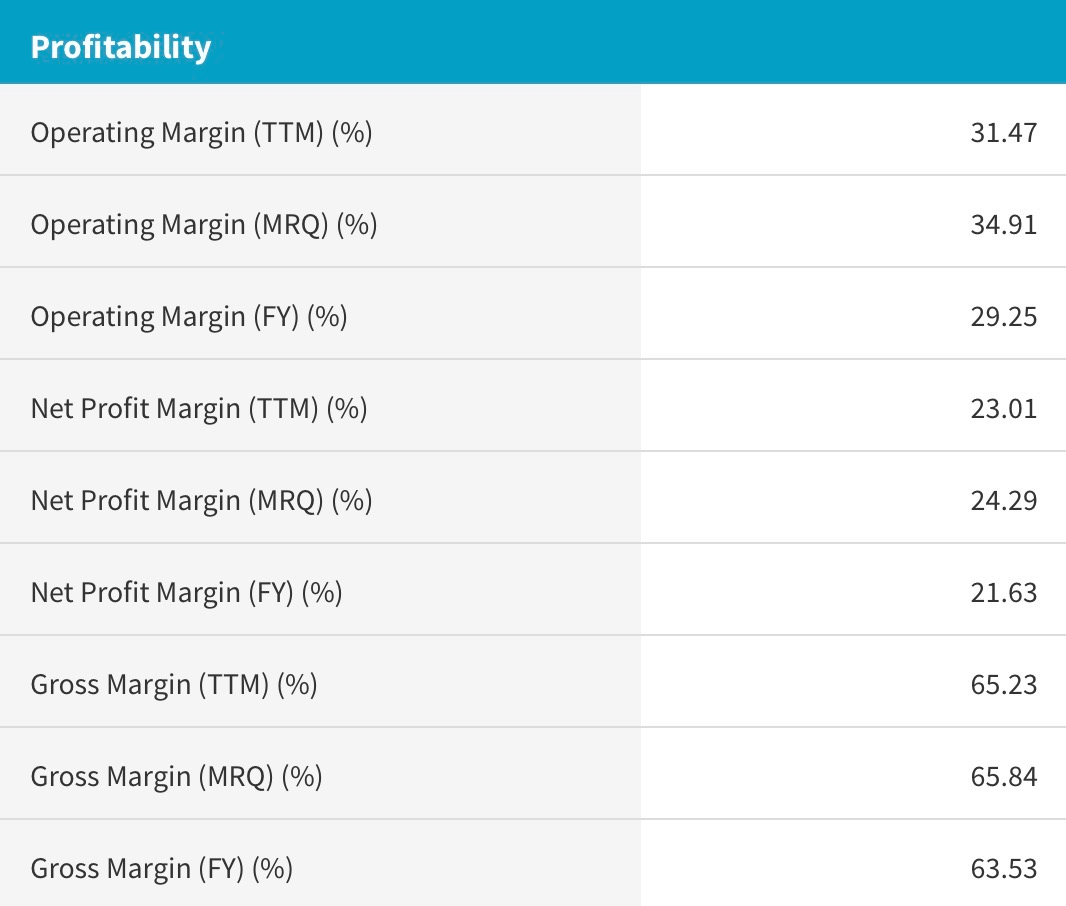
1. Fundamentals
Nasdaq Inc. (NDAQ) is one of the world’s leading financial infrastructure and technology companies. While widely associated with its flagship stock exchange (the Nasdaq Stock Market) the company has structurally evolved well beyond its roots as a pure-play exchange operator. Today, Nasdaq Inc. generates revenue across three core business segments: Market Services, Capital Access Platforms, and Financial Technology. This diversification has repositioned the company closer to a high-margin SaaS and fintech platform than a traditional exchange business, which is directly reflected in the premium multiple the market historically assigns to the stock.
The Market Services division encompasses the core exchange operations, including equity trading, options, and fixed income clearing. This segment benefits structurally from elevated market volatility, as higher volumes drive trading fees. The Capital Access Platforms segment provides listing services, investor relations solutions, and market intelligence data — recurring revenue streams that are largely decoupled from short-term market fluctuations. The most strategically significant development in recent years was the acquisition of Adenza in 2023 for approximately 10.5 billion USD, which dramatically expanded Nasdaq’s Financial Technology footprint into regulatory reporting, risk management, and capital markets software. This acquisition deepened the company’s exposure to compliance-driven enterprise spending, a segment with secular tailwinds driven by increasing global regulatory complexity.
From a macro perspective, Nasdaq Inc.’s earnings profile is sensitive to several key variables: global equity market activity levels, interest rate conditions affecting deal flow and IPO pipelines, USD strength influencing international revenue streams, and the broader enterprise software spending cycle. The integration of Adenza has also introduced a higher debt load onto the balance sheet, making the company more sensitive to refinancing conditions in a prolonged high-rate environment. On the positive side, the ongoing institutionalization of global capital markets, the expansion of alternative asset infrastructure, and the increasing demand for financial crime prevention technology all represent durable structural tailwinds for the business over the medium to long term.
At current valuations, Nasdaq Inc. trades at a significant premium to pure exchange peers, justified by the recurring software revenue composition of the business. However, this premium also implies vulnerability to multiple compression if growth expectations moderate, interest rates remain elevated longer than anticipated, or broader equity market risk appetite contracts. This macro and valuation context forms an important backdrop for the technical structure currently developing in the chart.
2. Correlations
The price action of Nasdaq Inc. is embedded within a multi-layered correlation framework that spans equity market structure, interest rate dynamics, technology sector cycles, and broader risk sentiment regimes. Understanding these relationships is essential for contextualizing the Elliott Wave structure and validating the macro environment required for the primary thesis to materialize.
Global Equity Risk Sentiment
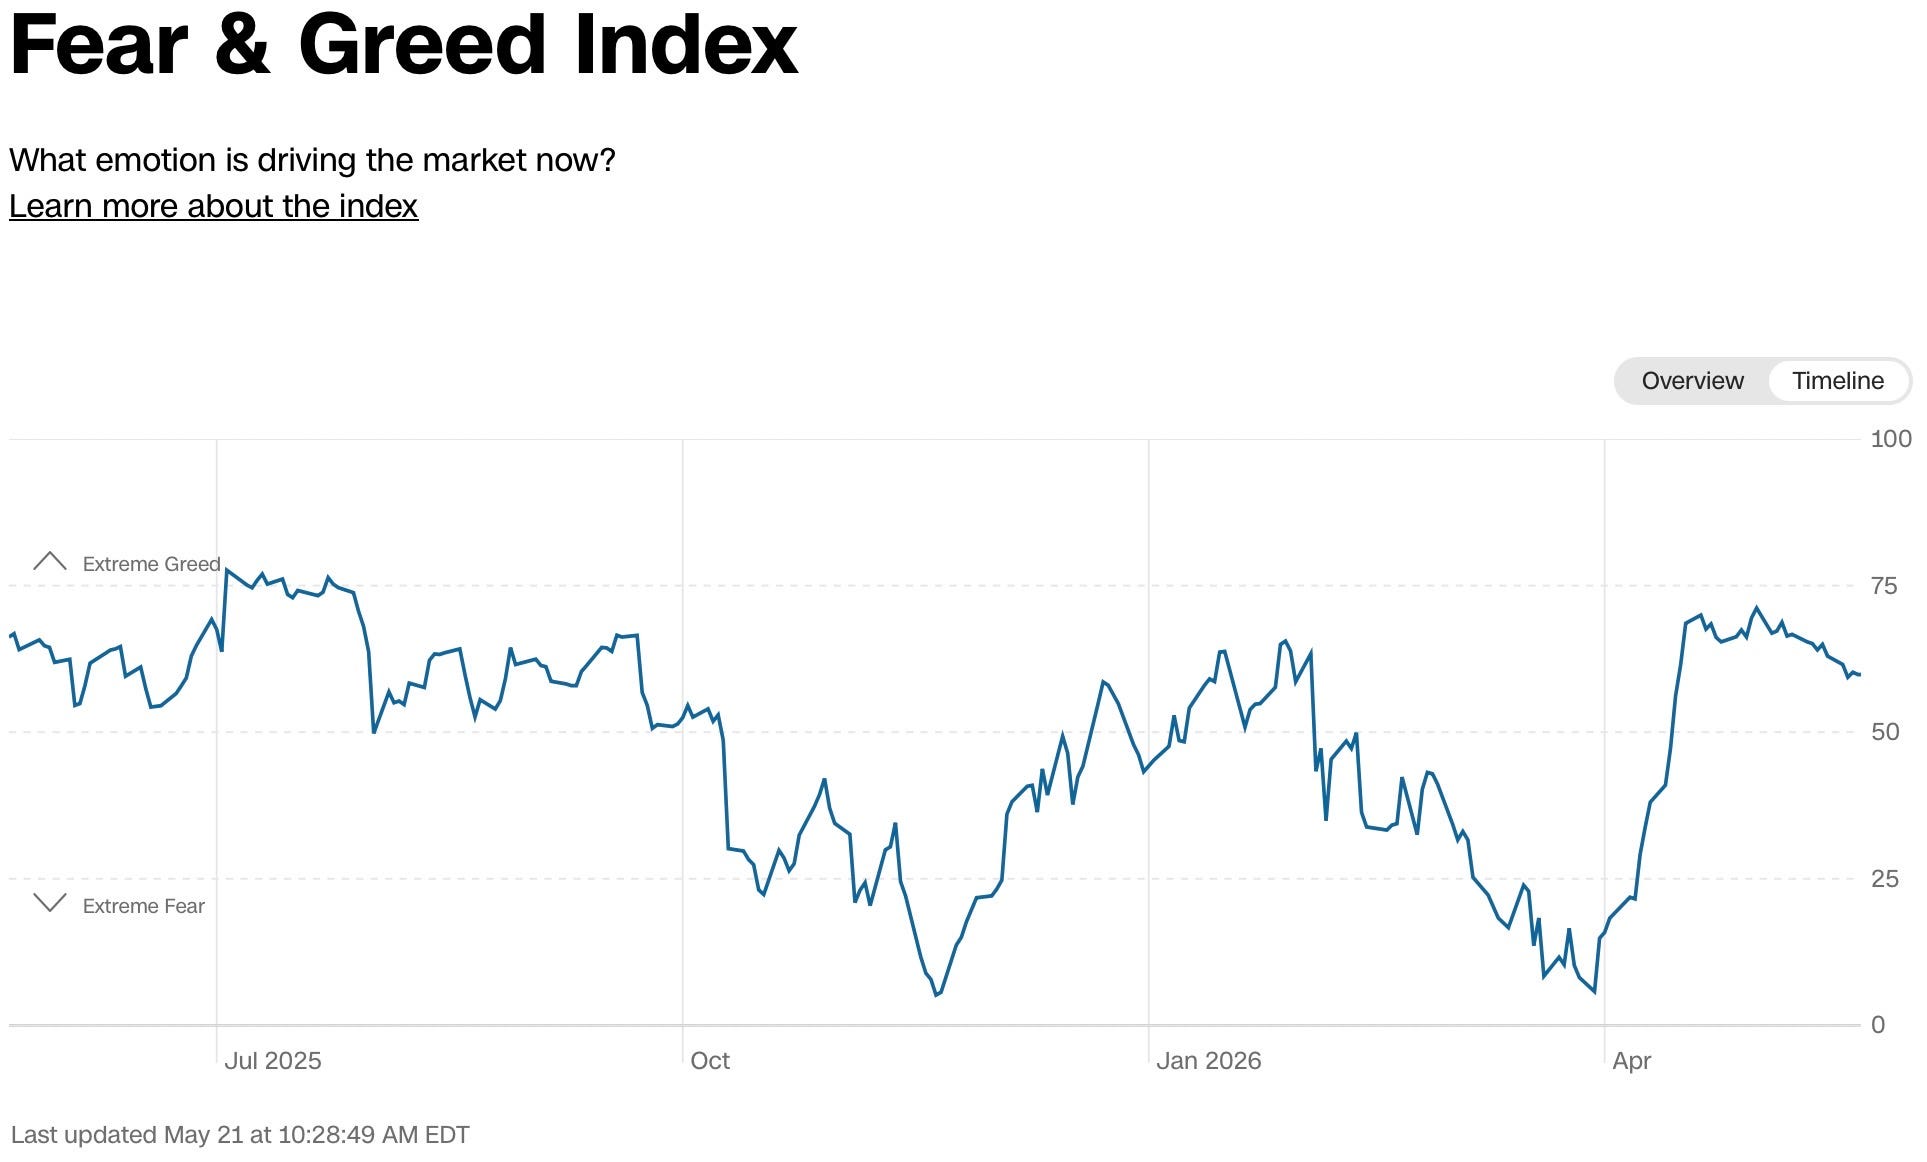
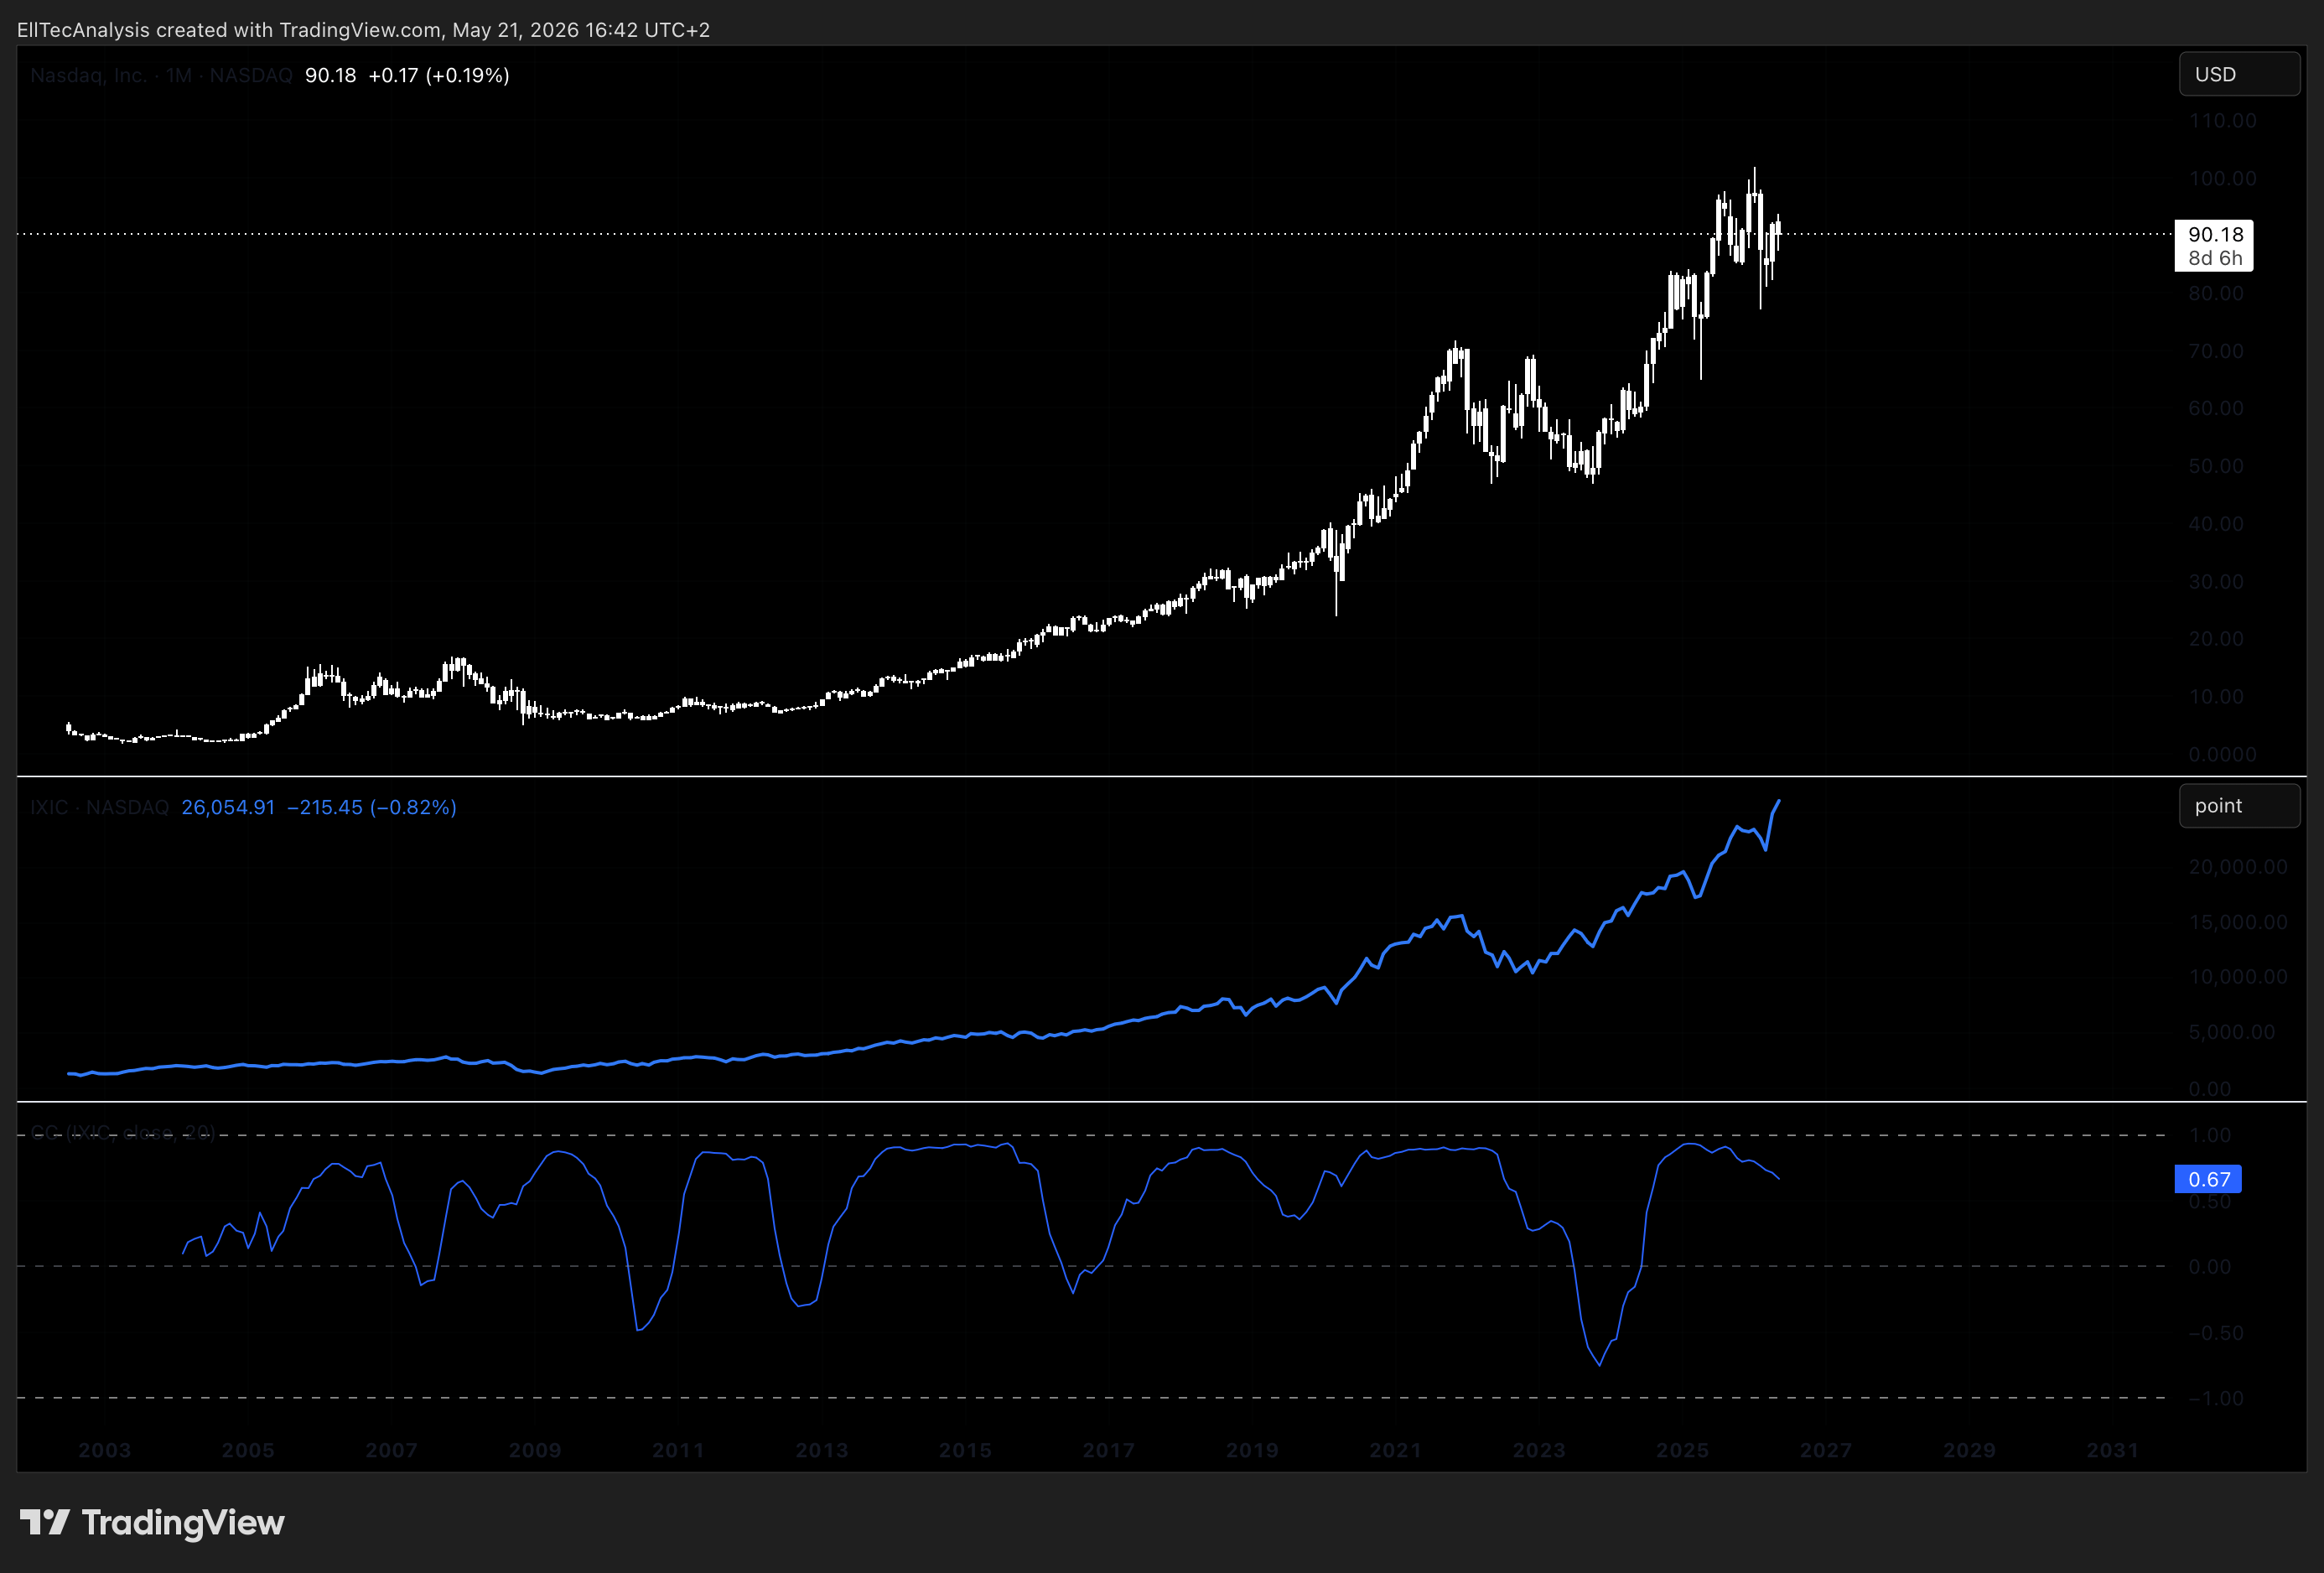
As a publicly listed financial infrastructure and technology company, Nasdaq Inc. exhibits a strong positive correlation with broad equity risk appetite. During risk-on phases characterized by liquidity expansion and declining volatility, the stock benefits from multiple expansion and increased market activity volumes. In risk-off environments, the correlation with global equities tightens and the stock tends to reprice sharply alongside broader beta exposure. The current structural expectation of a meaningful correction is consistent with a sustained risk-off or liquidity-tightening macro environment. The Fear and Greed Index displayed, shows thet the sentiment is greed at the moment, this indicates a potential top forming.
Nasdaq Composite Index and Technology Sector

Nasdaq Inc. maintains a structurally high correlation with the Nasdaq Composite and the broader technology sector. However, this correlation is not symmetrical in all regimes. During significant sector-specific repricing cycles, Nasdaq Inc. can underperform the index it operates, particularly when multiple compression in high-growth technology names weighs on sentiment toward tech-adjacent financial infrastructure companies. Divergences in relative performance between NDAQ and the Composite can serve as a valuable leading or lagging signal for broader tech cycle transitions.
US Interest Rates and Federal Reserve Policy
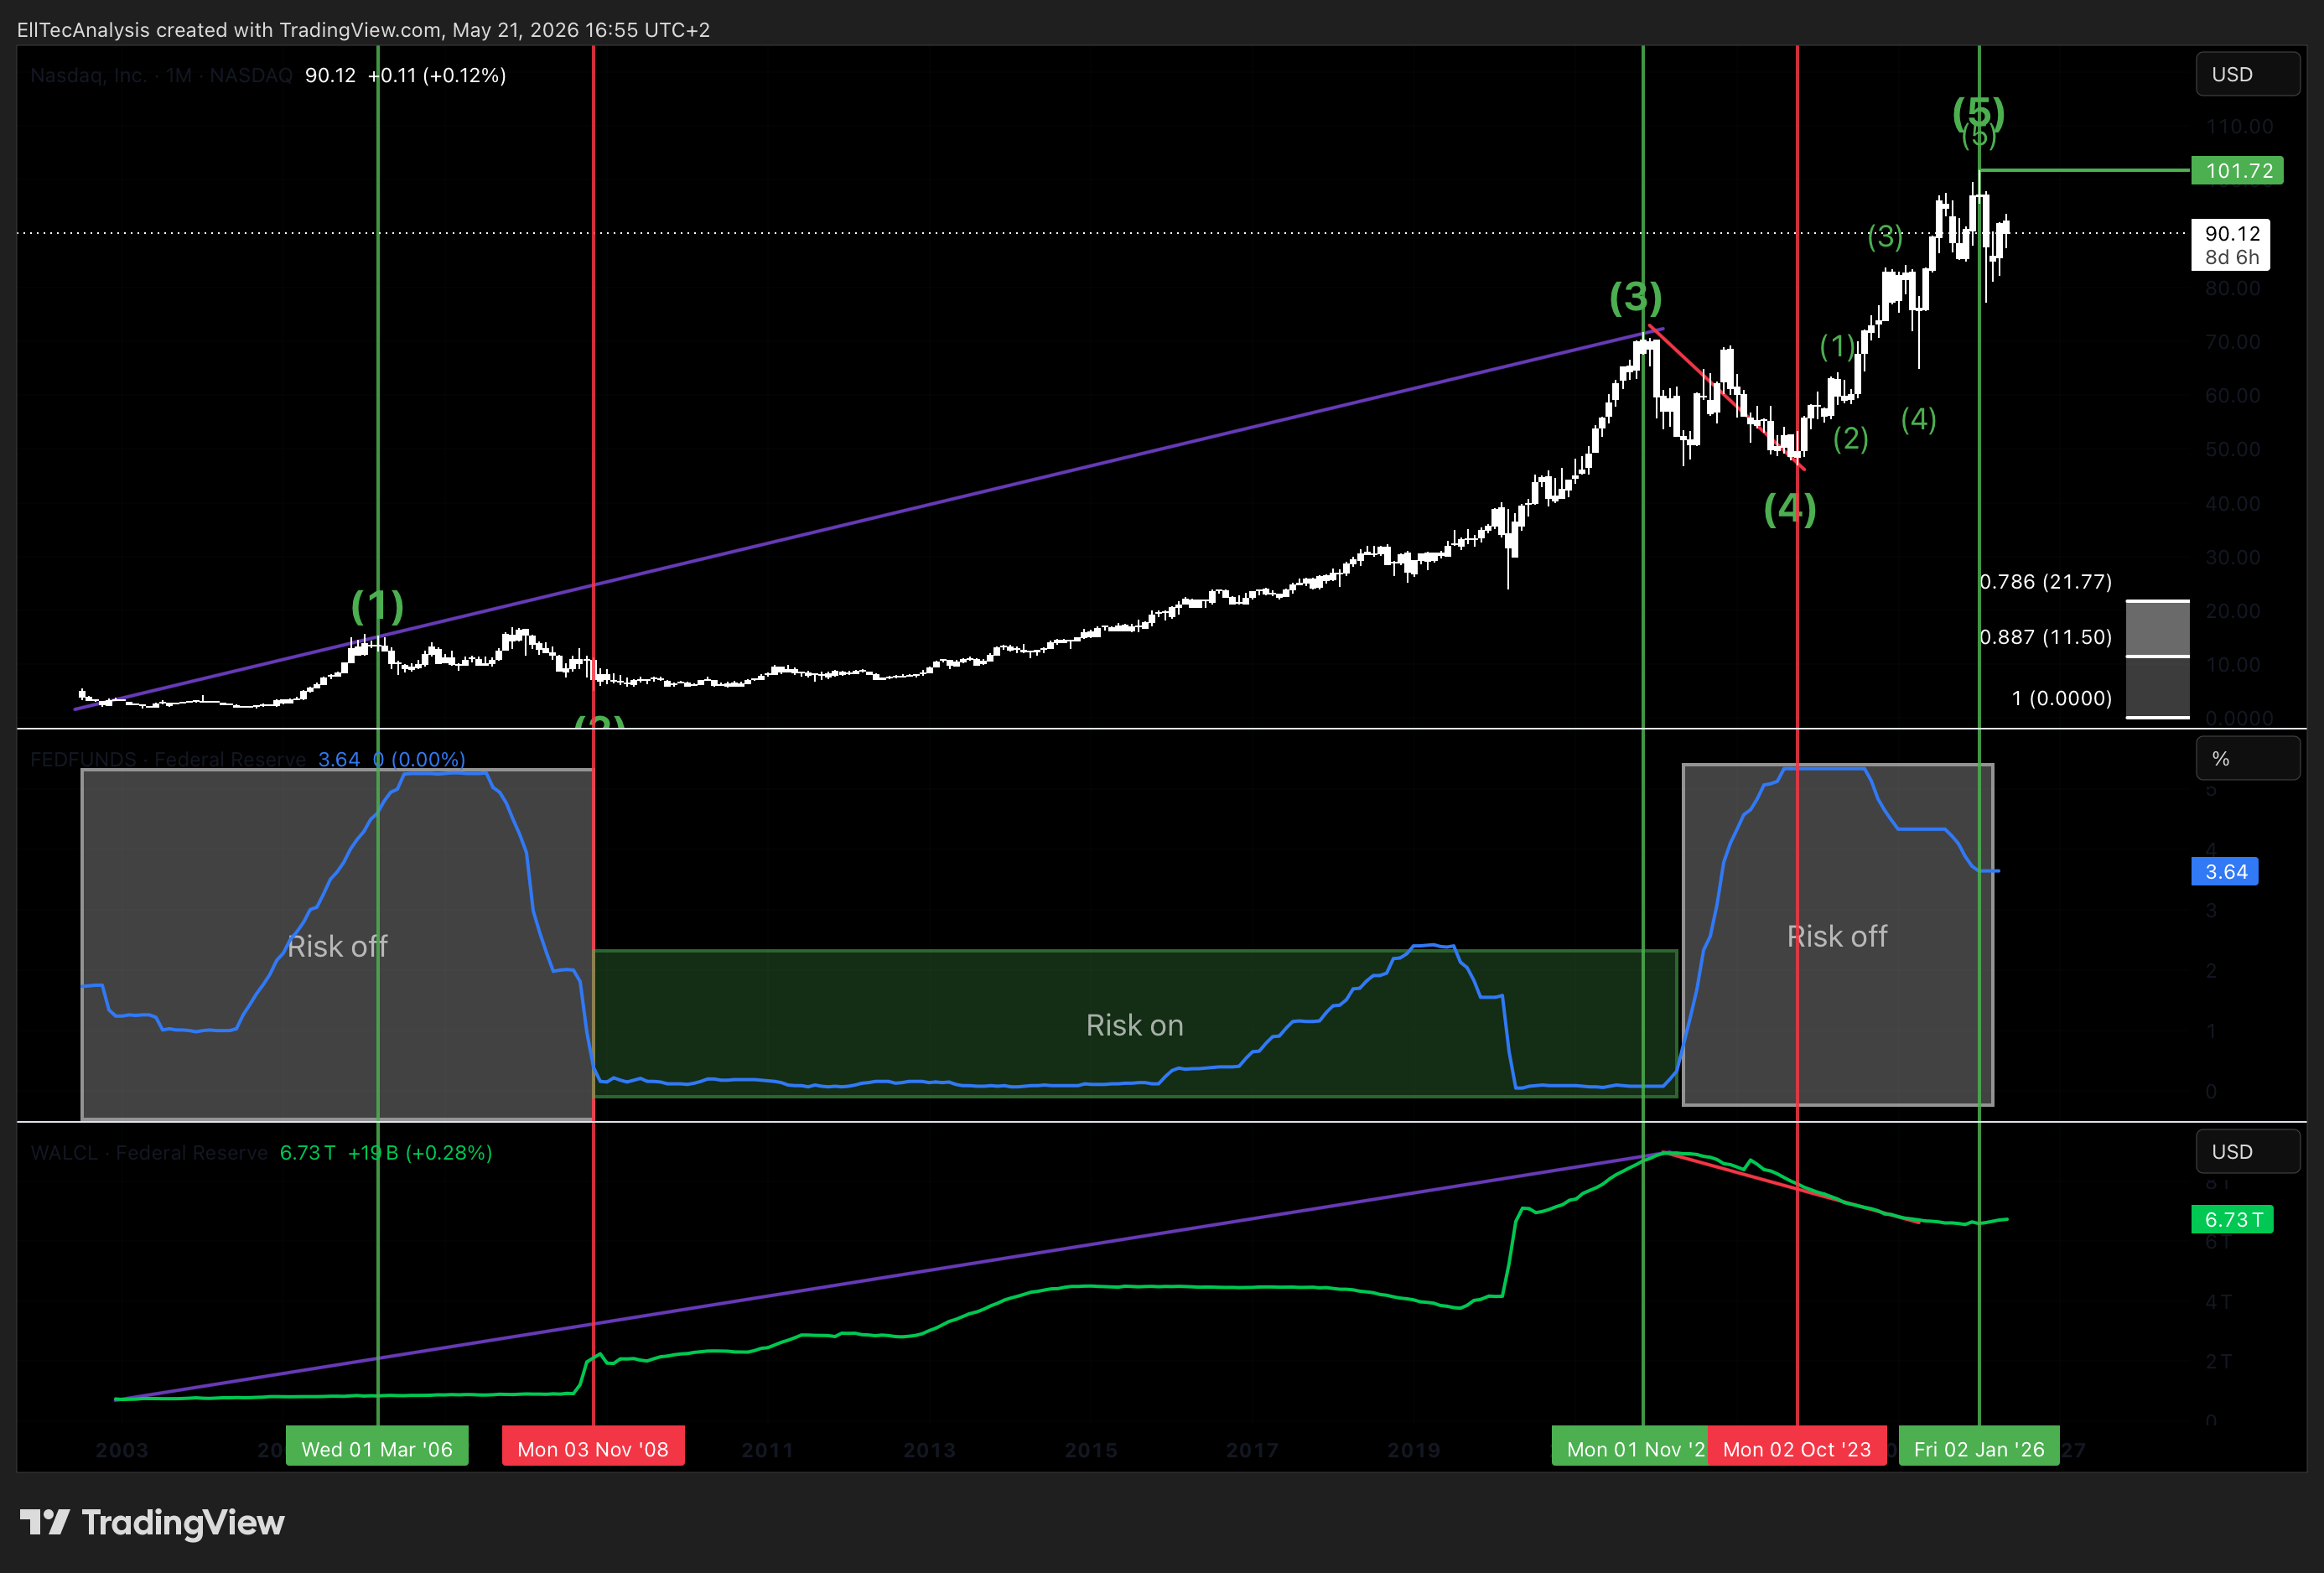
Interest rate sensitivity is among the most important macro drivers for Nasdaq Inc. As a company carrying meaningful debt following the Adenza acquisition, rising real yields increase refinancing costs and compress the discounted present value of forward earnings, both of which exert downward pressure on valuation. Conversely, a Federal Reserve pivot toward rate cuts would reduce financing costs, support multiple expansion, and revive the IPO and deal flow pipelines that drive Capital Access Platform revenues. The direction of US monetary policy therefore functions as a critical macro tailwind or headwind for the structural trade thesis outlined in this analysis.
US Dollar Index (DXY)
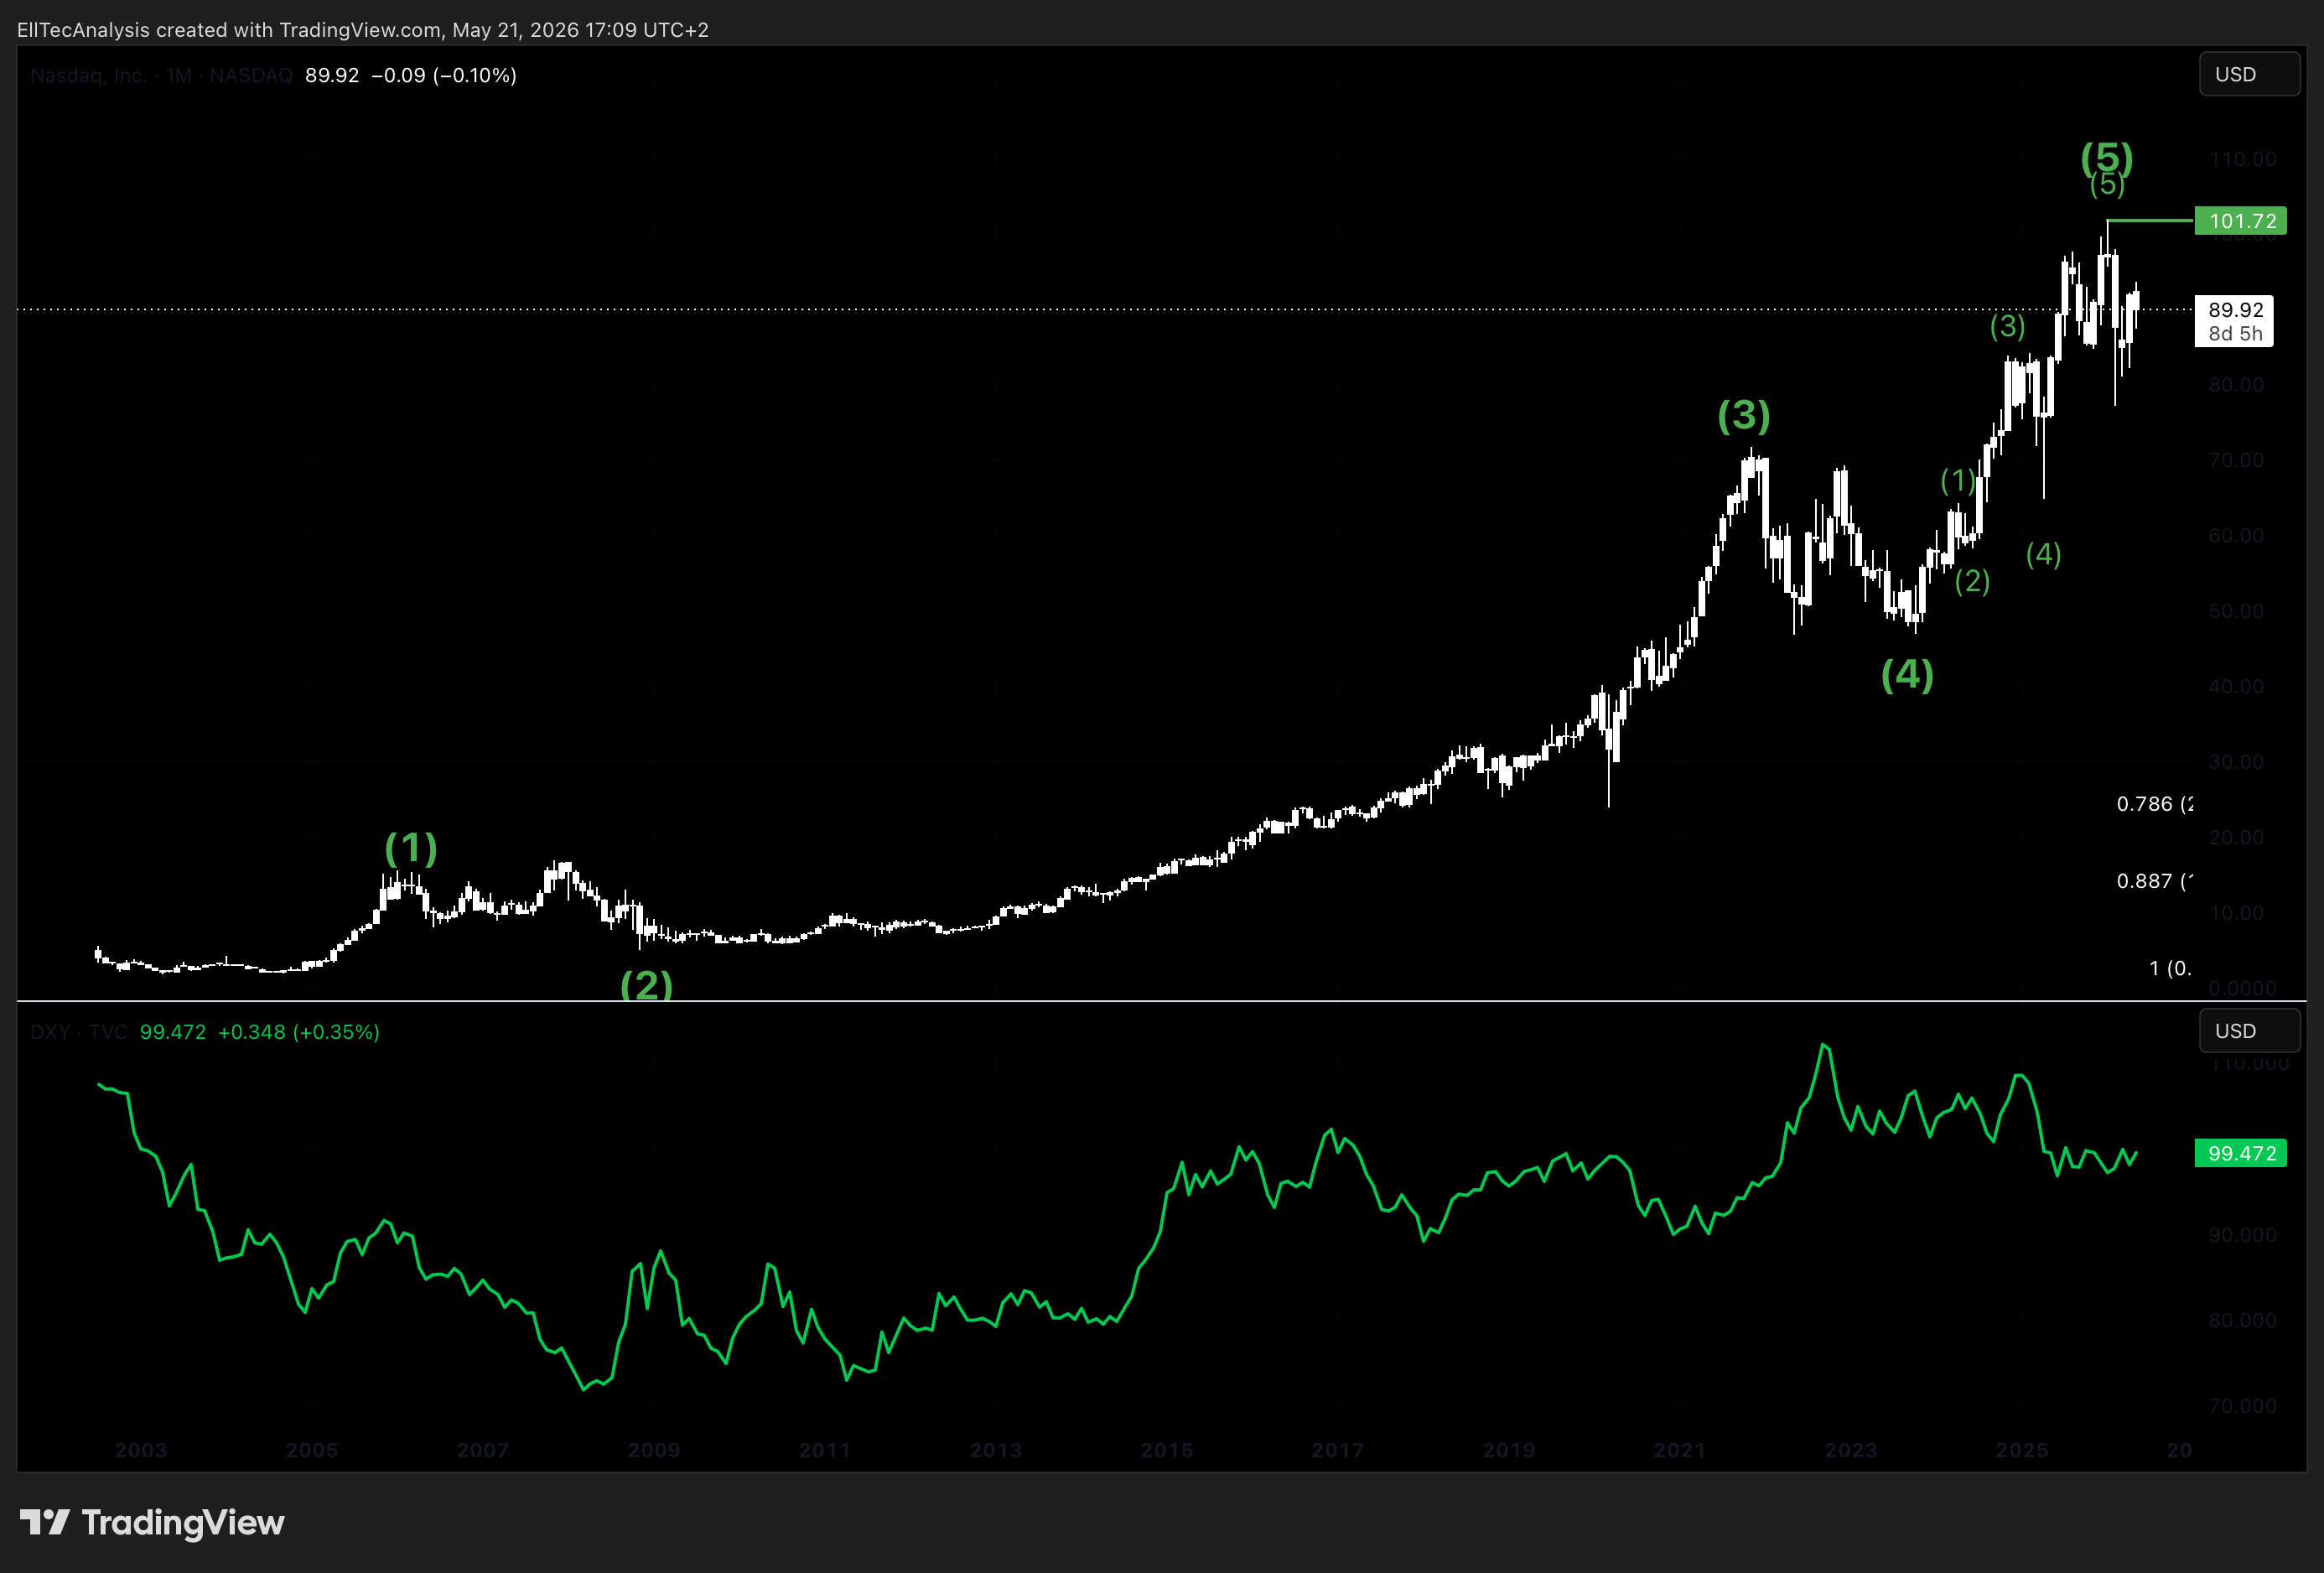
USD dynamics affect Nasdaq Inc. through two primary channels. First, as a globally operating financial technology company, a stronger USD compresses the USD-equivalent value of international revenues. Second, a rising DXY tends to correlate with tighter global USD liquidity conditions, which broadly suppress risk asset valuations and capital market activity. Phases of USD weakness have historically coincided with equity market expansion and elevated market participation levels, creating a supportive environment for exchange and financial infrastructure revenues.
Exchange Peers and Financial Sector
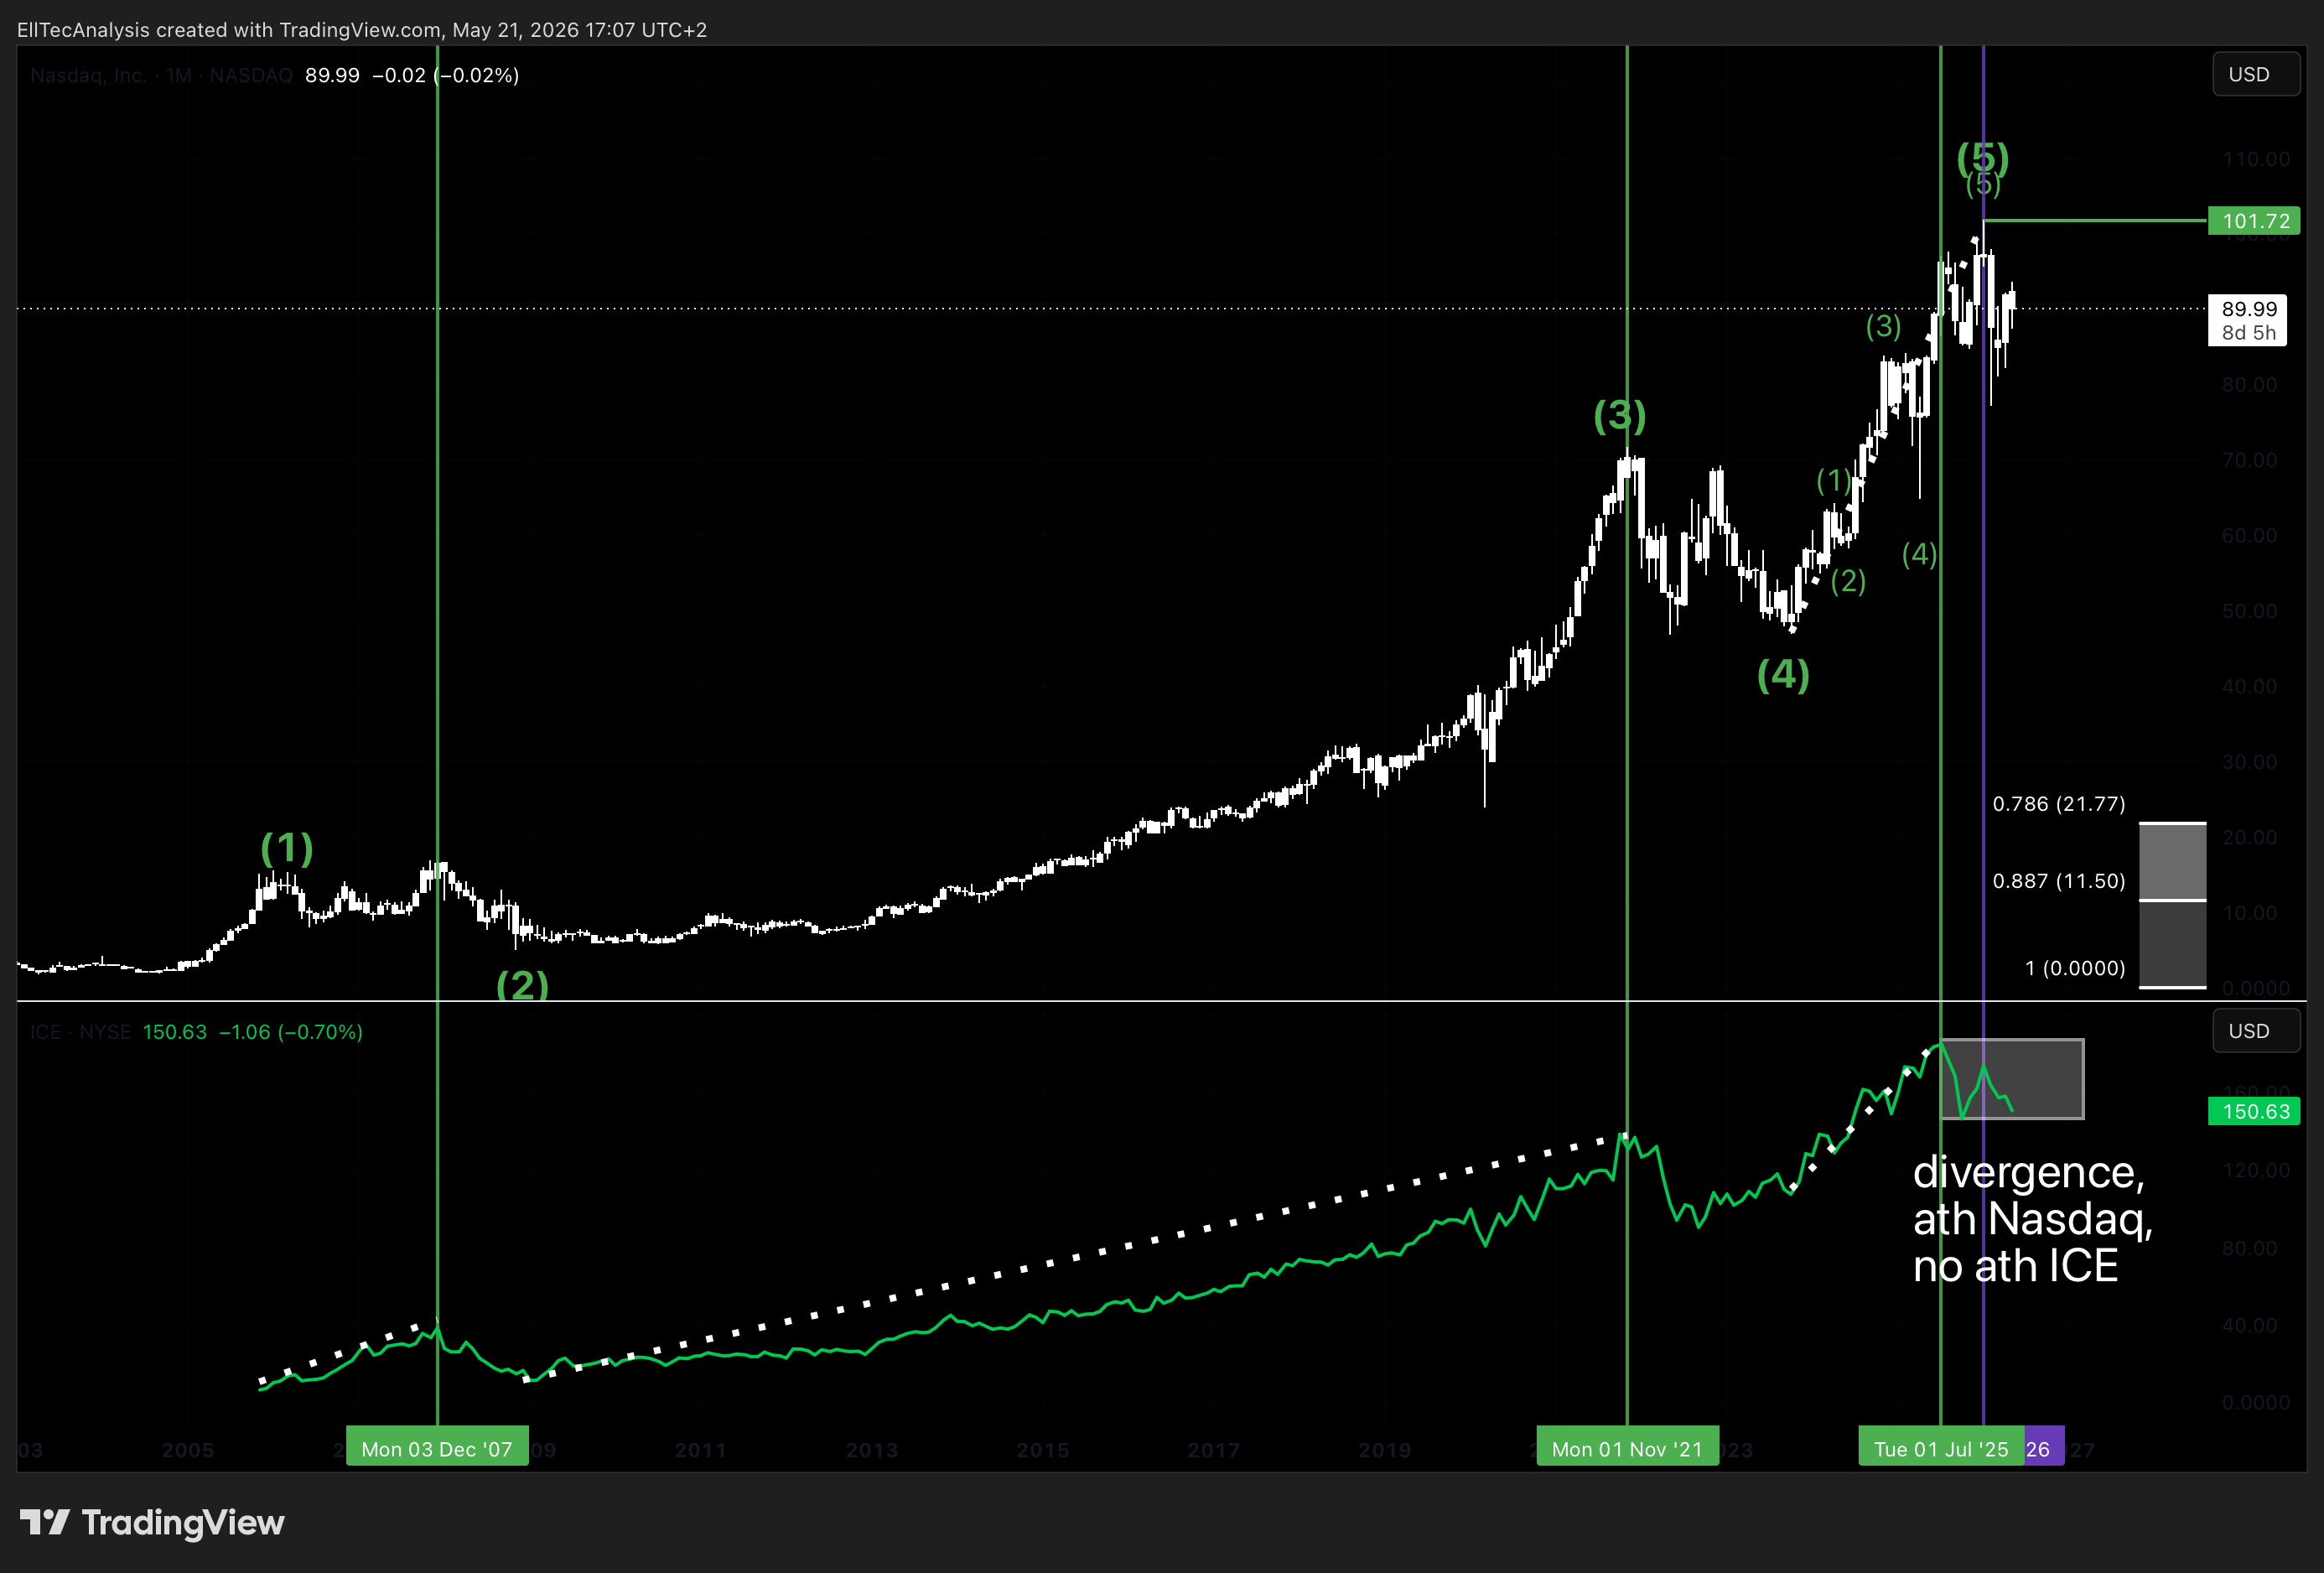
Within the financial sector, Nasdaq Inc. moves broadly in line with major exchange and market infrastructure peers such as Intercontinental Exchange (ICE) and CME Group. However, Nasdaq’s higher technology revenue composition and SaaS-oriented growth profile mean it commands a valuation premium relative to more operationally pure exchange businesses. Divergences in relative performance between NDAQ and its exchange peers can signal shifts in technology sector sentiment or company-specific re-rating events, both of which are relevant for the structural wave count.
Global Liquidity and M2 Money Supply
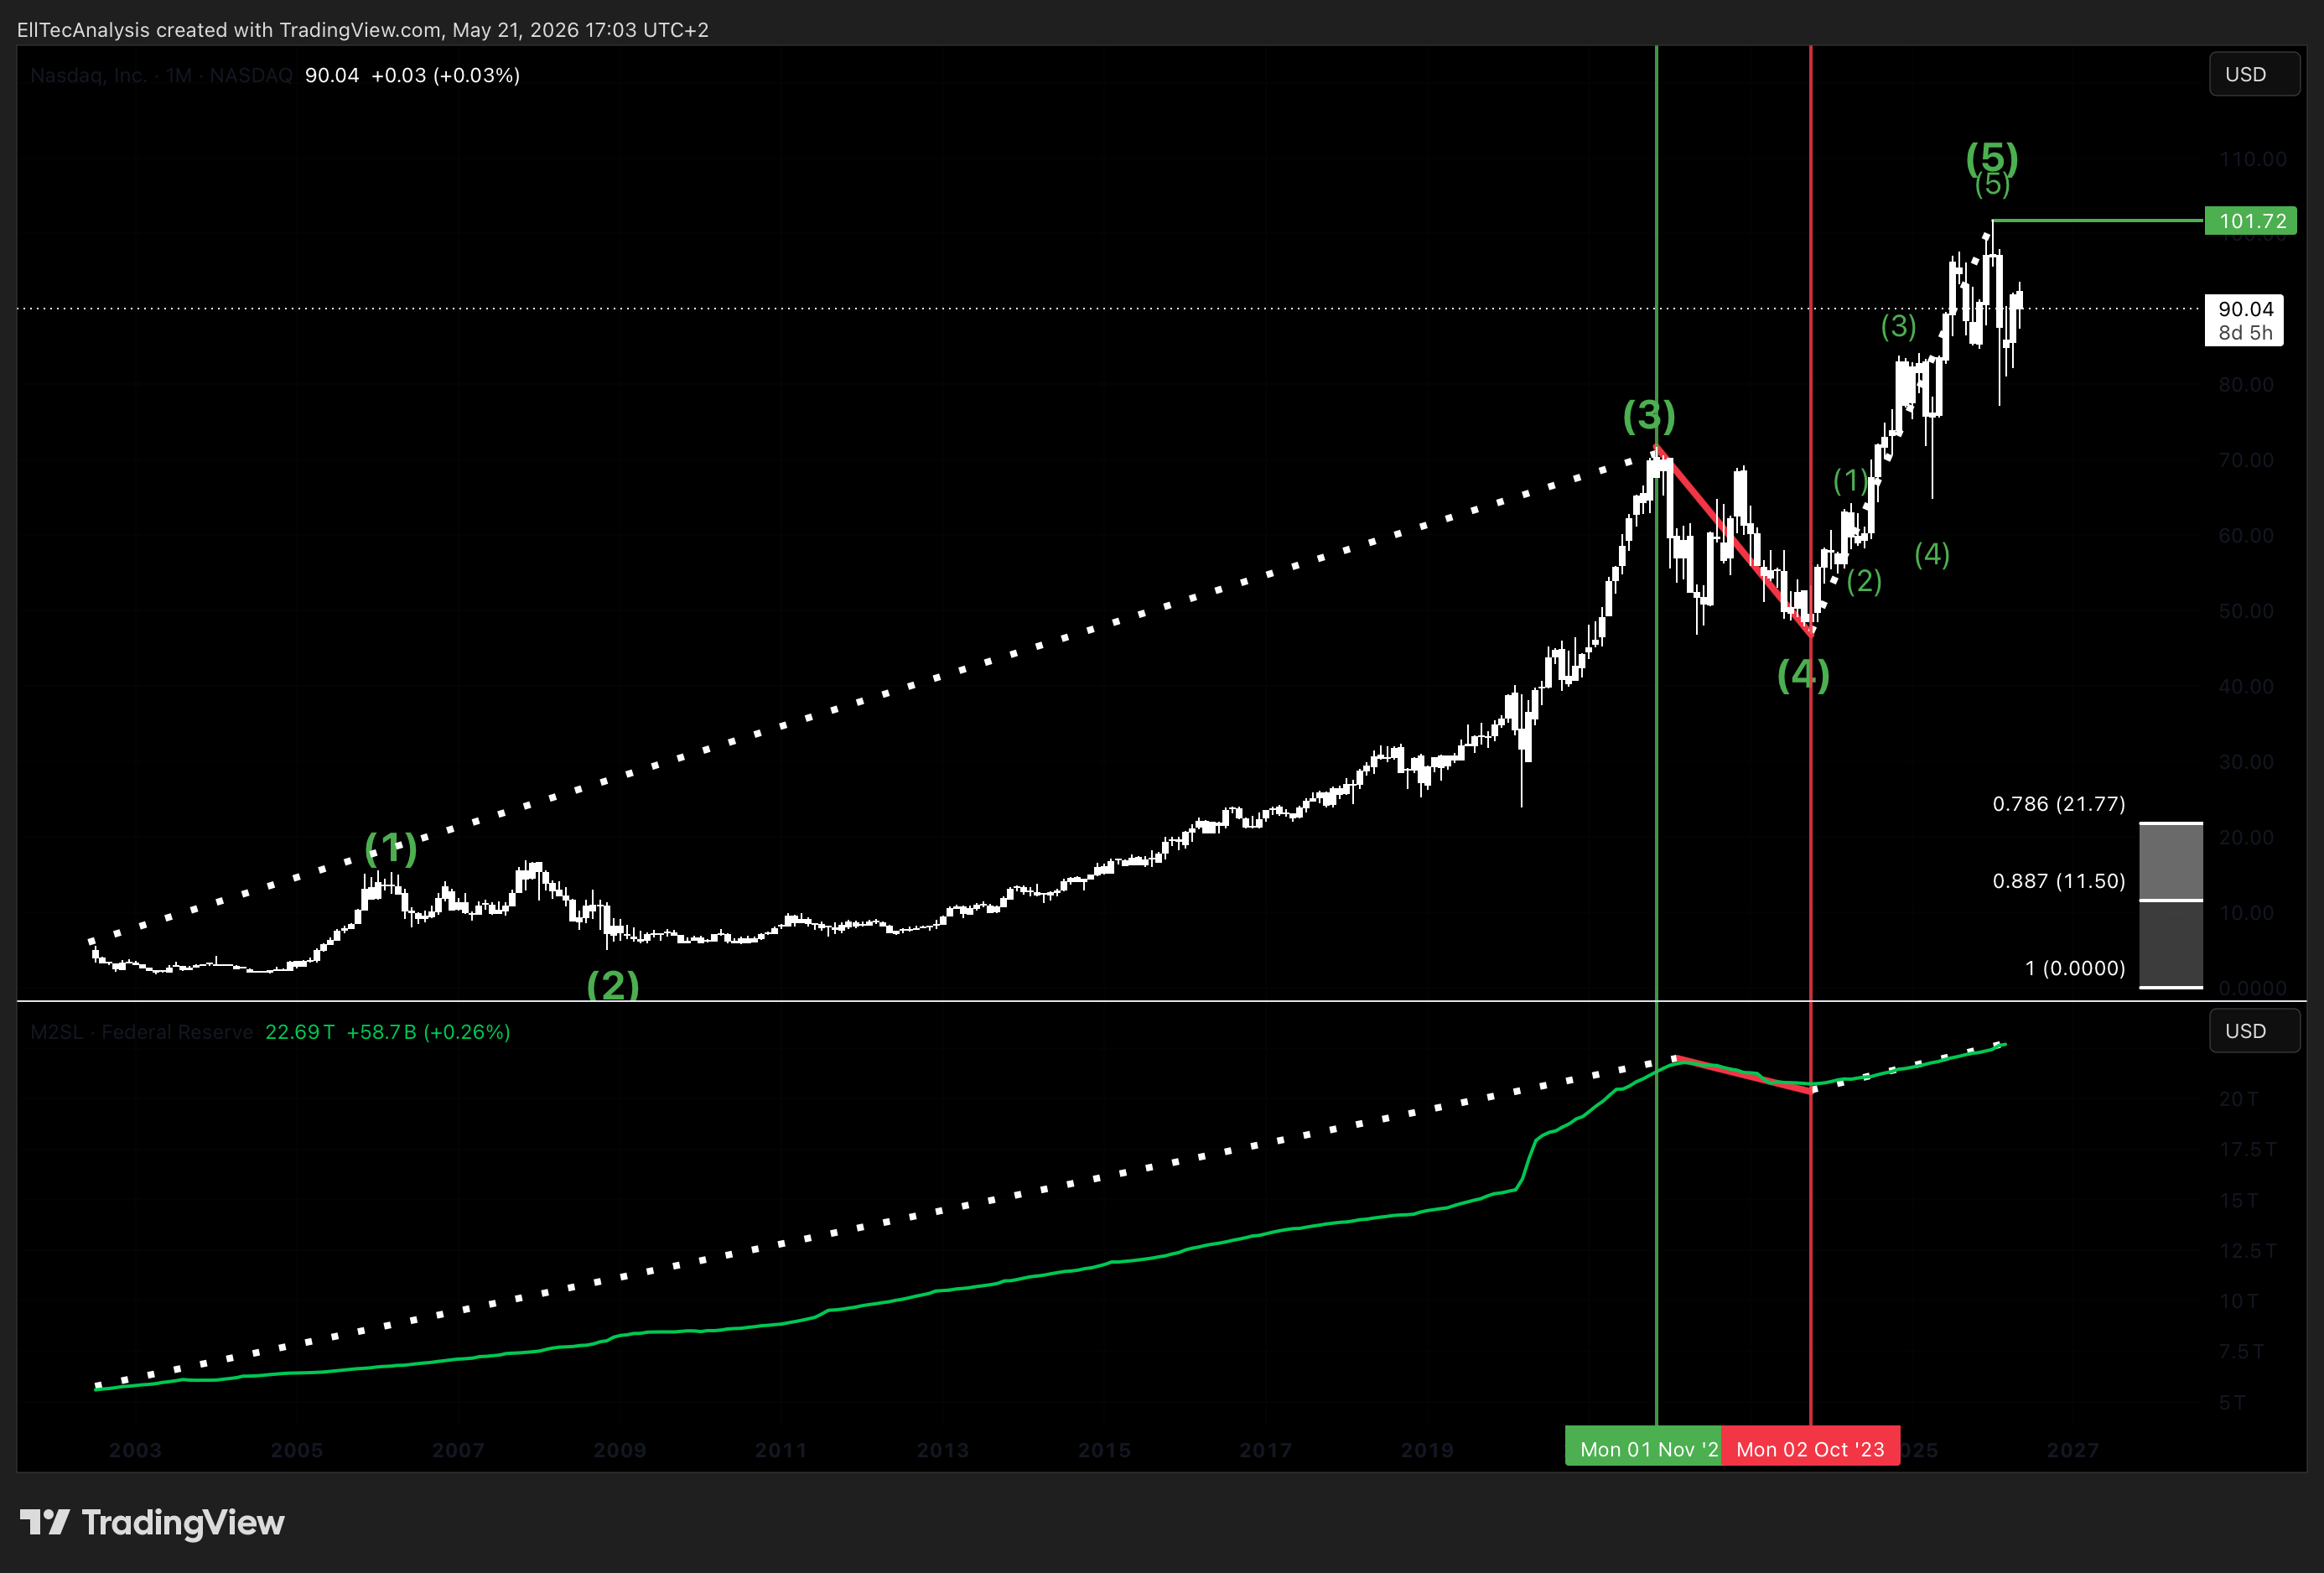
Global liquidity conditions, proxied through M2 money supply dynamics, represent a macro backdrop variable with meaningful directional influence on Nasdaq Inc.’s valuation. Periods of M2 contraction or deceleration historically correspond with multiple compression phases in technology-adjacent equities. The current macro environment, characterized by post-pandemic liquidity normalization, remains a relevant headwind for the corrective scenario and supports the case for a deeper structural retracement before the next major expansion phase.
3. Technical Analysis — Elliott Wave Framework


From an Elliott Wave perspective, Nasdaq Inc. is currently interpreted to be in the early development phase of a higher-degree Wave 2 correction, following the completion of a multi-year impulsive Wave 1 advance. The structure that has been forming since the Wave 1 high suggests a complex corrective cycle is now unfolding, with significant downside potential before the next major impulsive expansion phase materializes.
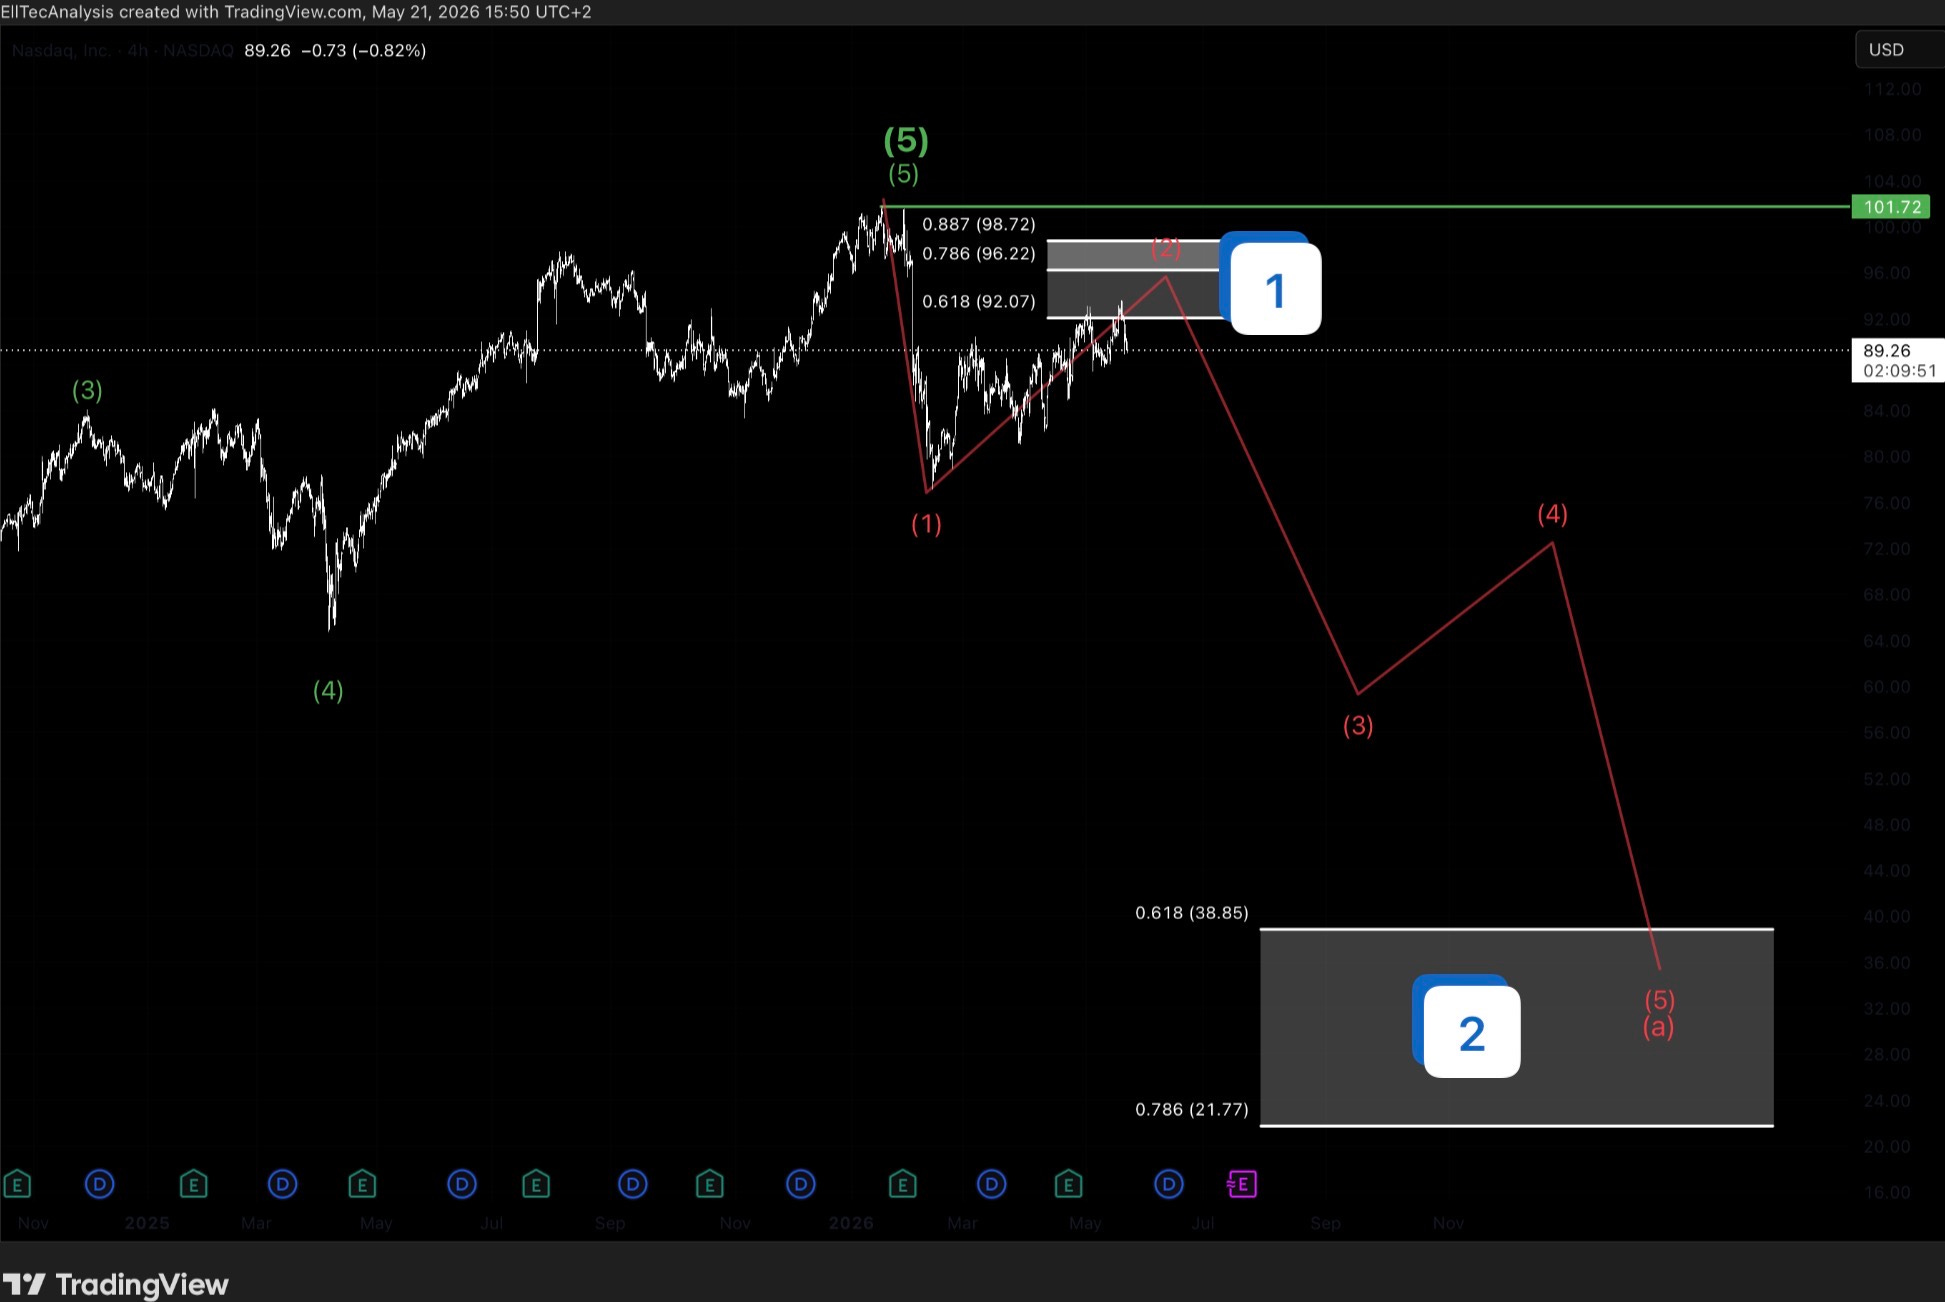
Within this higher-degree Wave 2, the current working interpretation identifies an A-wave as the first major corrective leg. The internal structure of this A-wave follows a classic five-wave impulse sequence, consistent with the Elliott Wave rule that A-waves within flat or zigzag corrections can themselves be impulsive.
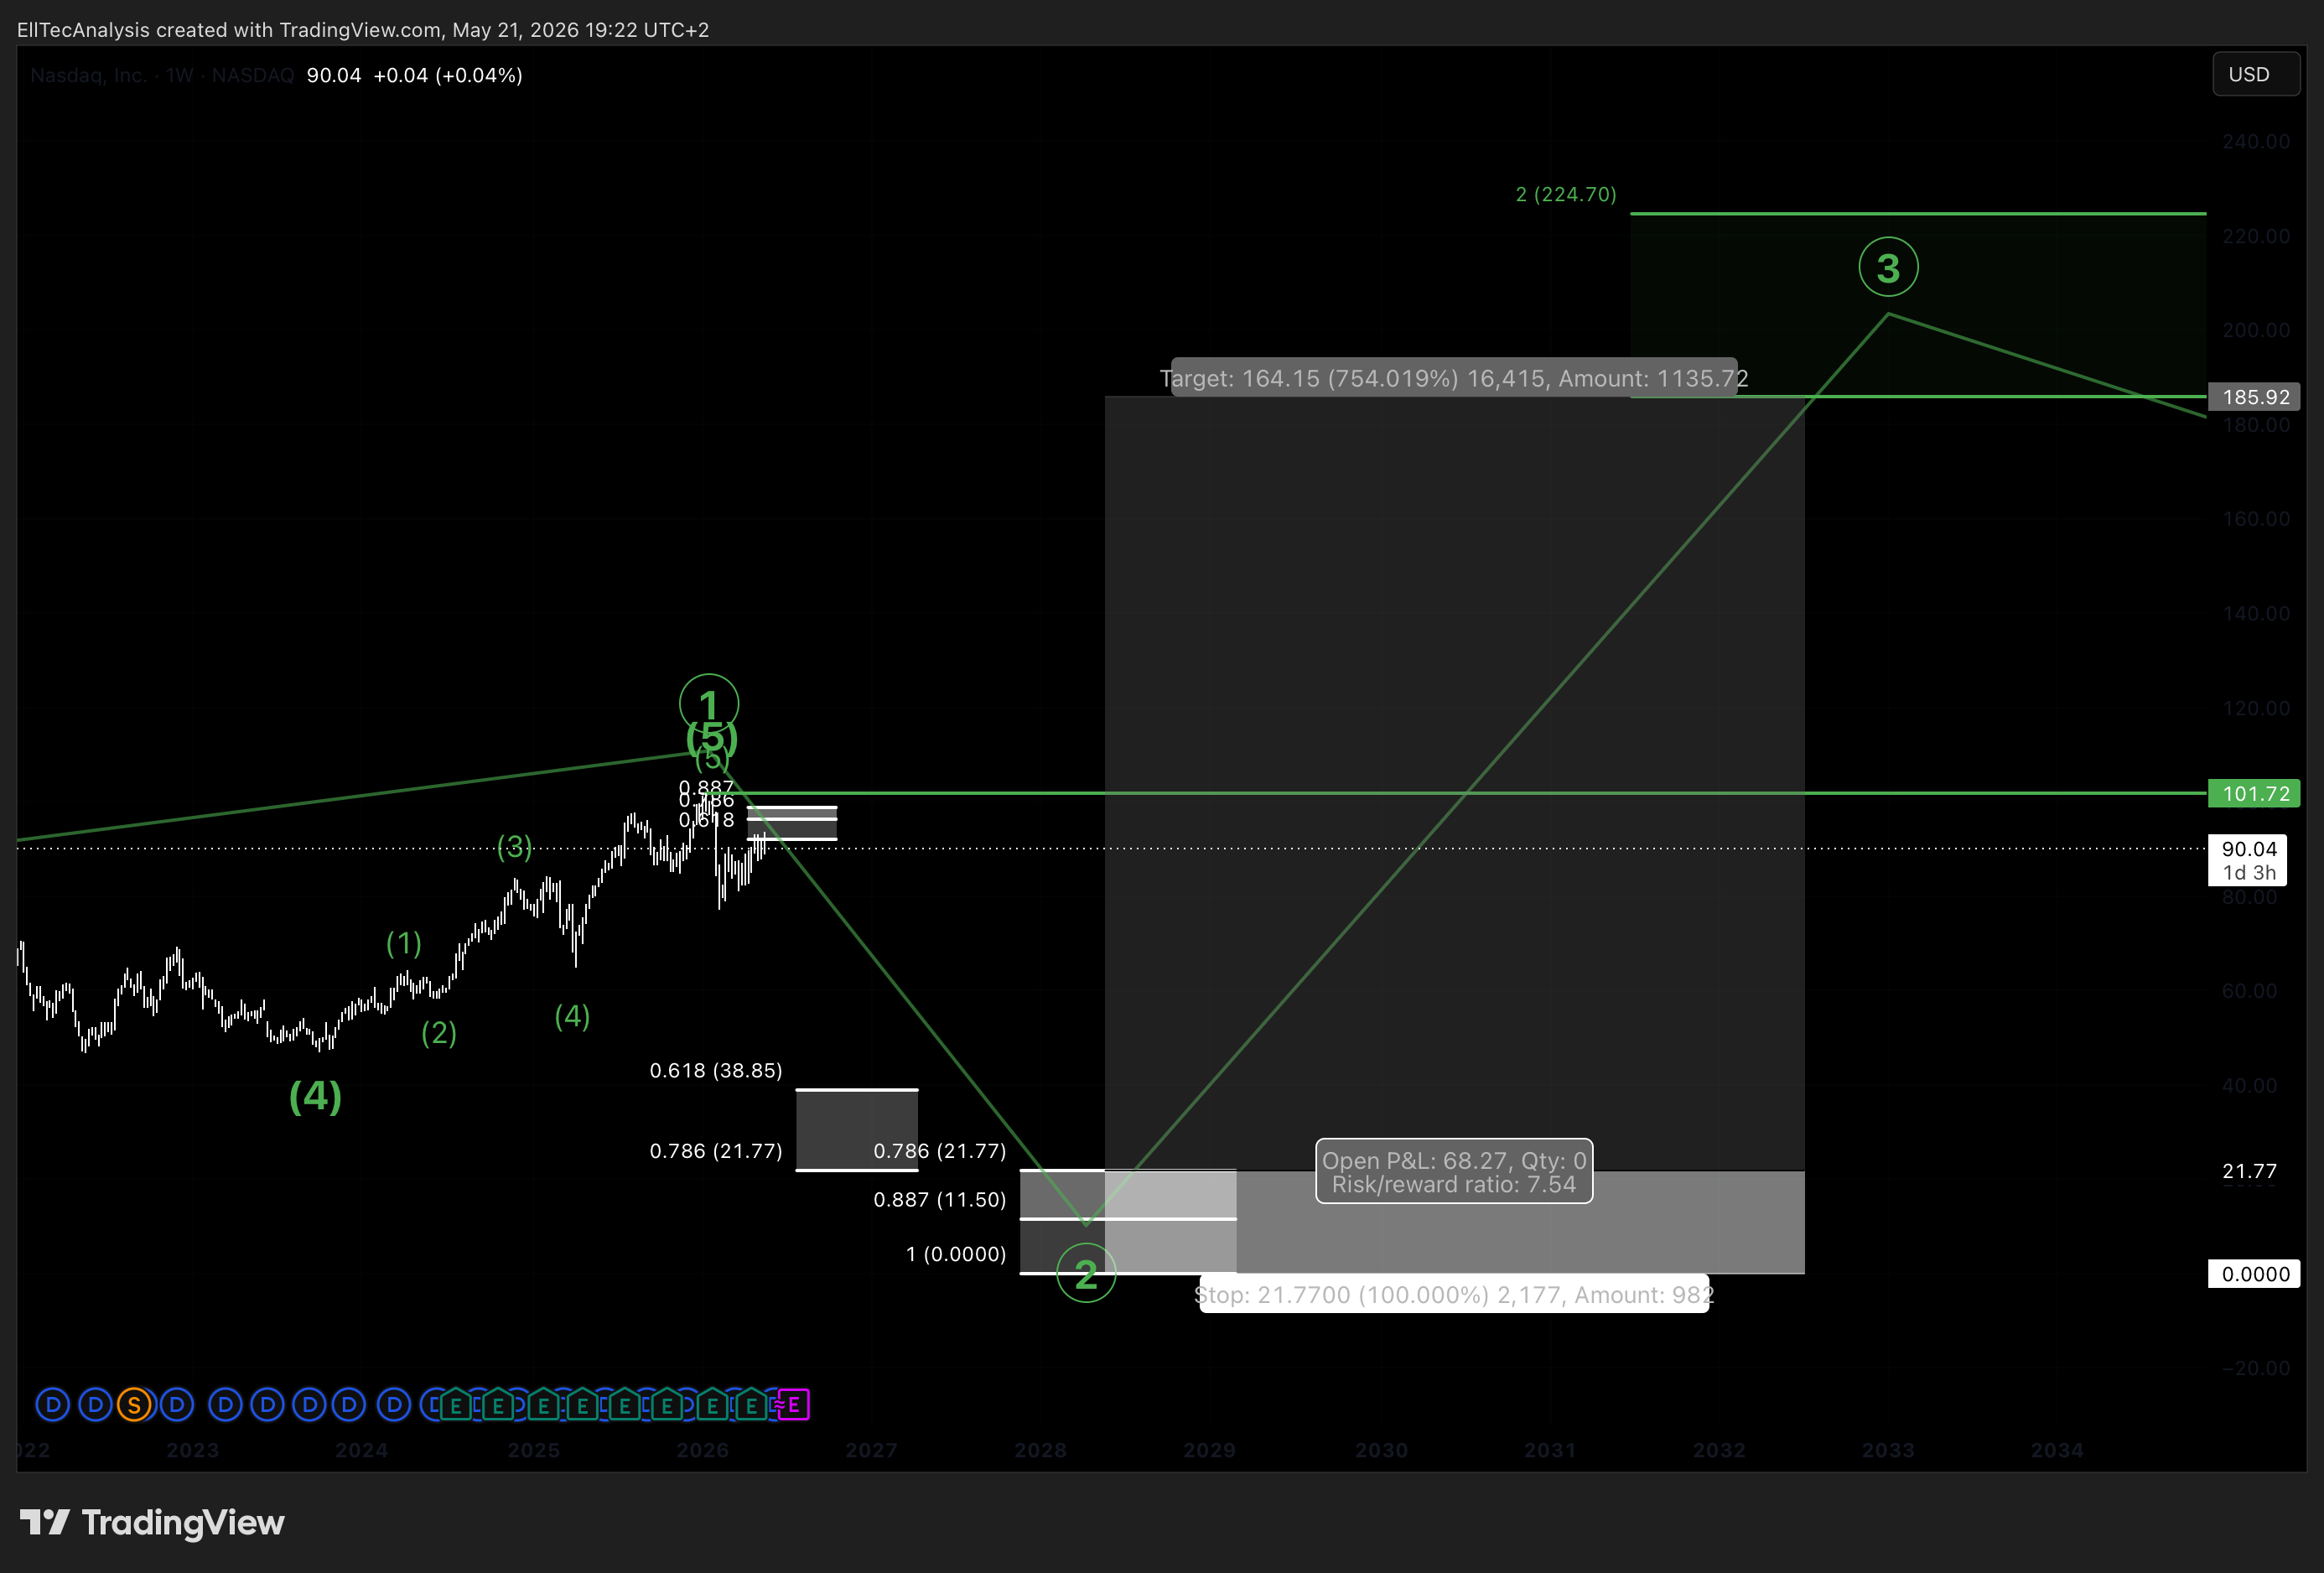
The market has already tested Target Zone 1 — the zone in which the A-wave’s sub-Wave 2 is expected to complete — and has reacted lower from this region. While this initial reaction raises the possibility that sub-Wave 2 has already concluded, EllTec Analysis maintains that a secondary retest of Target Zone 1 remains the higher-probability outcome. The expectation is that the market will make one further push into Target Zone 1 before establishing the definitive reversal.
The key structural invalidation level for the entire bearish Wave 2 thesis is defined at 101.72 USD, which marks the Wave 1 top. Under Elliott Wave rules, a Wave 2 correction cannot exceed the origin of Wave 1 — a sustained close above 101.72 USD would immediately invalidate the corrective interpretation and imply that either Wave 1 is still extending or an entirely different wave structure is forming.
Following the completion of the A-wave’s sub-Wave 2 within Target Zone 1, EllTec Analysis anticipates the following sequential structure to unfold: Wave 3 down as the most impulsive and typically the most extended decline within the A-wave, followed by a Wave 4 corrective counter-rally, and then a final Wave 5 completing the full A-wave structure within Target Zone 2. This five-wave A-wave completion would then set the stage for a B-wave rebound, followed by a final C-wave decline completing the full higher-degree Wave 2 correction within Target Zone 3.
Target Zone 2 — A-Wave Completion:
- Upper boundary: 38.85 USD (61.8% Fibonacci retracement)
- Lower boundary: 21.77 USD (78.6% Fibonacci retracement)
This zone represents the expected completion area for the full five-wave A-wave structure. The 61.8% and 78.6% Fibonacci retracement levels define a classical high-probability reversal corridor — also known as the golden zone — where corrective waves in well-structured impulsive cycles tend to find support. A reaction from this zone would signal the beginning of the B-wave counter-rally. Following the A-wave completion, a B-wave rebound will follow. Depending on its structure and magnitude, EllTec Analysis will define precise targets for the B-wave when it is sufficiently developed. It is theoretically possible that the B-wave produces a new all-time high — an overshoot formation — which would then be evaluated in real time.
Target Zone 3 — C-Wave and Full Higher-Degree Wave 2 Completion:
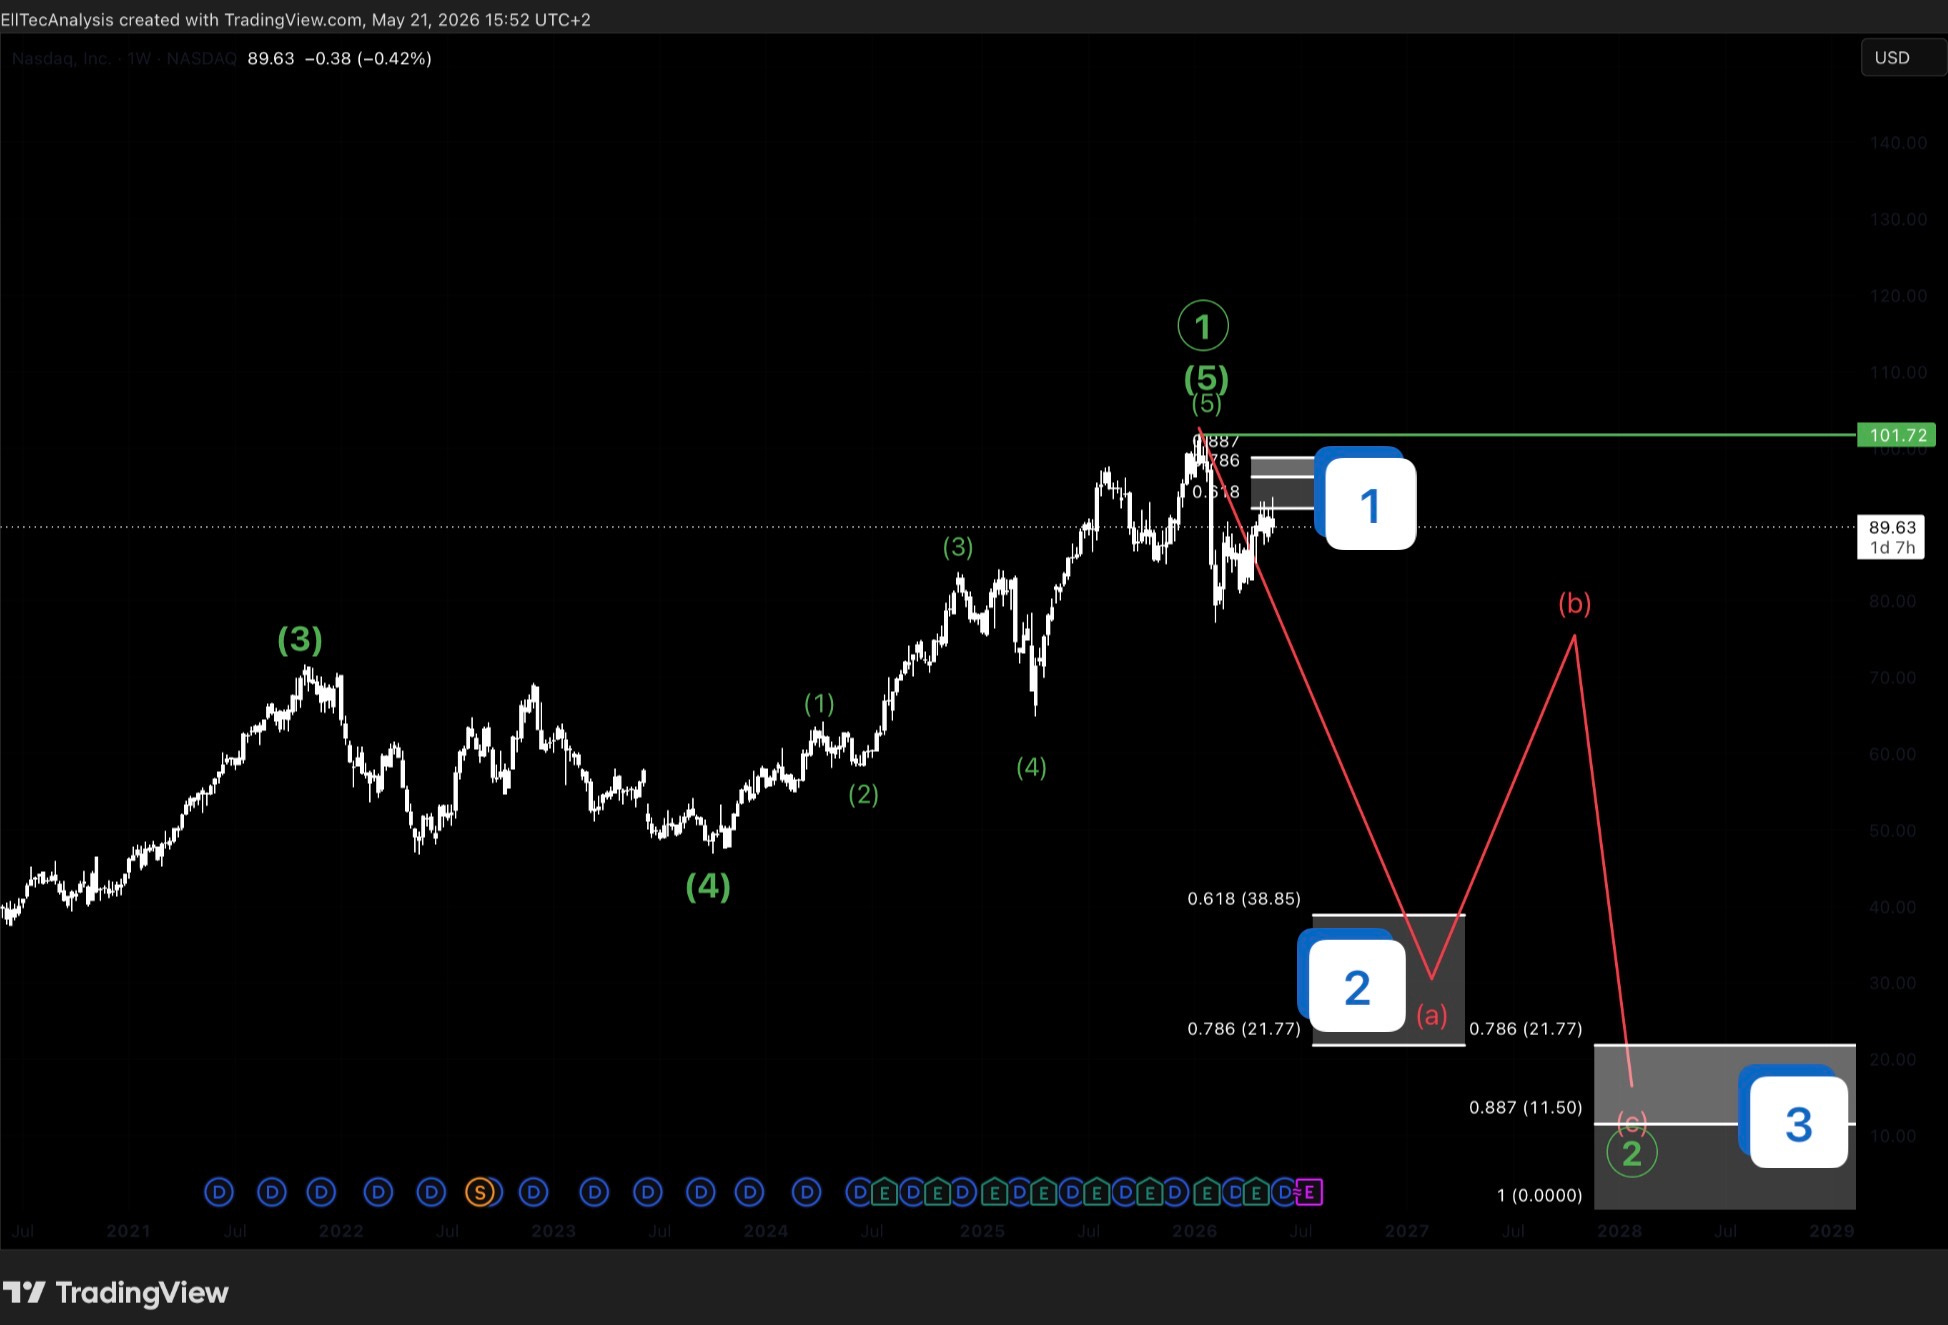
- Upper boundary: 21.77 USD (78.6% Fibonacci retracement)
- Mid-zone reference: 11.50 USD (88.7% Fibonacci retracement)
Target Zone 3 marks the projected completion area for the full higher-degree Wave 2 correction, encompassing the terminal C-wave. The overlap between the lower boundary of Target Zone 2 and the upper boundary of Target Zone 3 creates a structurally significant confluence region. The B-wave dynamic will significantly inform the precise final targets within this zone, and EllTec Analysis will update the projections accordingly as the structure develops.
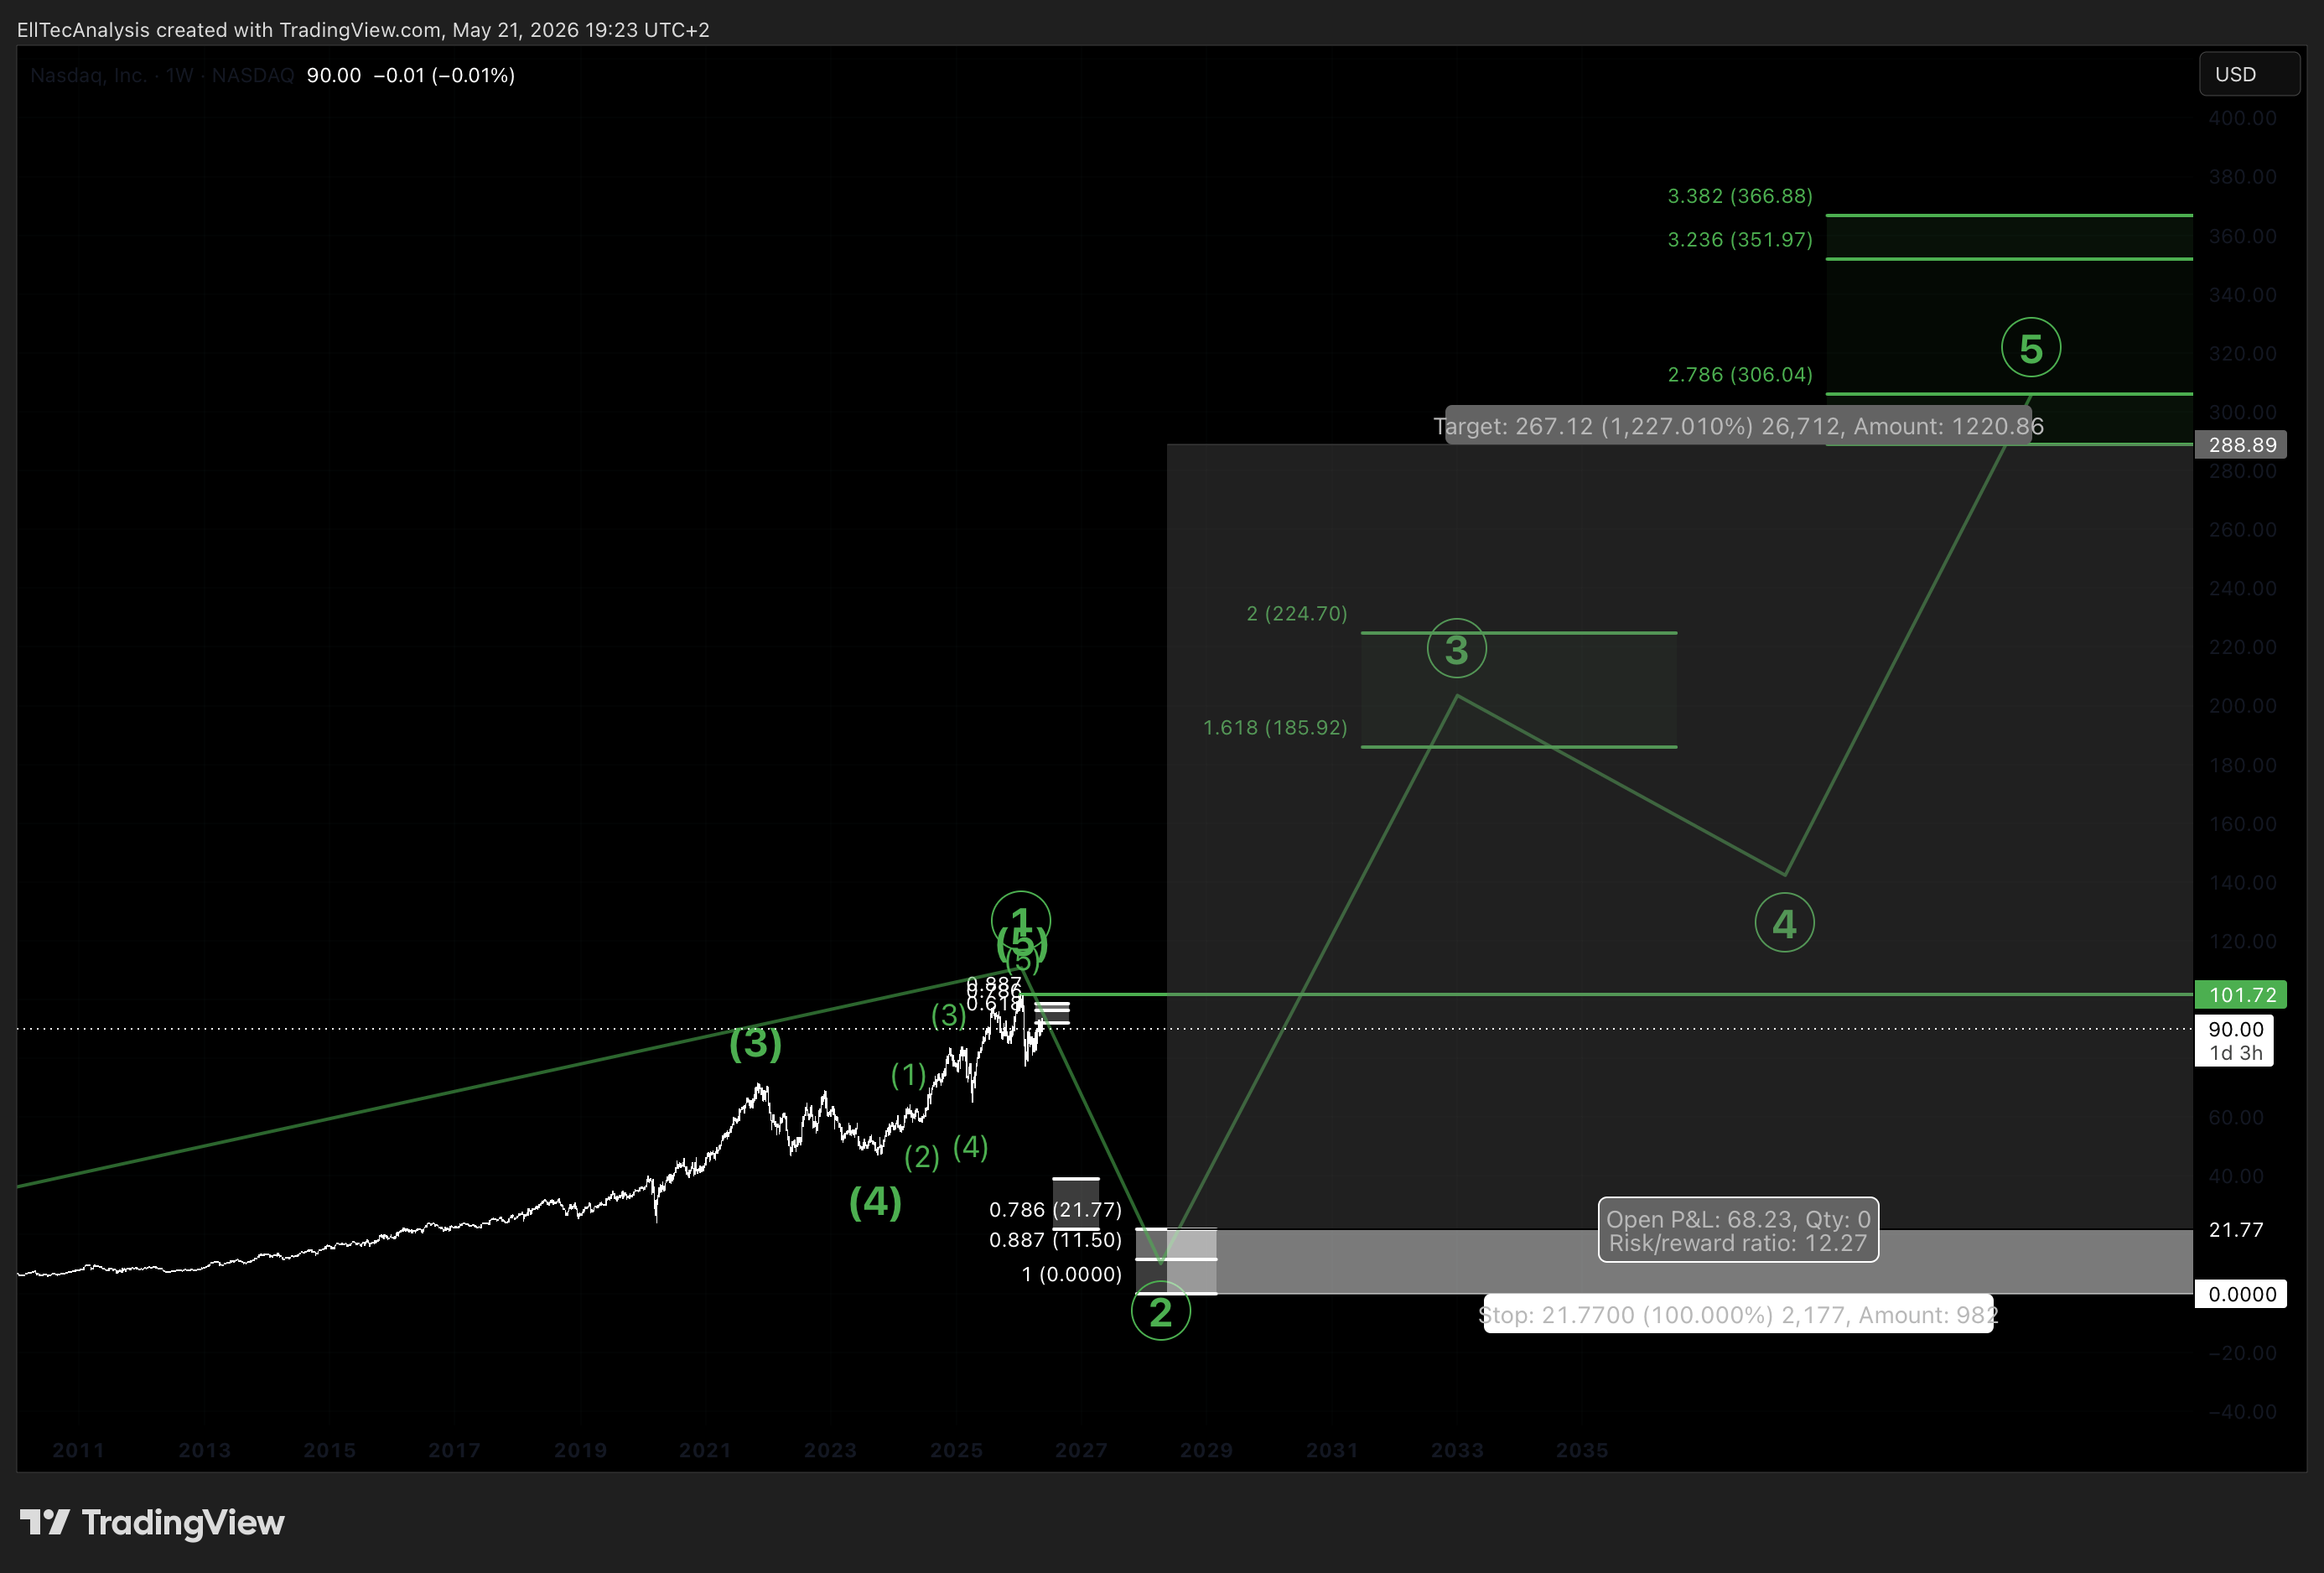
Target Zone 4 — Higher-Degree Wave 3 Expansion:

- Lower boundary reference: 185.92 USD (1.618 Fibonacci extension)
Following the completion of the full higher-degree Wave 2 correction, Target Zone 4 represents the primary expansion phase driven by the next major impulsive Wave 3. This zone defines the area where the first major profit-taking level is reached within the long-term structural trade.
Target Zone 5 — Higher-Degree Wave 5 Terminal Extension:
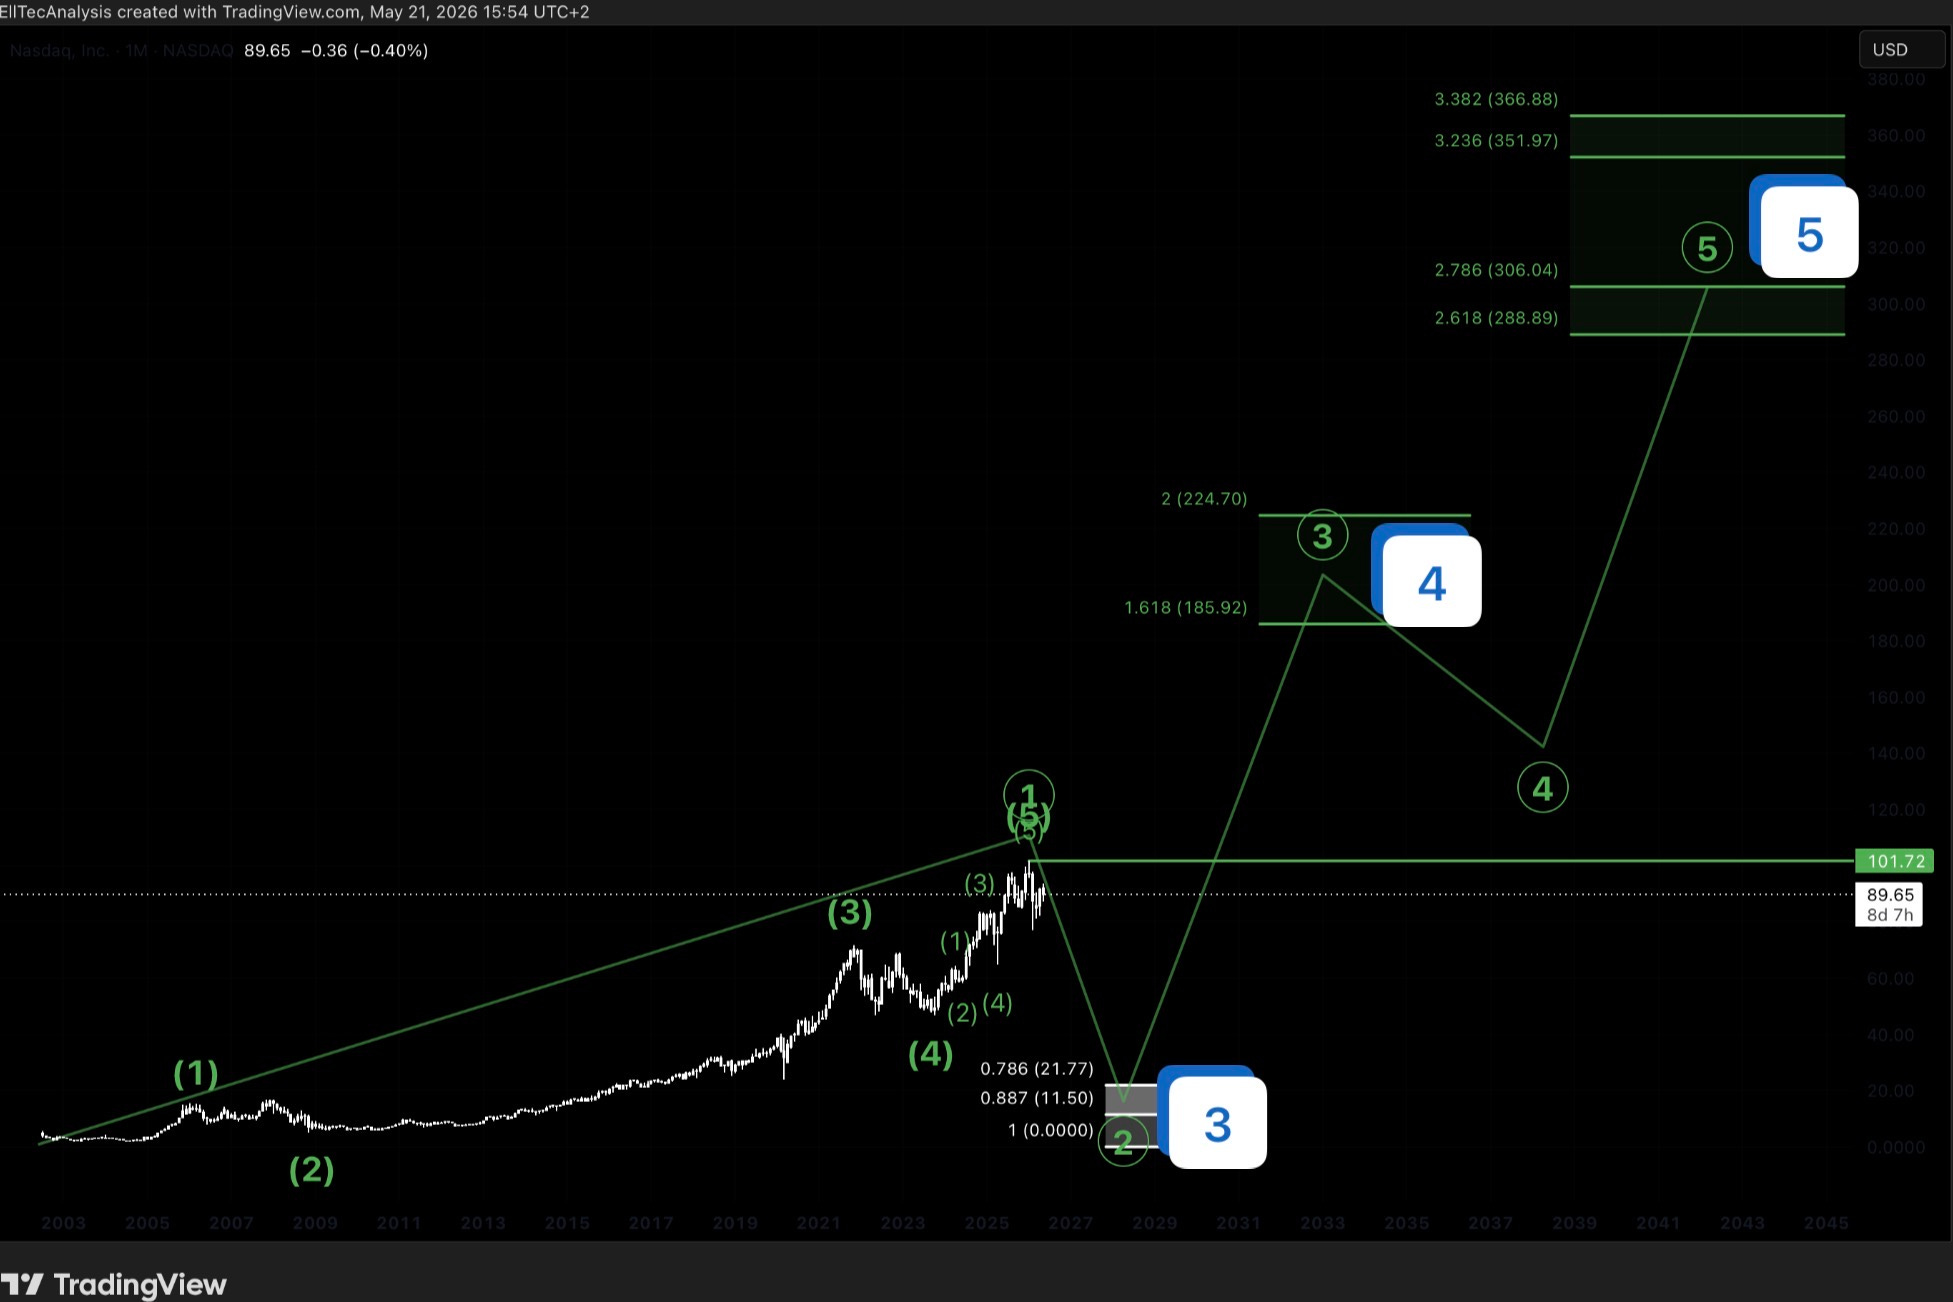
- Lower boundary reference: 288.89 USD (2.618 Fibonacci extension)
Target Zone 5 marks the projected terminal zone for the full higher-degree five-wave impulsive cycle following Wave 2 completion. This represents the long-term structural price objective and the defined full-exit level for the multi-year position.
4. Alternative Scenarios
Scenario 1: Break Above 101.72 USD — Wave 2 Thesis Invalidation
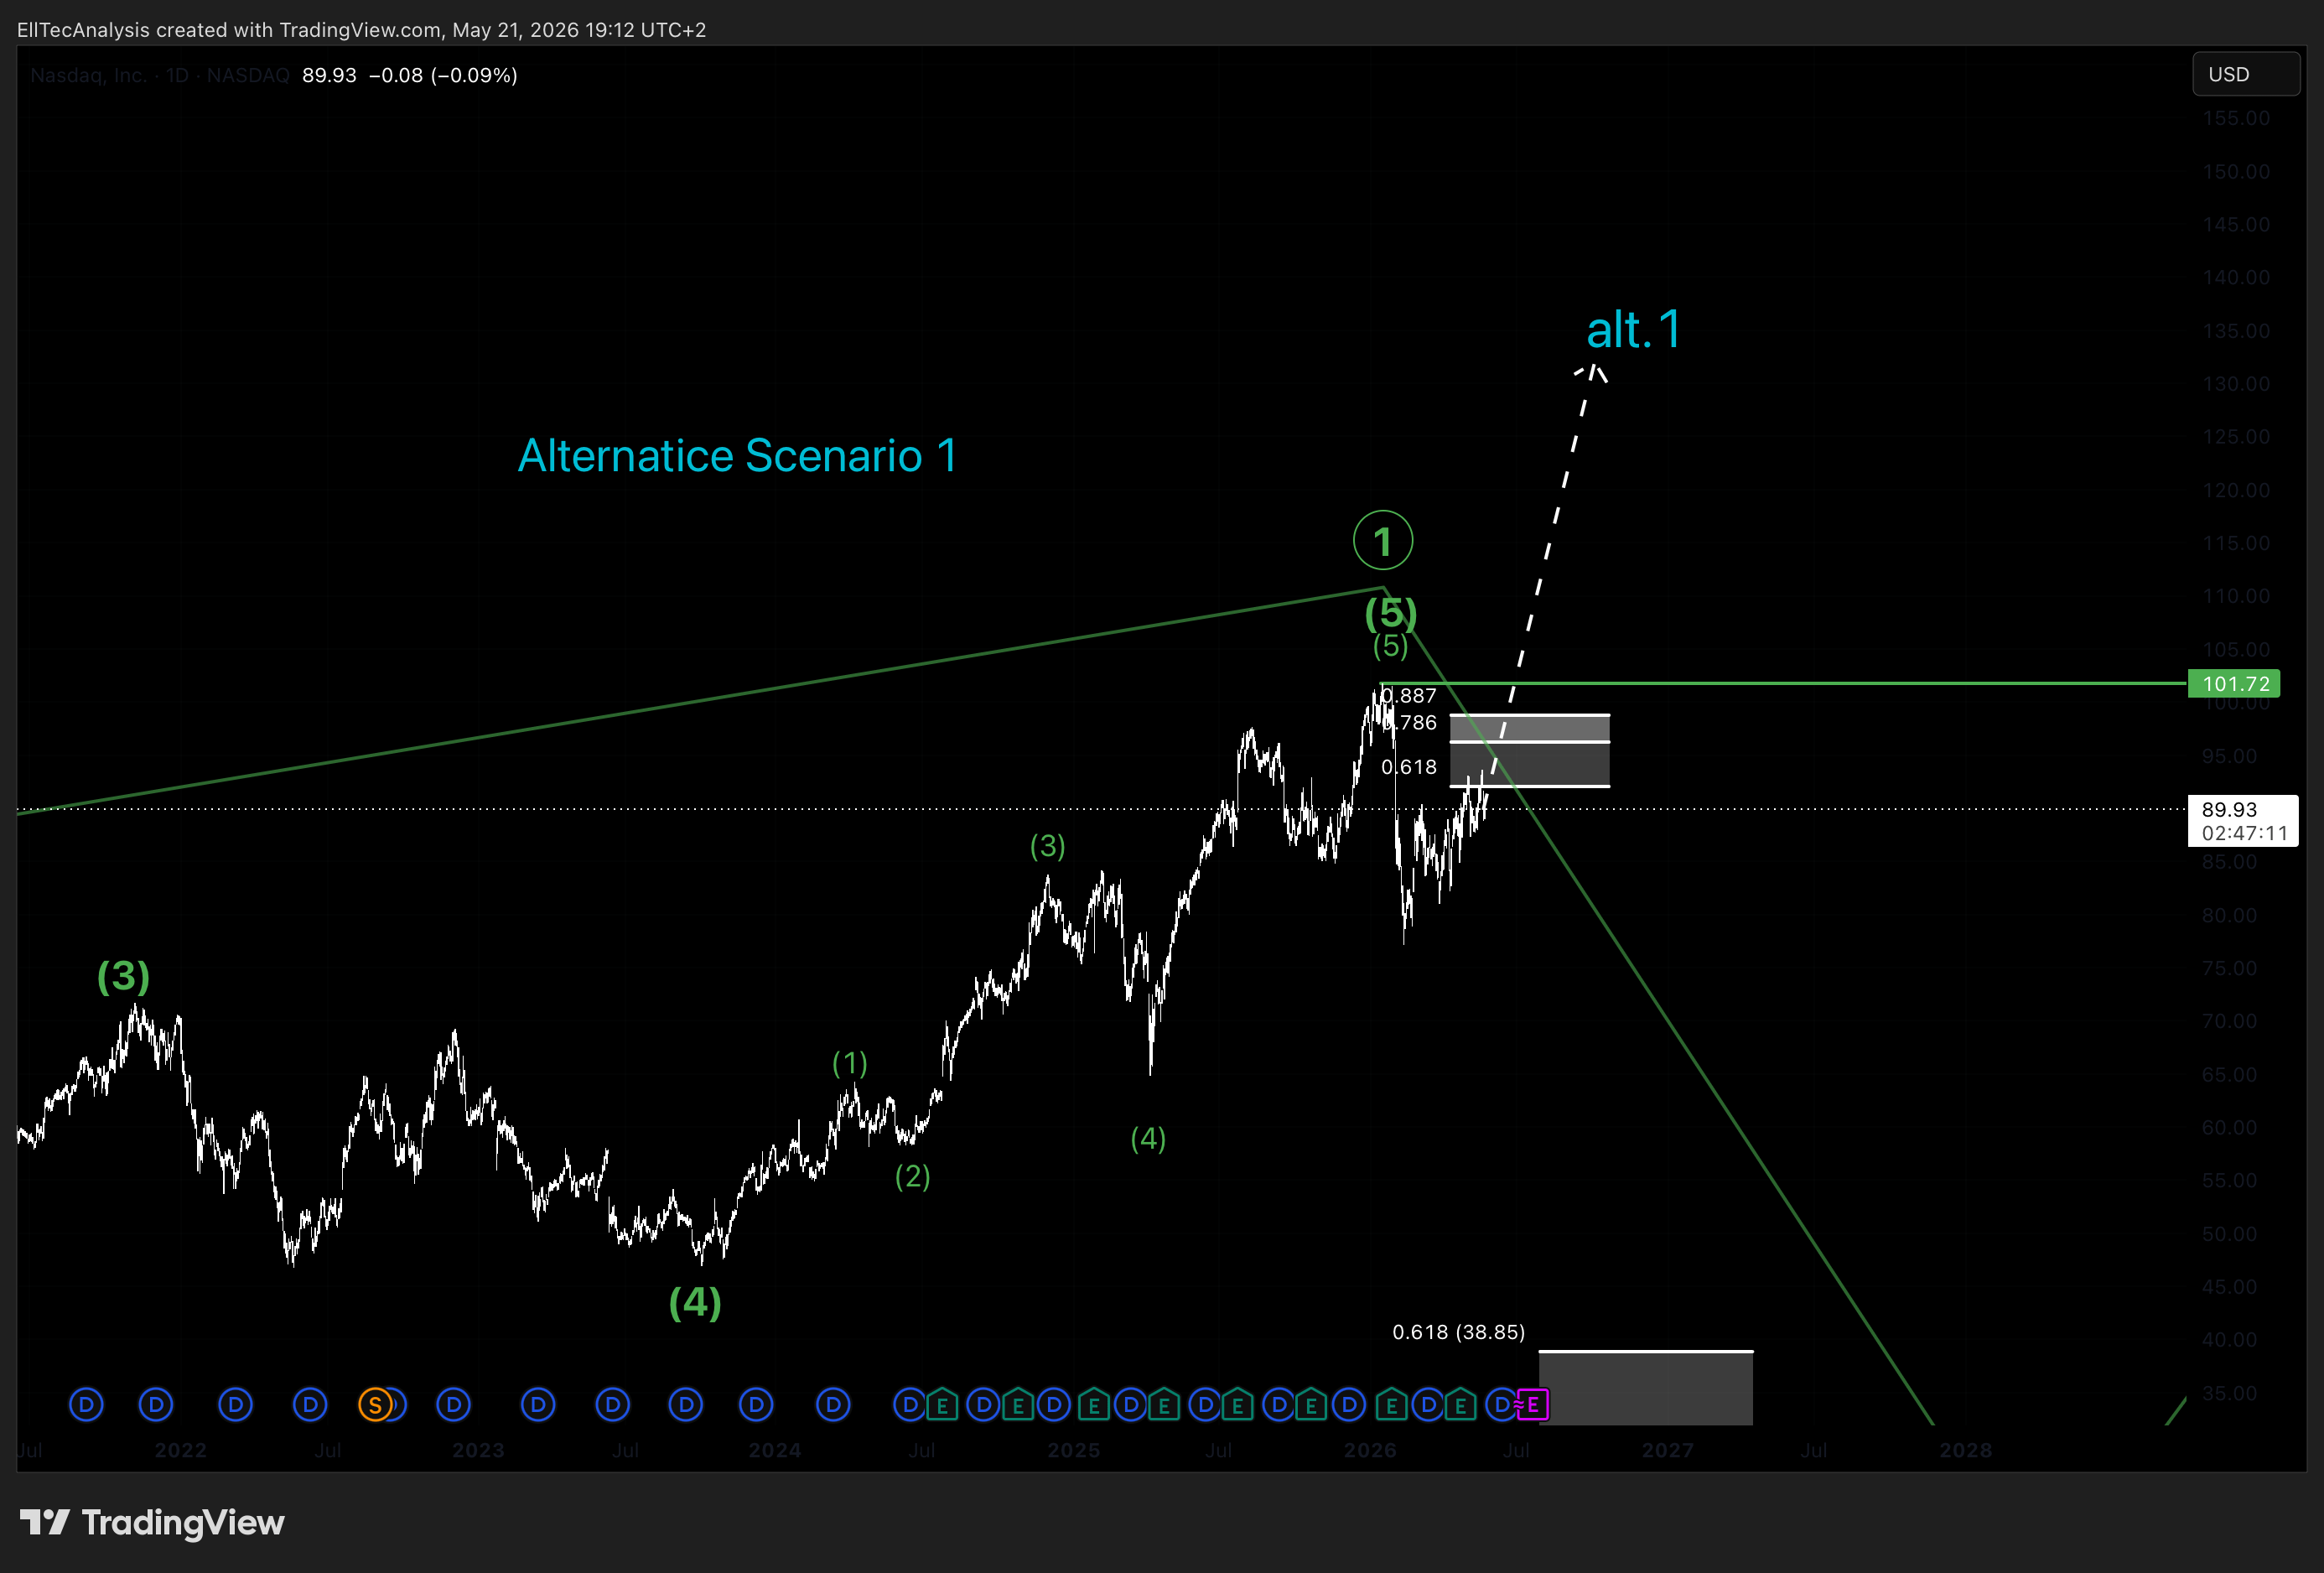
A sustained close above 101.72 USD would immediately and definitively invalidate the current Wave 2 corrective thesis. Under Elliott Wave rules, a Wave 2 cannot retrace beyond the origin of the preceding Wave 1. A move above this level would imply one of two structural recounts: either the broader impulsive Wave 1 structure is still extending and has not yet completed, or the wave labeling at a higher degree requires a fundamental reassessment. In either case, the bearish corrective framework outlined in this analysis would be suspended, and EllTec Analysis would reassess the count from an unbiased structural basis.
Scenario 2: Shallower Correction — Target Zones Not Reached
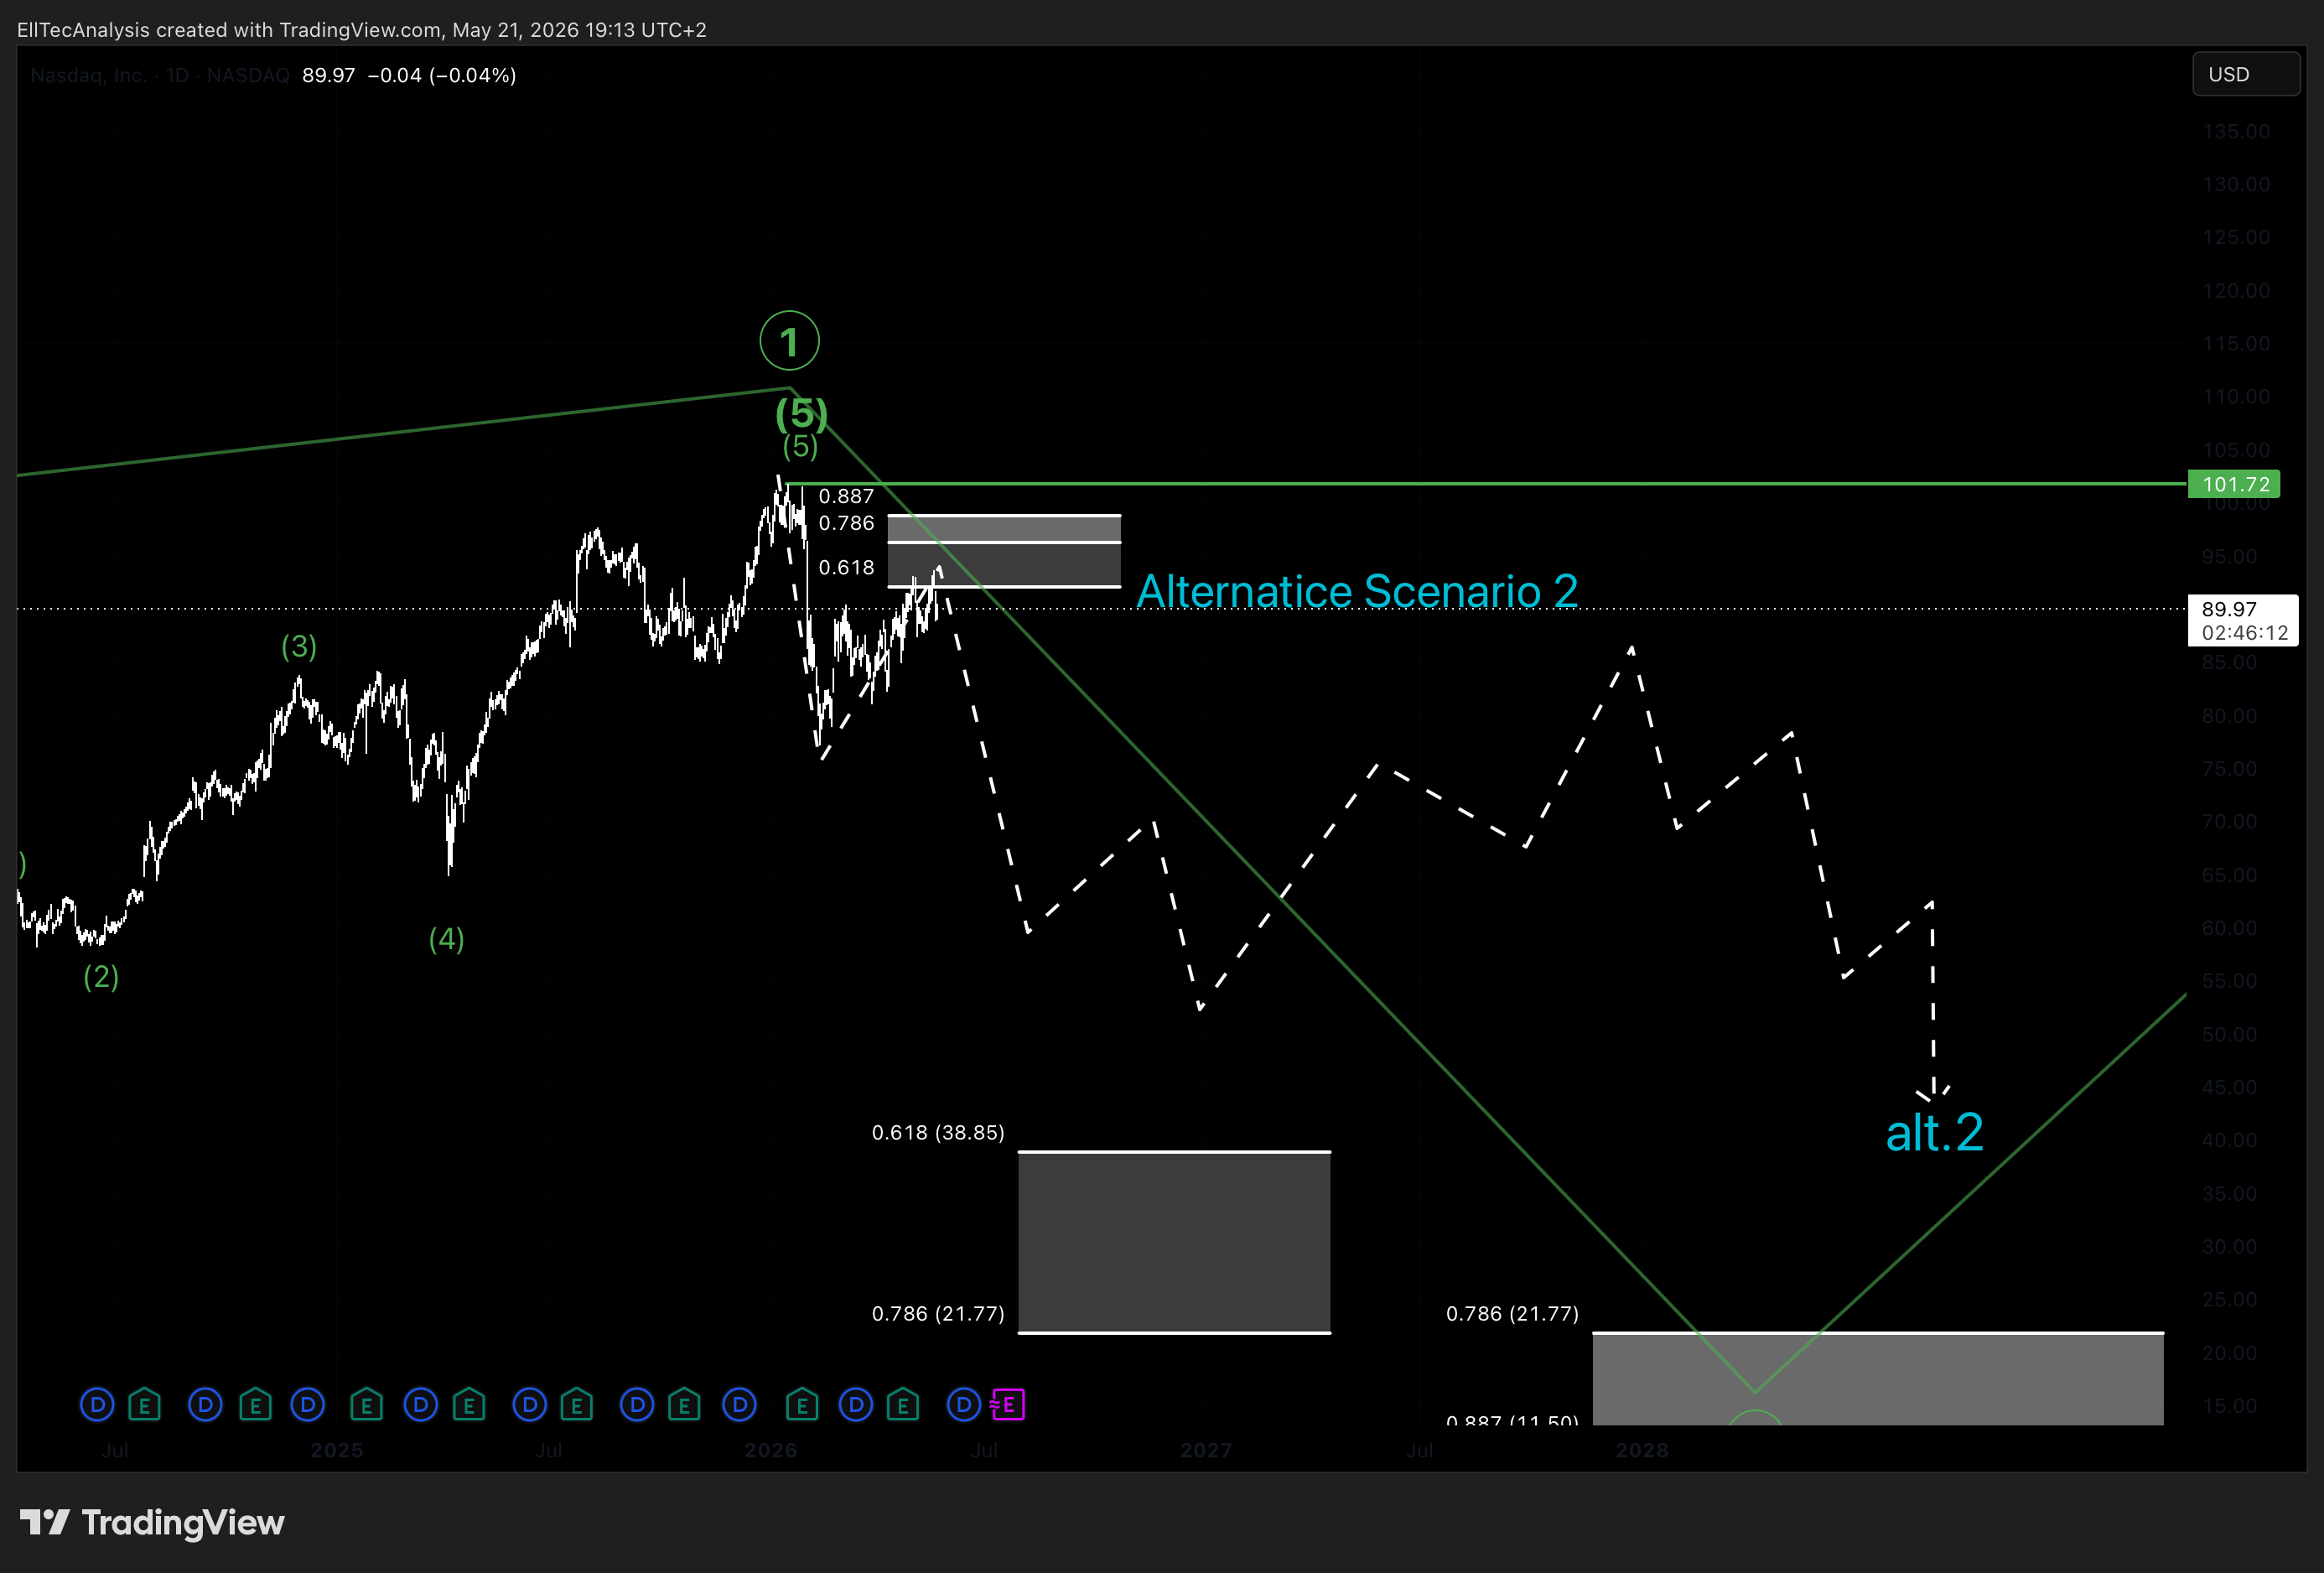
An alternative corrective path involves a significantly shallower retracement that fails to reach Target Zone 2. This would occur if the A-wave completes at a higher-than-expected Fibonacci level, such as the 38.2% or 50% retracement, or if the Wave 2 structure takes the form of a running correction or expanded flat, both of which can terminate well above the projected golden zone. This scenario does not invalidate the broader Wave 2 thesis but would require a structural recount of the internal subdivisions and a reassessment of the entry framework.
Scenario 3: Wave 4 Rather Than Wave 2 — Structural Recount Required
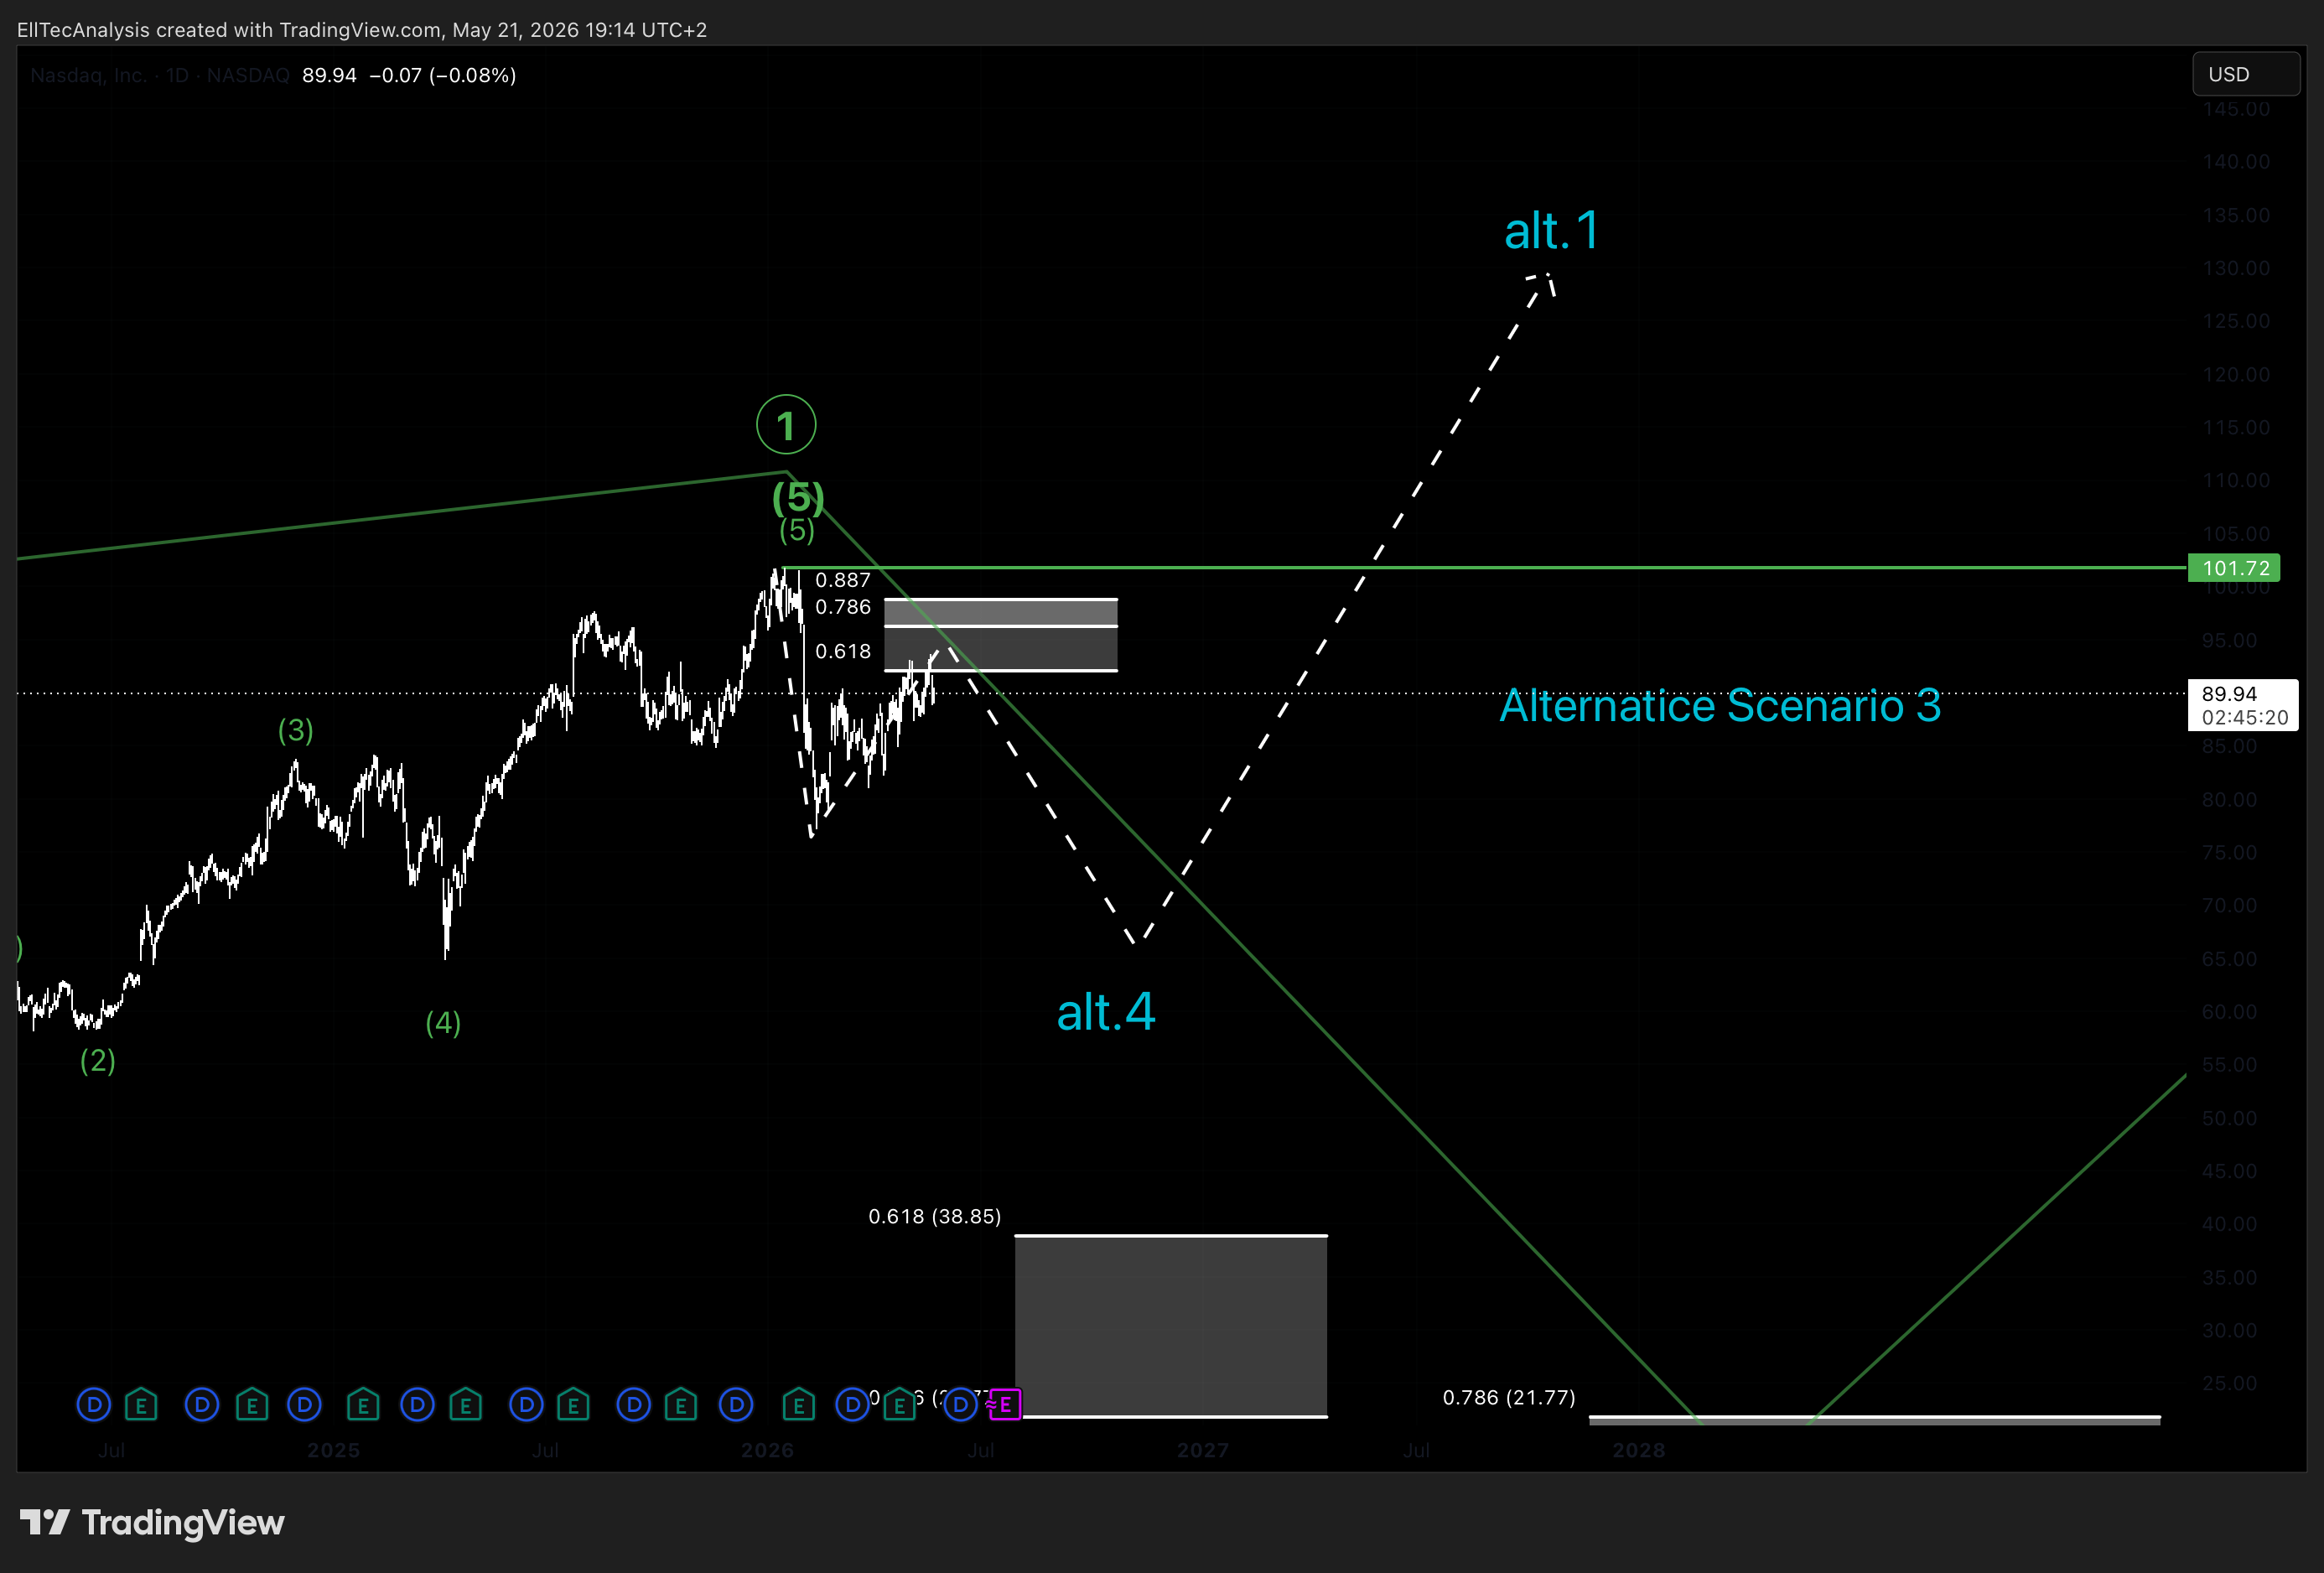
A third structural possibility is that the current corrective phase does not represent a higher-degree Wave 2 but rather a Wave 4 correction within a still-active higher-degree impulsive cycle. In this case, Target Zone 2 and Target Zone 3 would represent temporary support zones within a larger ongoing expansion, rather than deep structural reversal zones. This scenario would become more credible if the corrective structure displays overlapping wave internals consistent with a flat or triangle pattern, which are characteristic of Wave 4 formations. EllTec Analysis will continue to monitor the unfolding price structure and update the count as the data evolves. The targets as defined in this analysis remain valid in the interim framework.
5. Potential Trading Plan
A structured, staged entry approach is proposed across the three defined target zones, calibrated to accumulate exposure progressively as the corrective cycle deepens. This framework is designed to avoid early overcommitment while ensuring meaningful participation if the most favorable entry levels are reached.
Entry Framework:
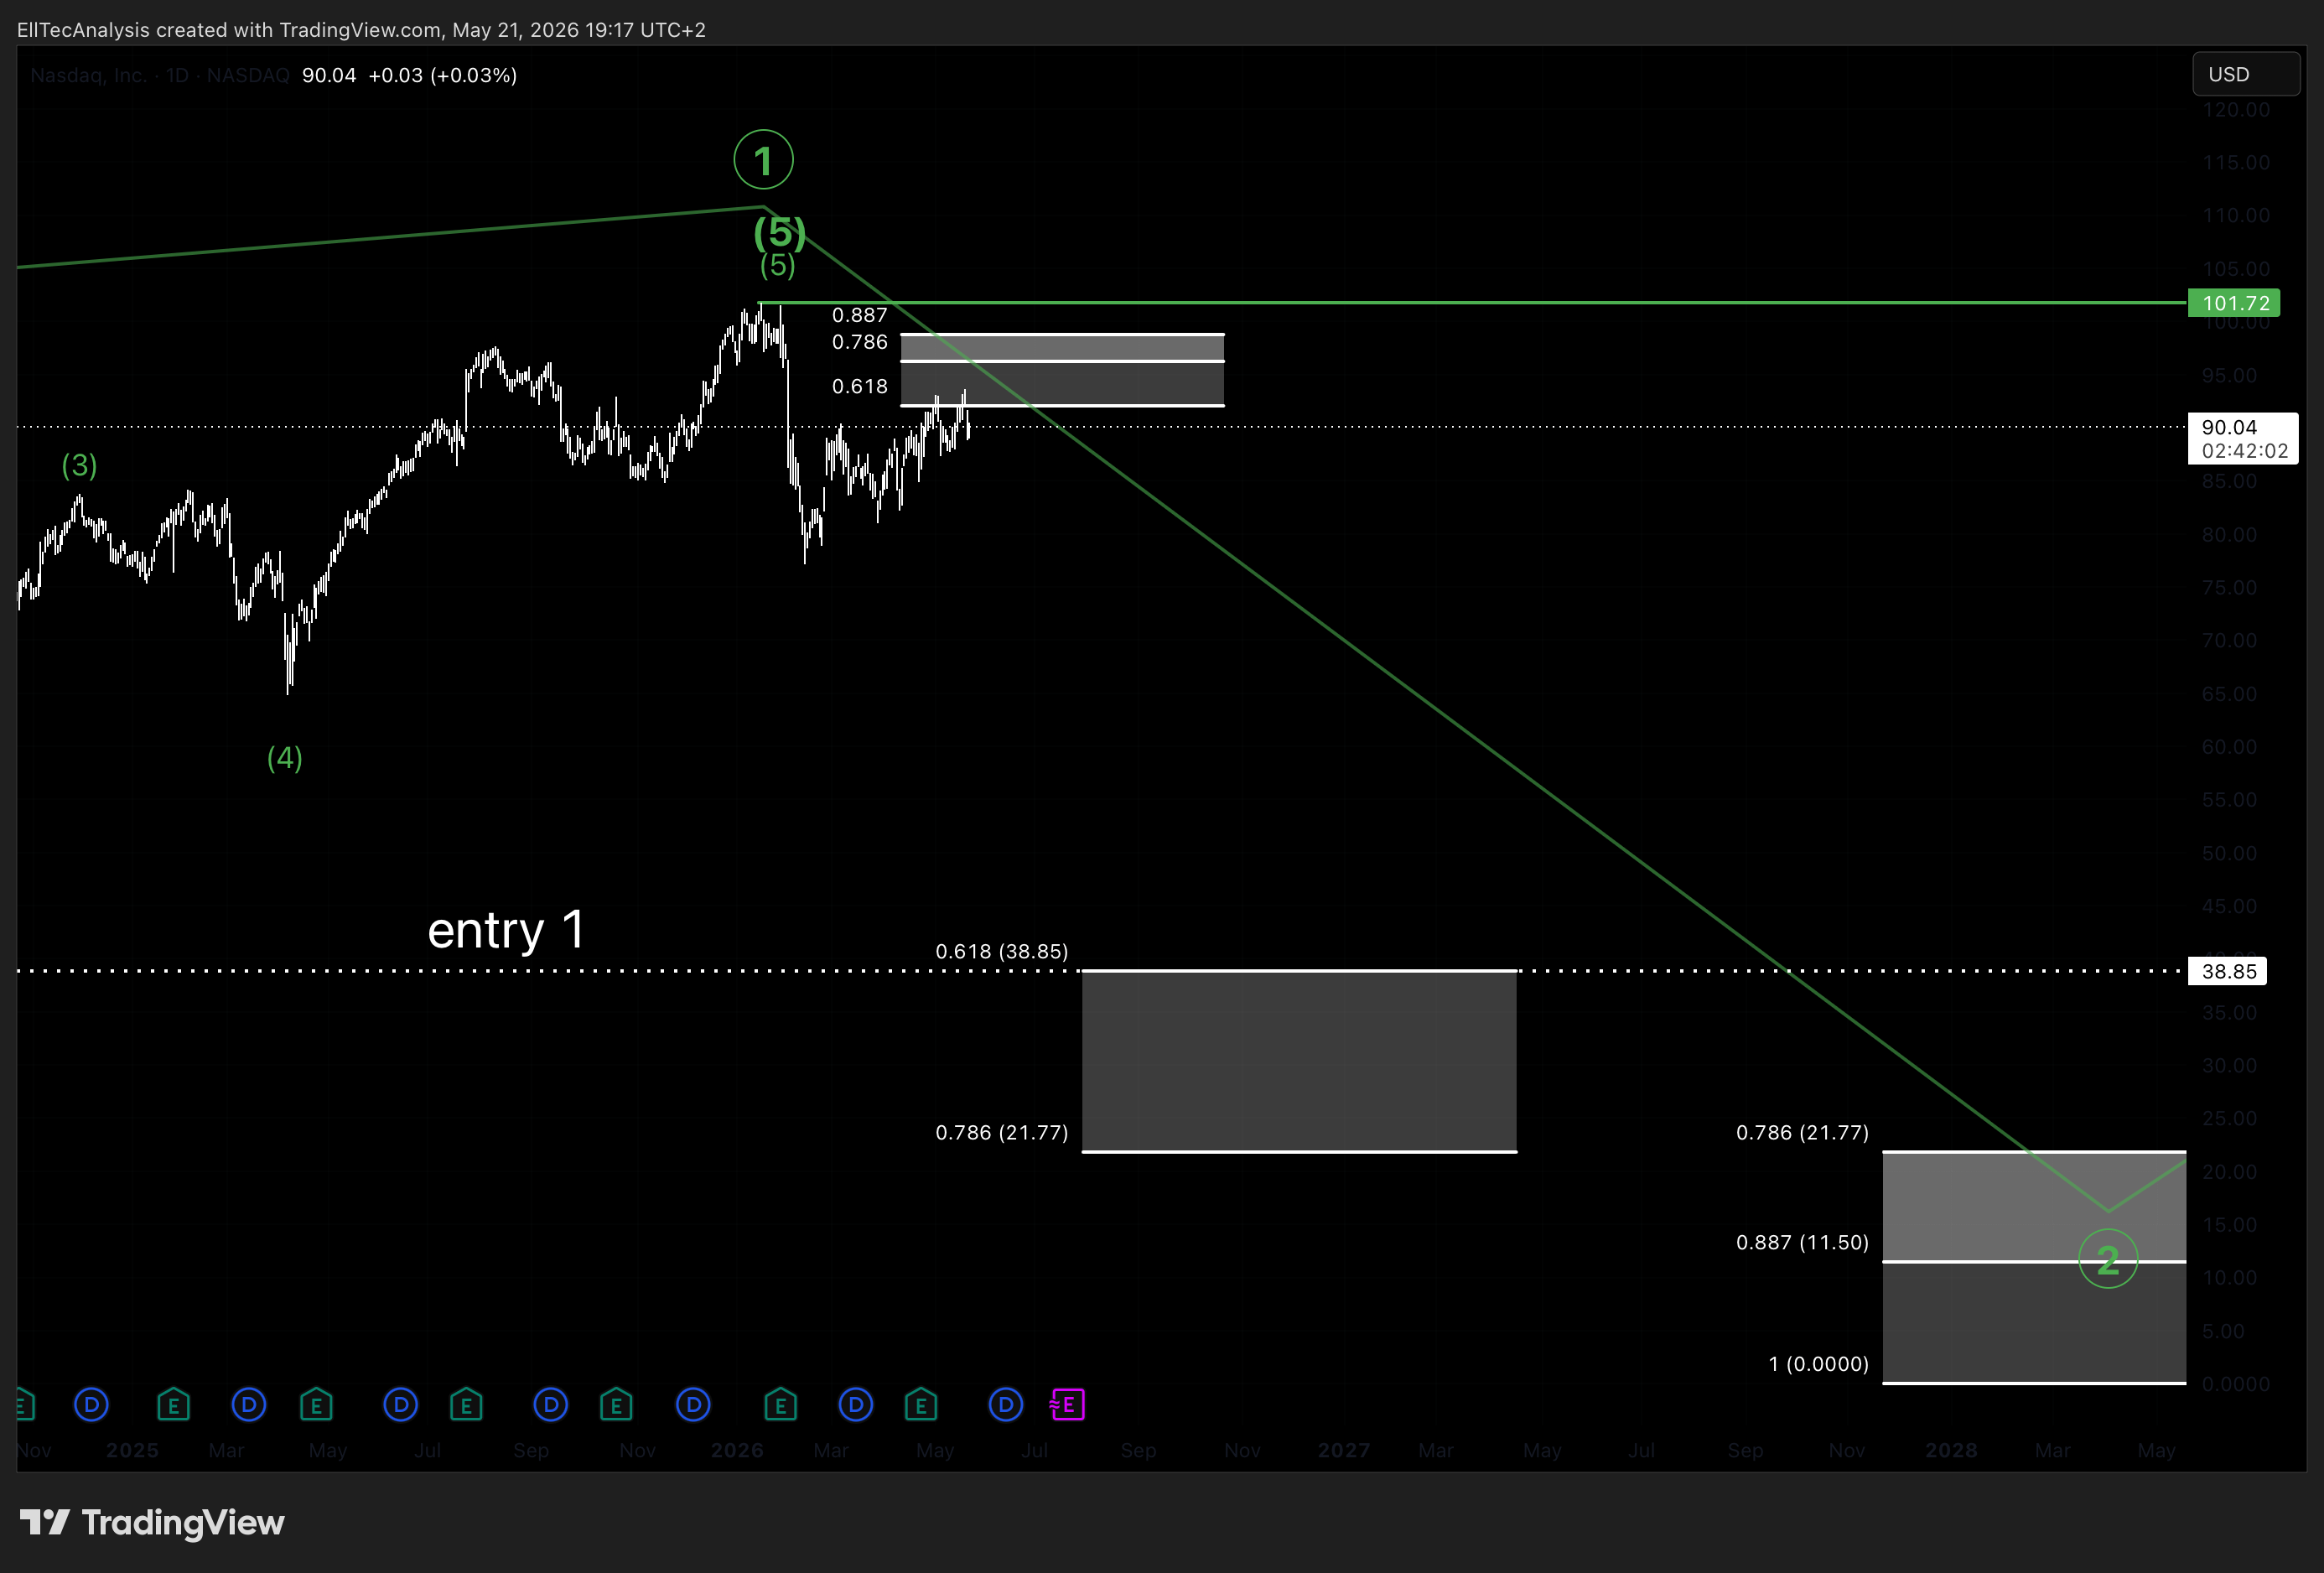
- 30% allocation at the upper boundary of Target Zone 2 — 38.85 USD (61.8% Fibonacci retracement)
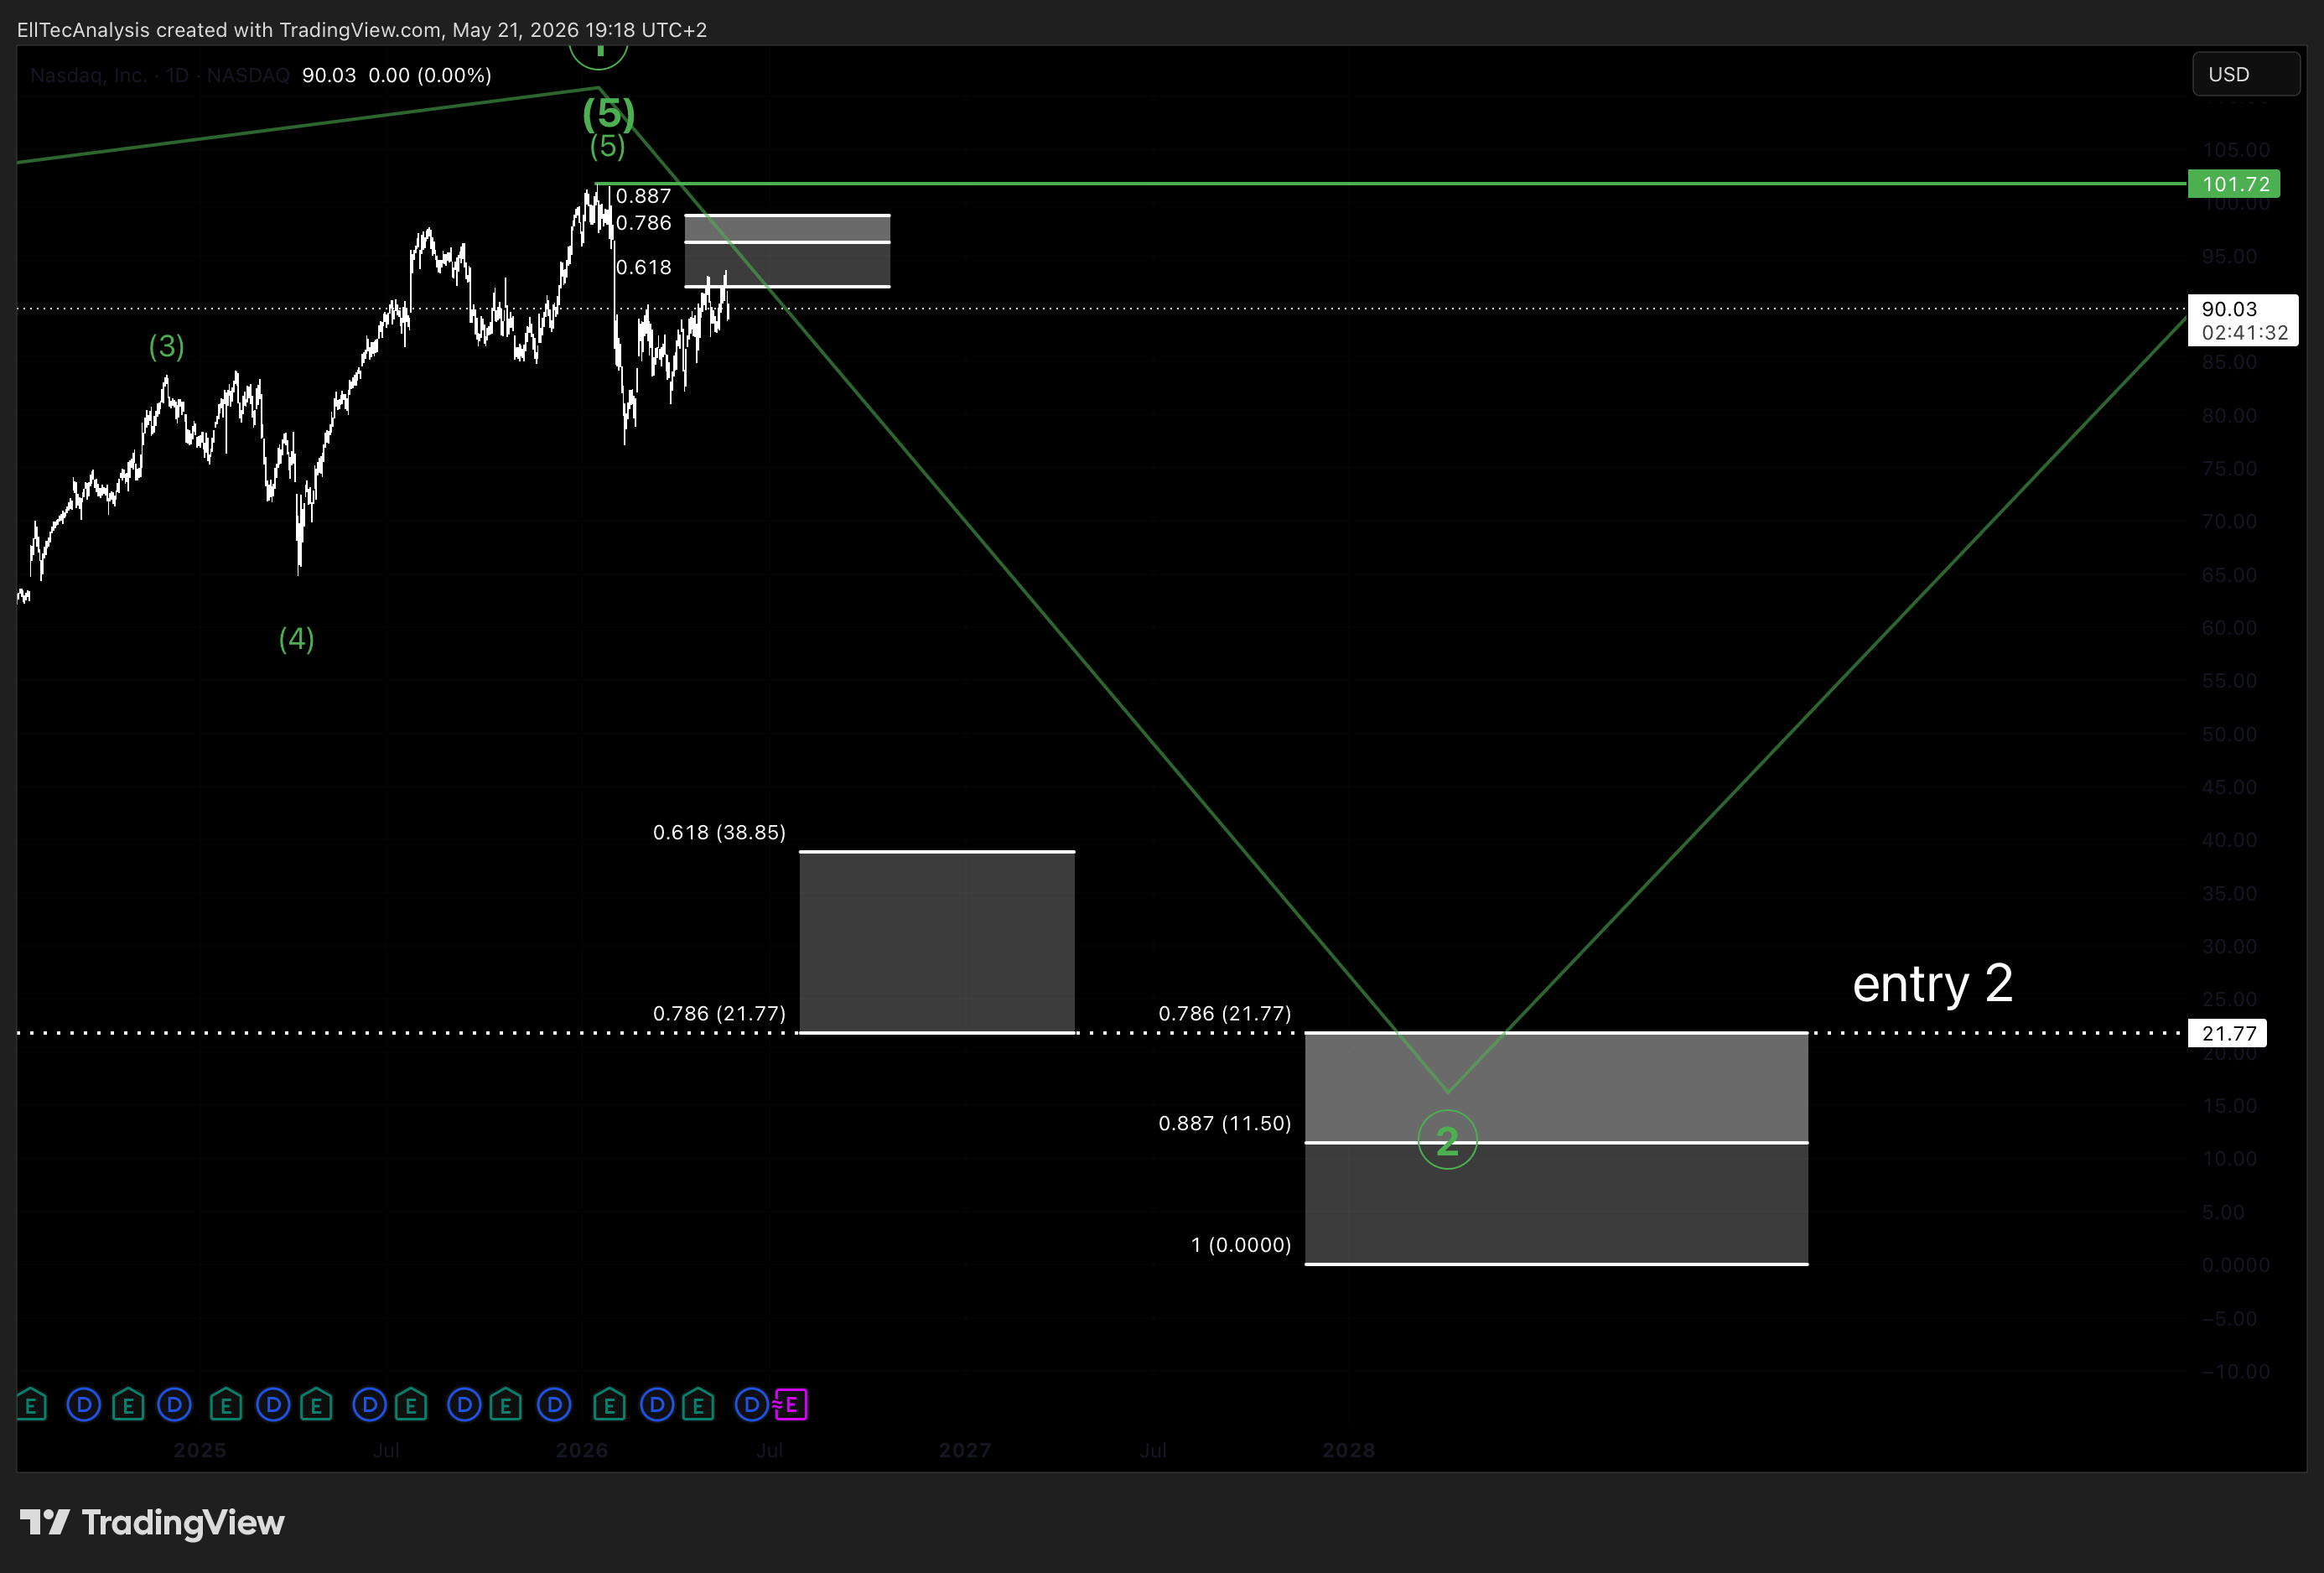
- 60% allocation at the upper boundary of Target Zone 3 — 21.77 USD (78.6% Fibonacci retracement)
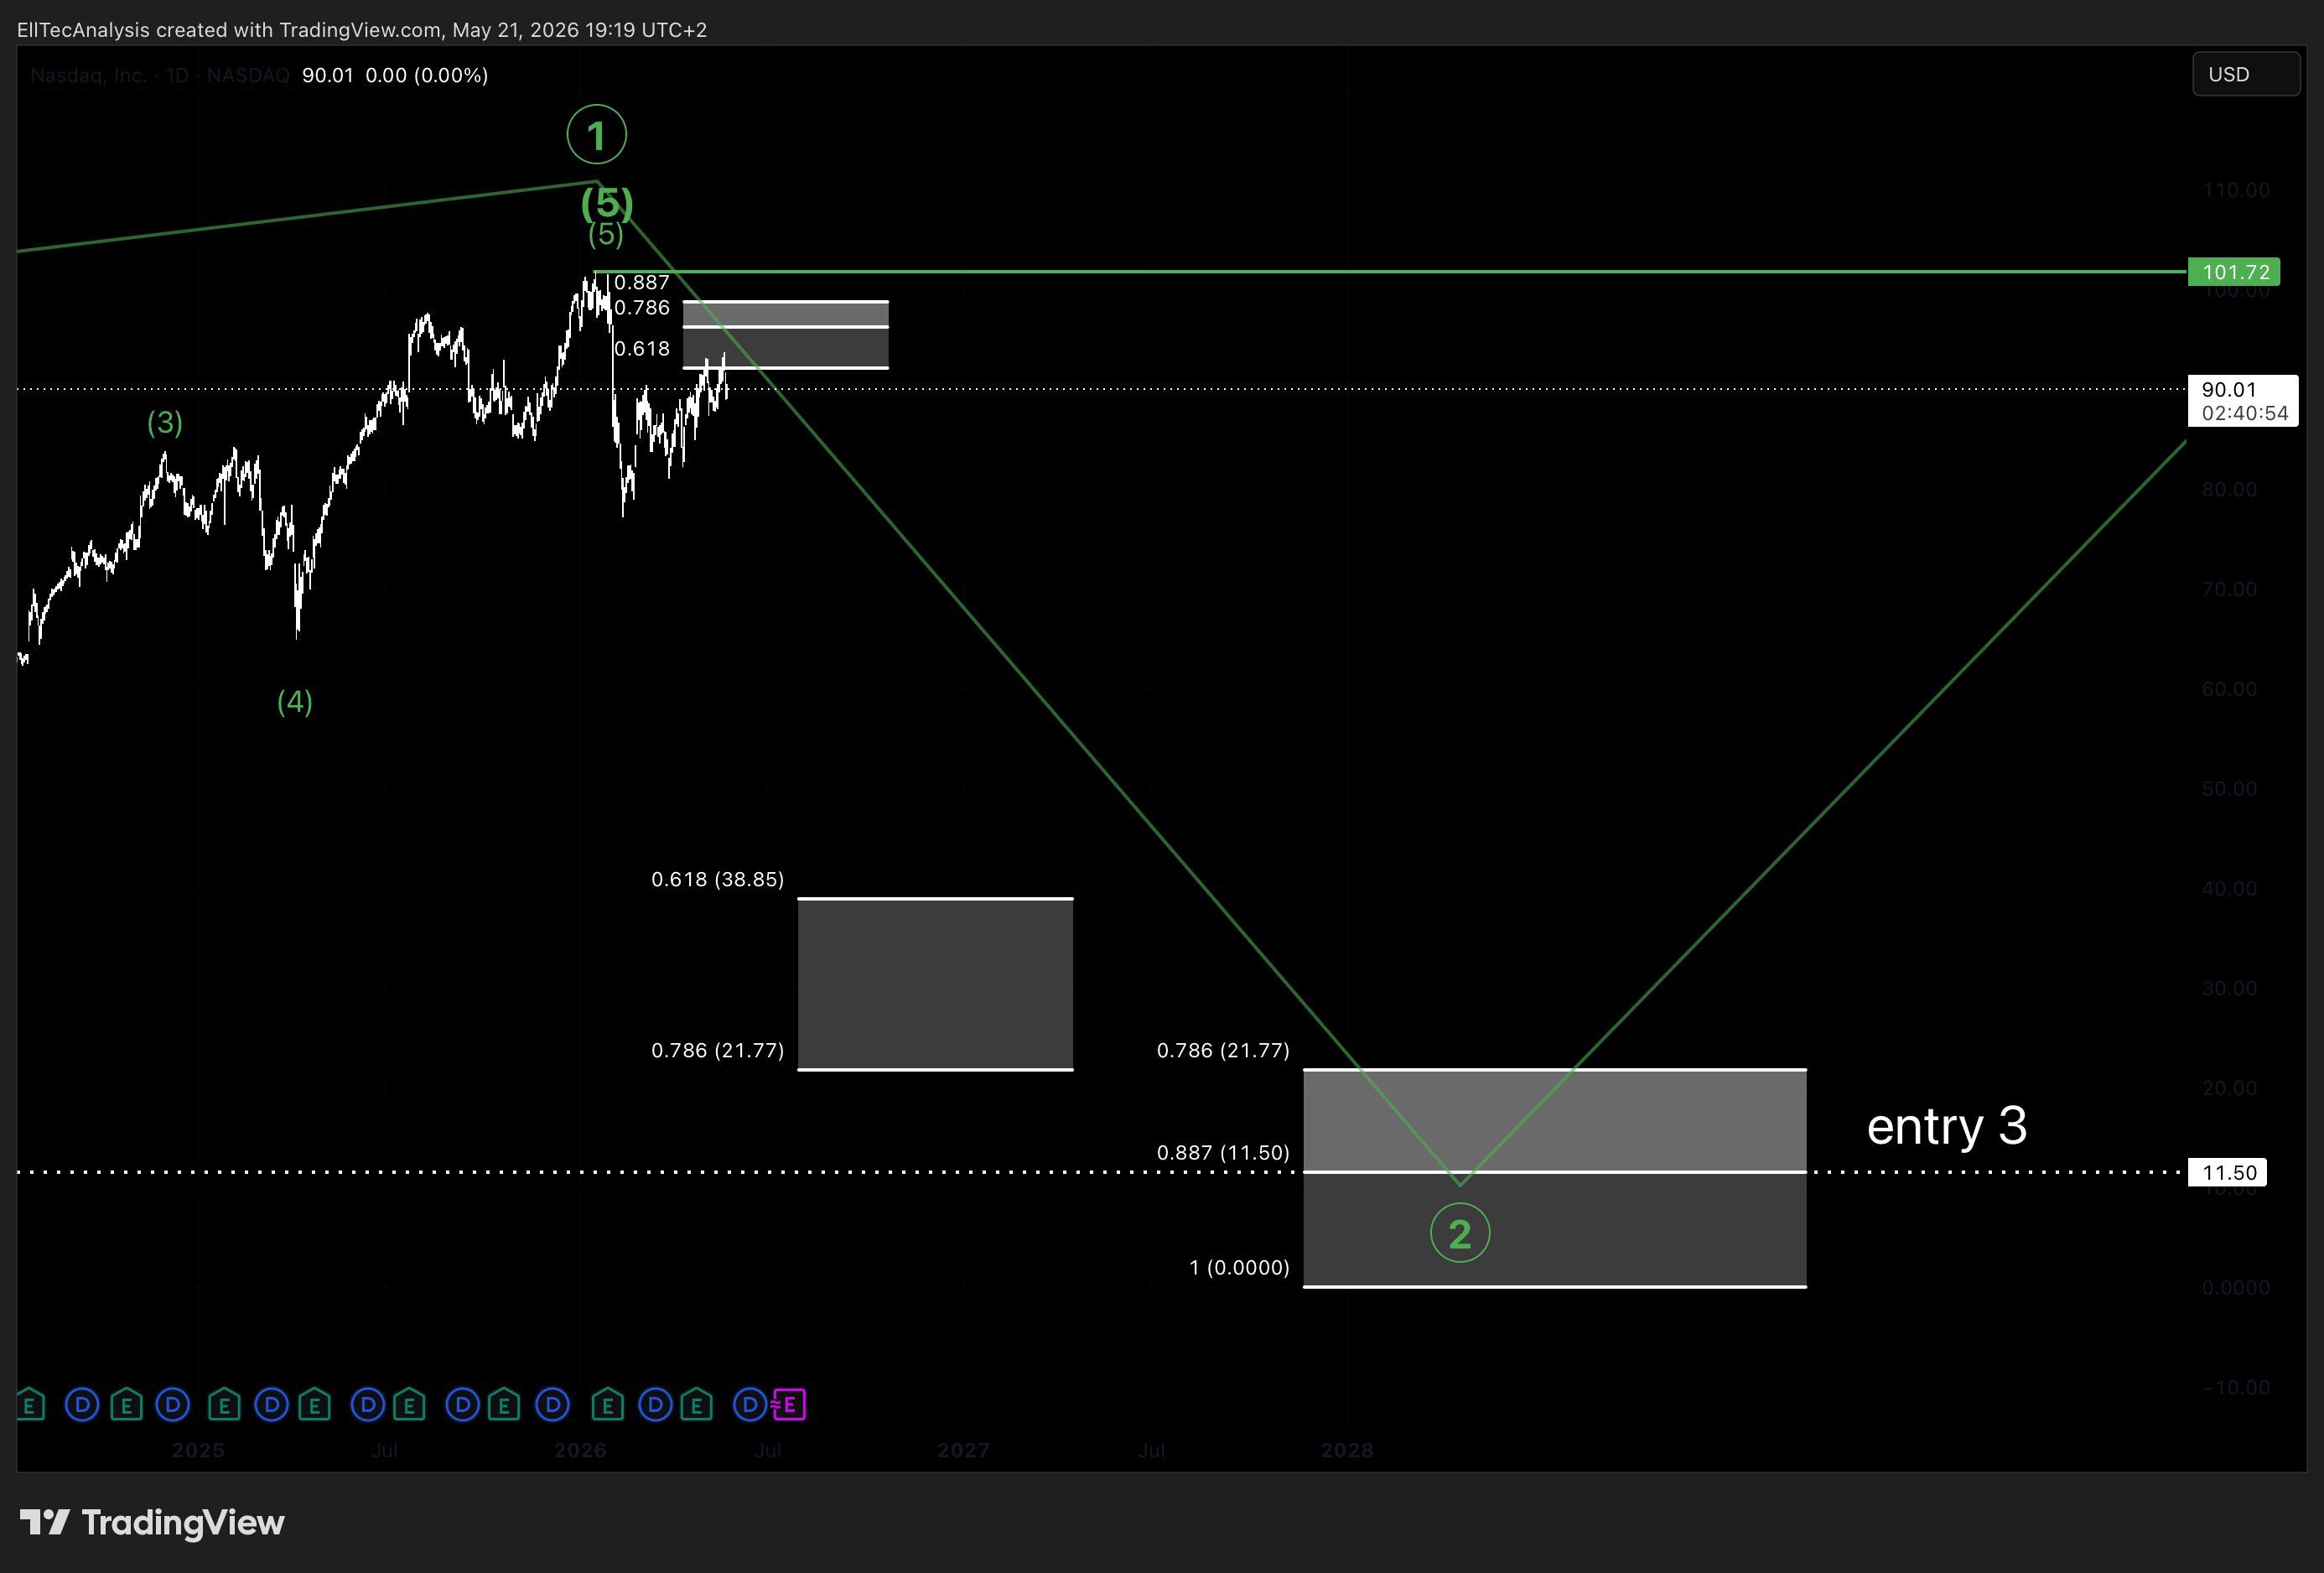
- 10% allocation at the mid-zone of Target Zone 3 — 11.50 USD (88.7% Fibonacci retracement)
This allocation structure is intentionally weighted toward the lower entry levels, reflecting the higher structural conviction at deeper retracement zones. The initial 30% tranche at Target Zone 2 establishes a position early in the potential reversal zone, while the dominant 60% allocation at Target Zone 3 represents the highest-confidence entry level — a zone of extreme historical significance within the wave structure. The final 10% tranche at 11.50 USD serves as a last-resort averaging layer should the correction extend into the deepest possible projection.
Profit Target Framework:
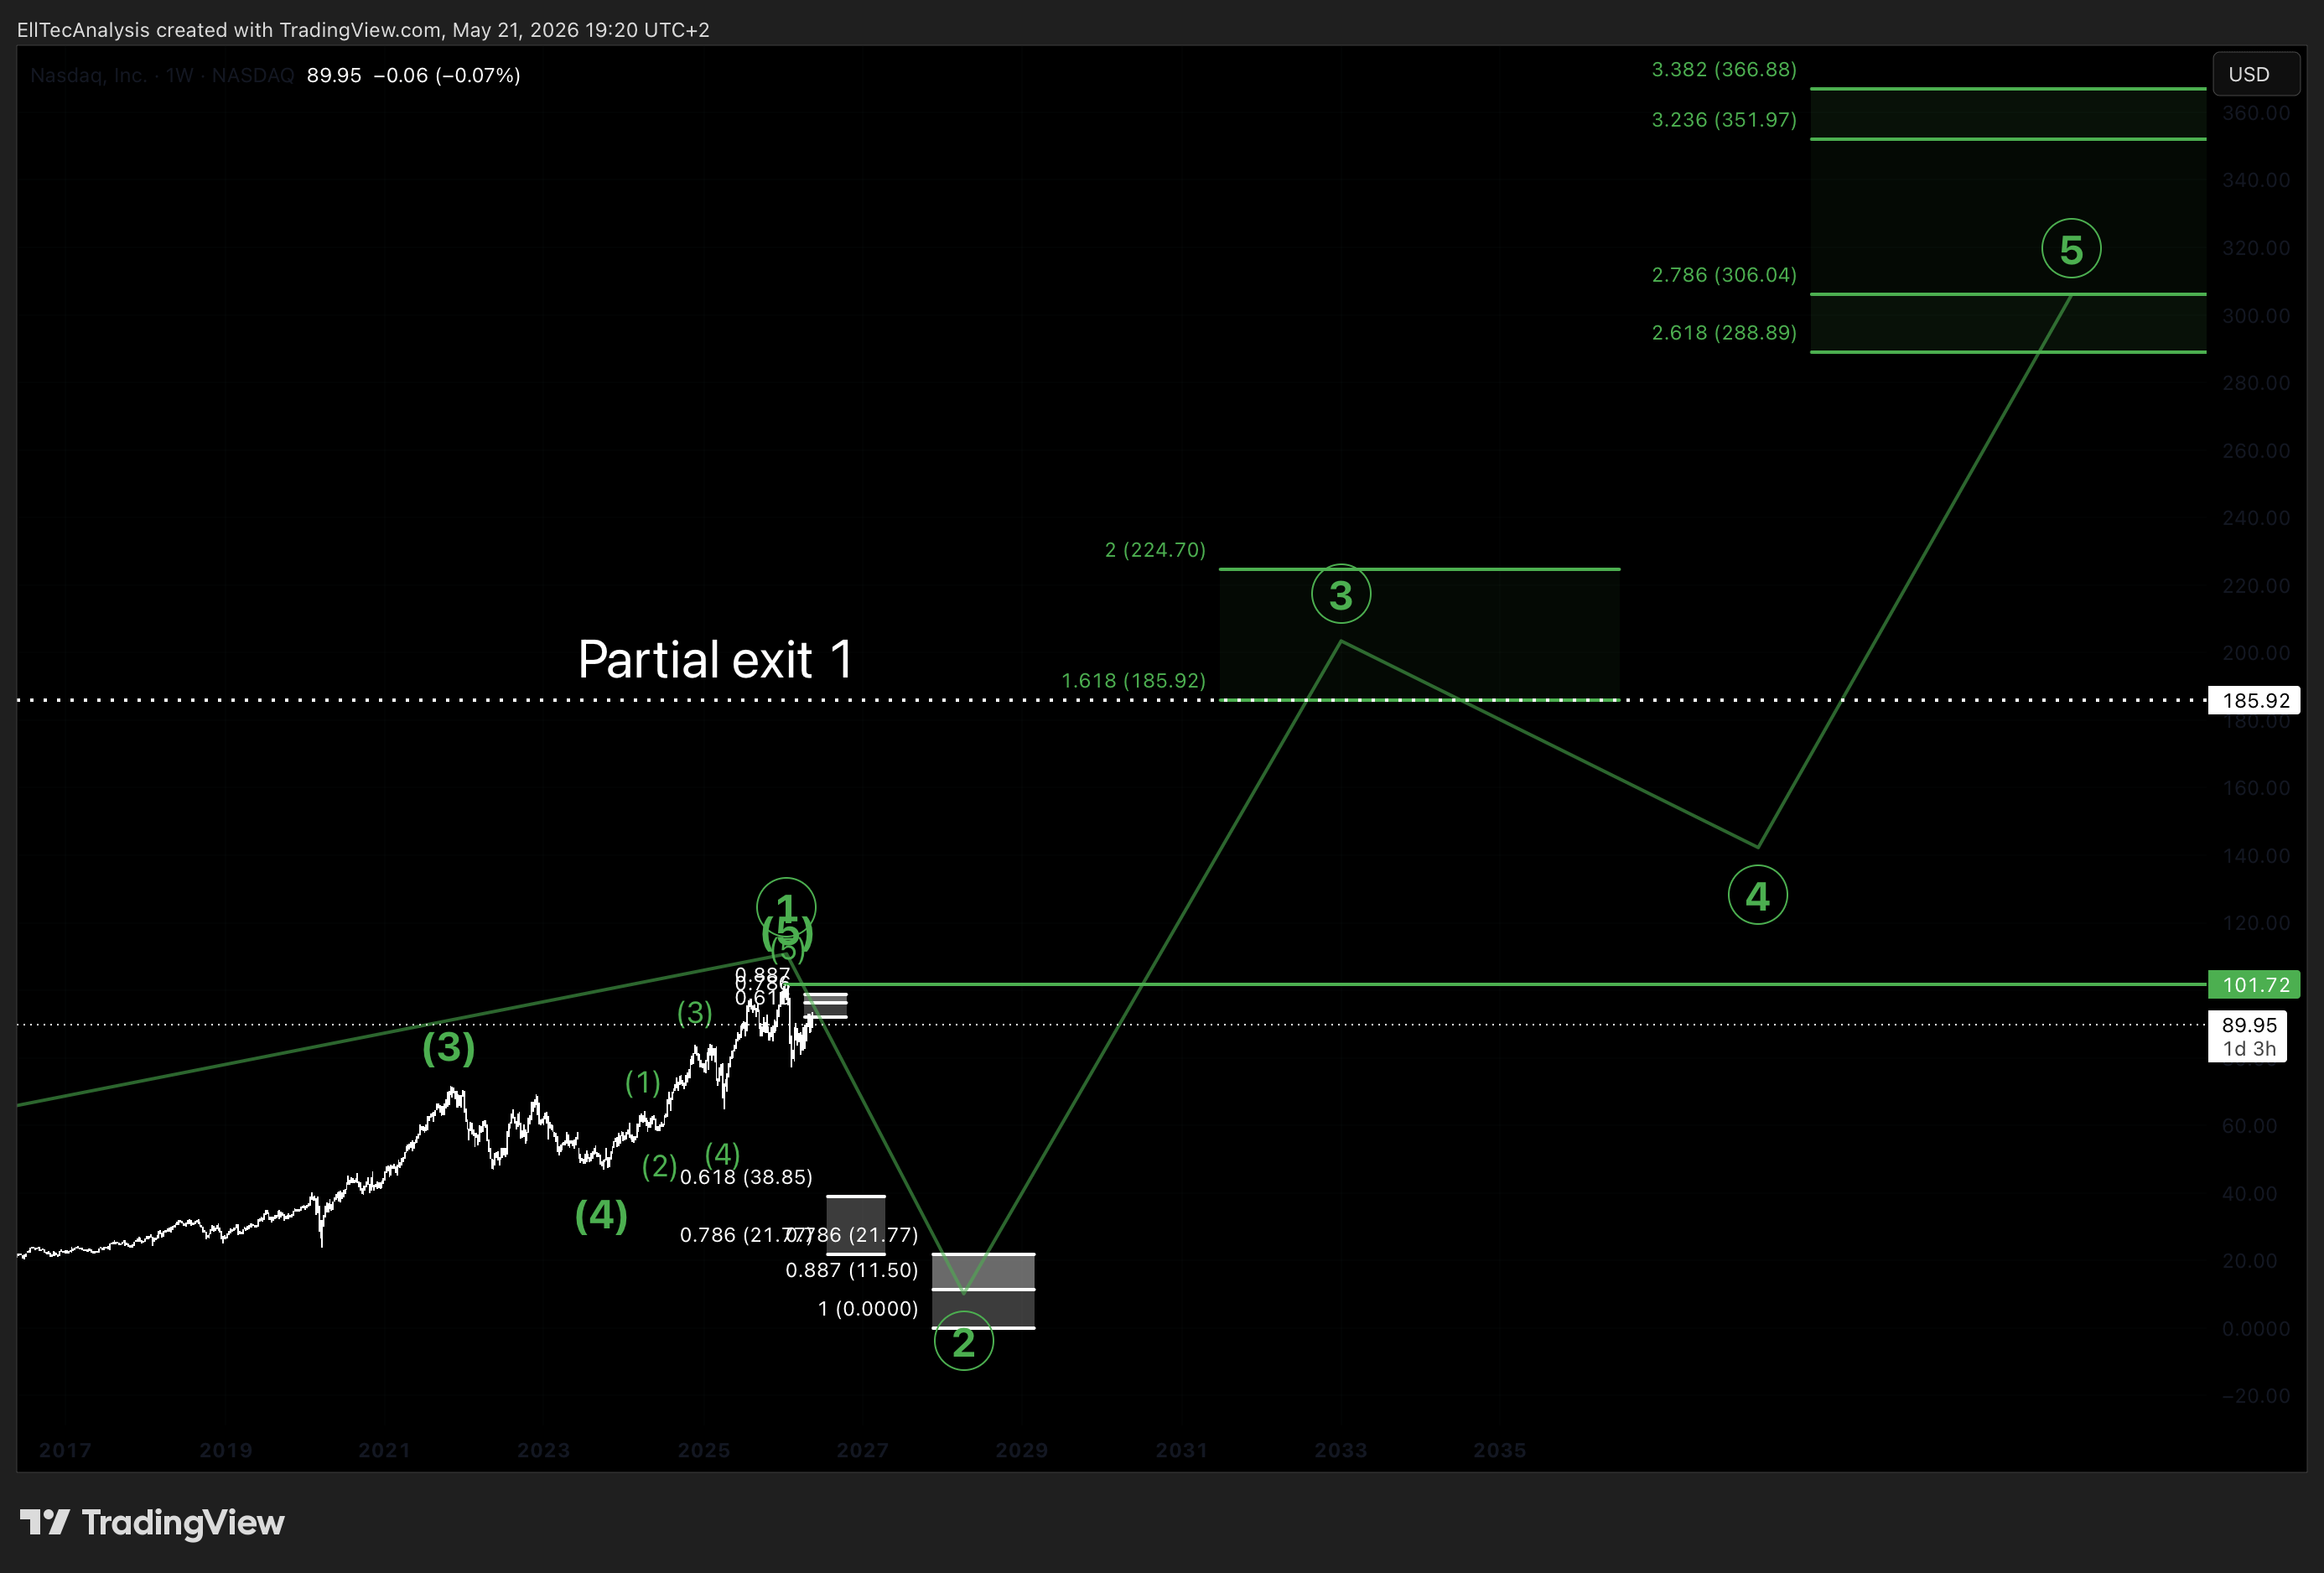
- 50% partial exit at the lower boundary of Target Zone 4 — 185.92 USD (1.618 Fibonacci extension), where the higher-degree Wave 3 expansion may mature
- Following the Wave 4 corrective pullback, a potential re-entry or position top-up may be evaluated to restore full exposure into the final Wave 5 phase
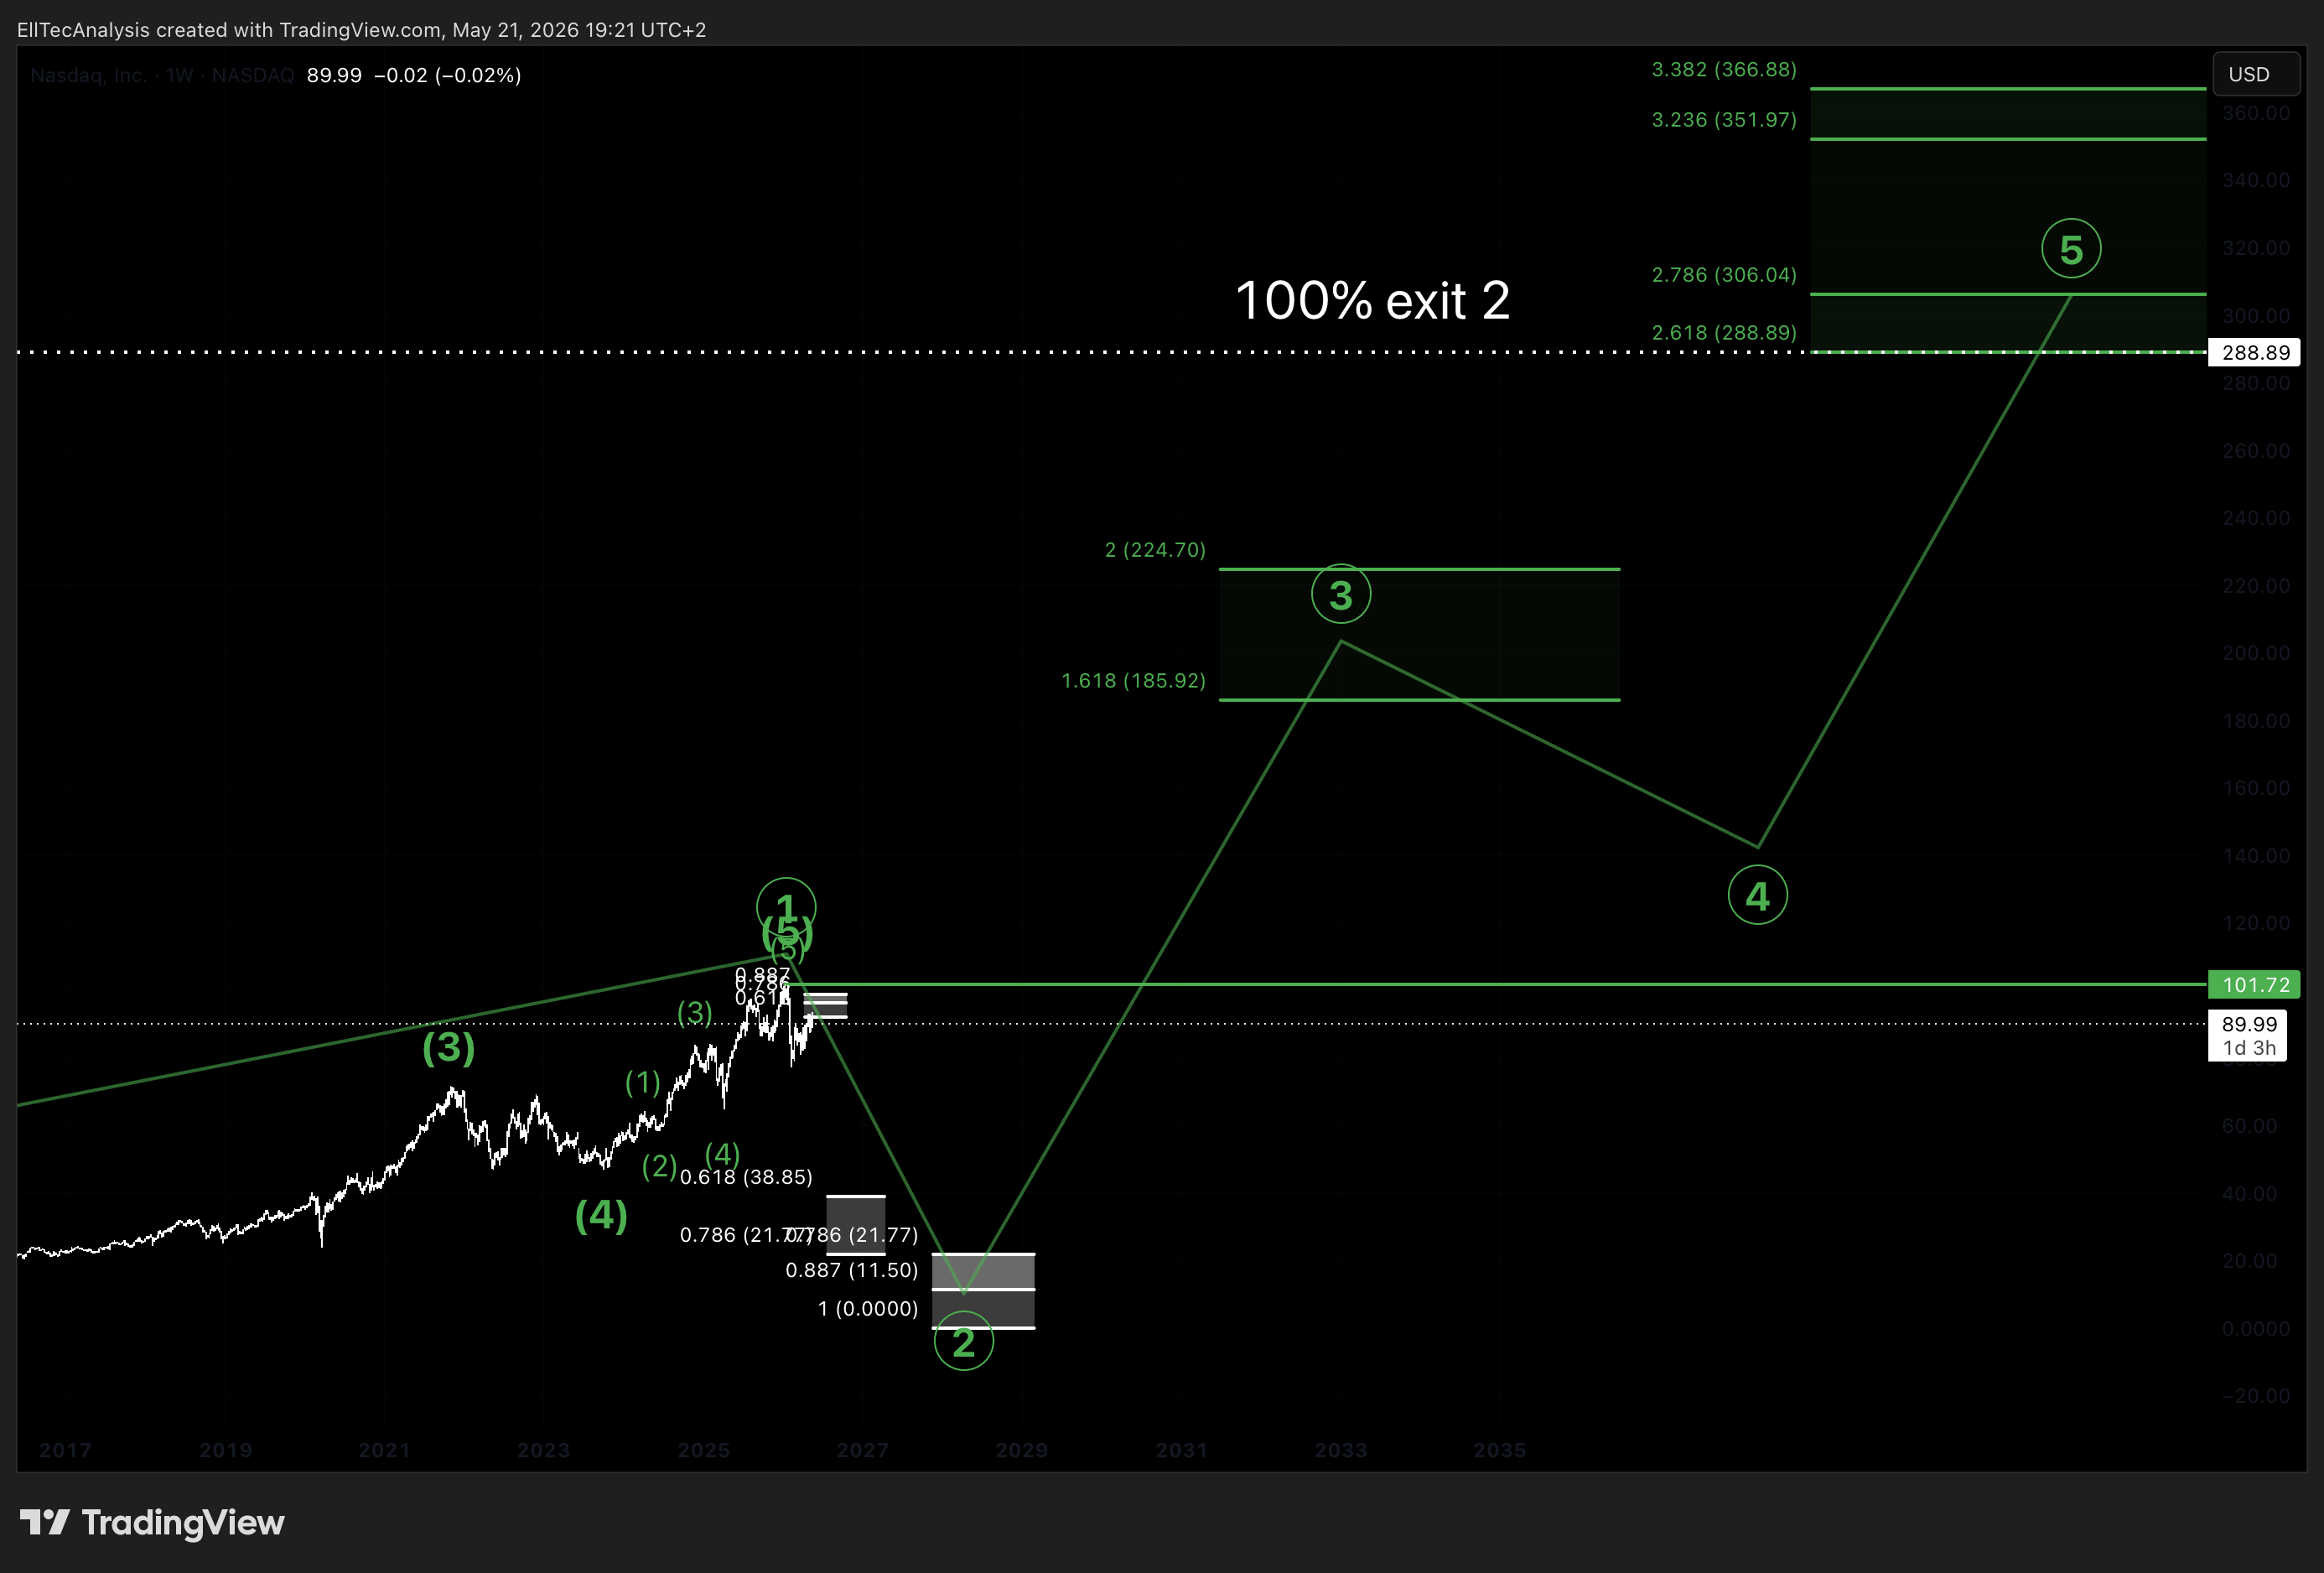
- Full position exit (100%) at the lower boundary of Target Zone 5 — 288.89 USD (2.618 Fibonacci extension), where the terminal higher-degree Wave 5 is expected to complete and the risk-reward profile no longer justifies continued exposure
How a potential trade would look like with an entry average at the top boundry of Target Zone 3:
6. Risk Assessment
Risk Score: 2–3
Nasdaq Inc. represents a relatively low-risk profile within the universe of single-stock opportunities at these structural levels, for several interconnected reasons. The company operates in a highly regulated and structurally resilient industry with deep institutional moats. Its diversified revenue base — spanning exchange operations, financial technology, and data services — reduces single-business-line vulnerability. The long-term chart history of the stock is exceptionally clean from a technical analysis perspective, producing well-defined Elliott Wave structures with historically reliable Fibonacci interaction zones.
The primary risk elevation relative to an index or ETF exposure stems from the single-stock nature of the investment. Idiosyncratic risks — including management execution on the Adenza integration, debt refinancing dynamics, regulatory intervention in exchange markets, or unexpected competitive disruption in the financial technology space — are real and cannot be diversified away within a single-position framework. These factors push the score above 2 toward the 3 range.
However, if the corrective cycle does materialize into Target Zone 2 and Target Zone 3, the historical value proposition at those price levels would be exceptional by virtually any valuation framework. Buying a structurally dominant financial infrastructure company at 78.6% or deeper retracement levels from a multi-year high represents the type of generational entry point that defines long-term wealth creation — provided the company’s fundamental integrity is preserved, which EllTec Analysis currently assesses as high probability.
Disclaimer
This analysis is for informational purposes only and does not constitute financial advice. All information is provided without guarantee. Markets involve risks, and past performance is not indicative of future results. Please do your own research or consult a licensed advisor. EllTec Analysis assumes no liability for decisions based on this content.