

Charter Communications
BROADBAND AT THE BOTTOM The largest connectivity consolidation in American history is forming while the stock trades near decade-lows. Structure and timing are aligning.

NASDAQ: CHTR

01
Fundamentals
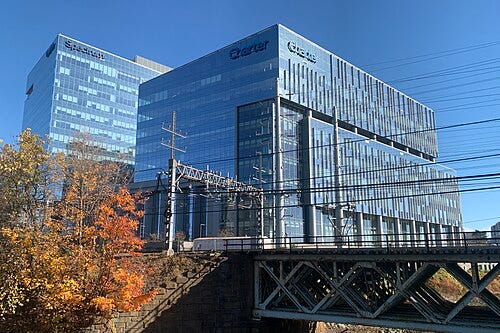
Charter Communications, Inc. (NASDAQ: CHTR) is the second-largest cable and broadband operator in the United States, delivering internet, television, mobile, and voice services under its Spectrum brand to more than 58 million homes and businesses across 41 states. Founded in 1993 and headquartered in Stamford, Connecticut, the company has evolved from a regional cable operator into one of the defining infrastructure plays of the American digital economy. Its network spans a hybrid fiber-coaxial architecture now in active transition toward DOCSIS 4.0 multi-gigabit capability, a generational upgrade that underpins the company’s long-term competitive positioning against fiber overbuilders and fixed-wireless challengers alike.
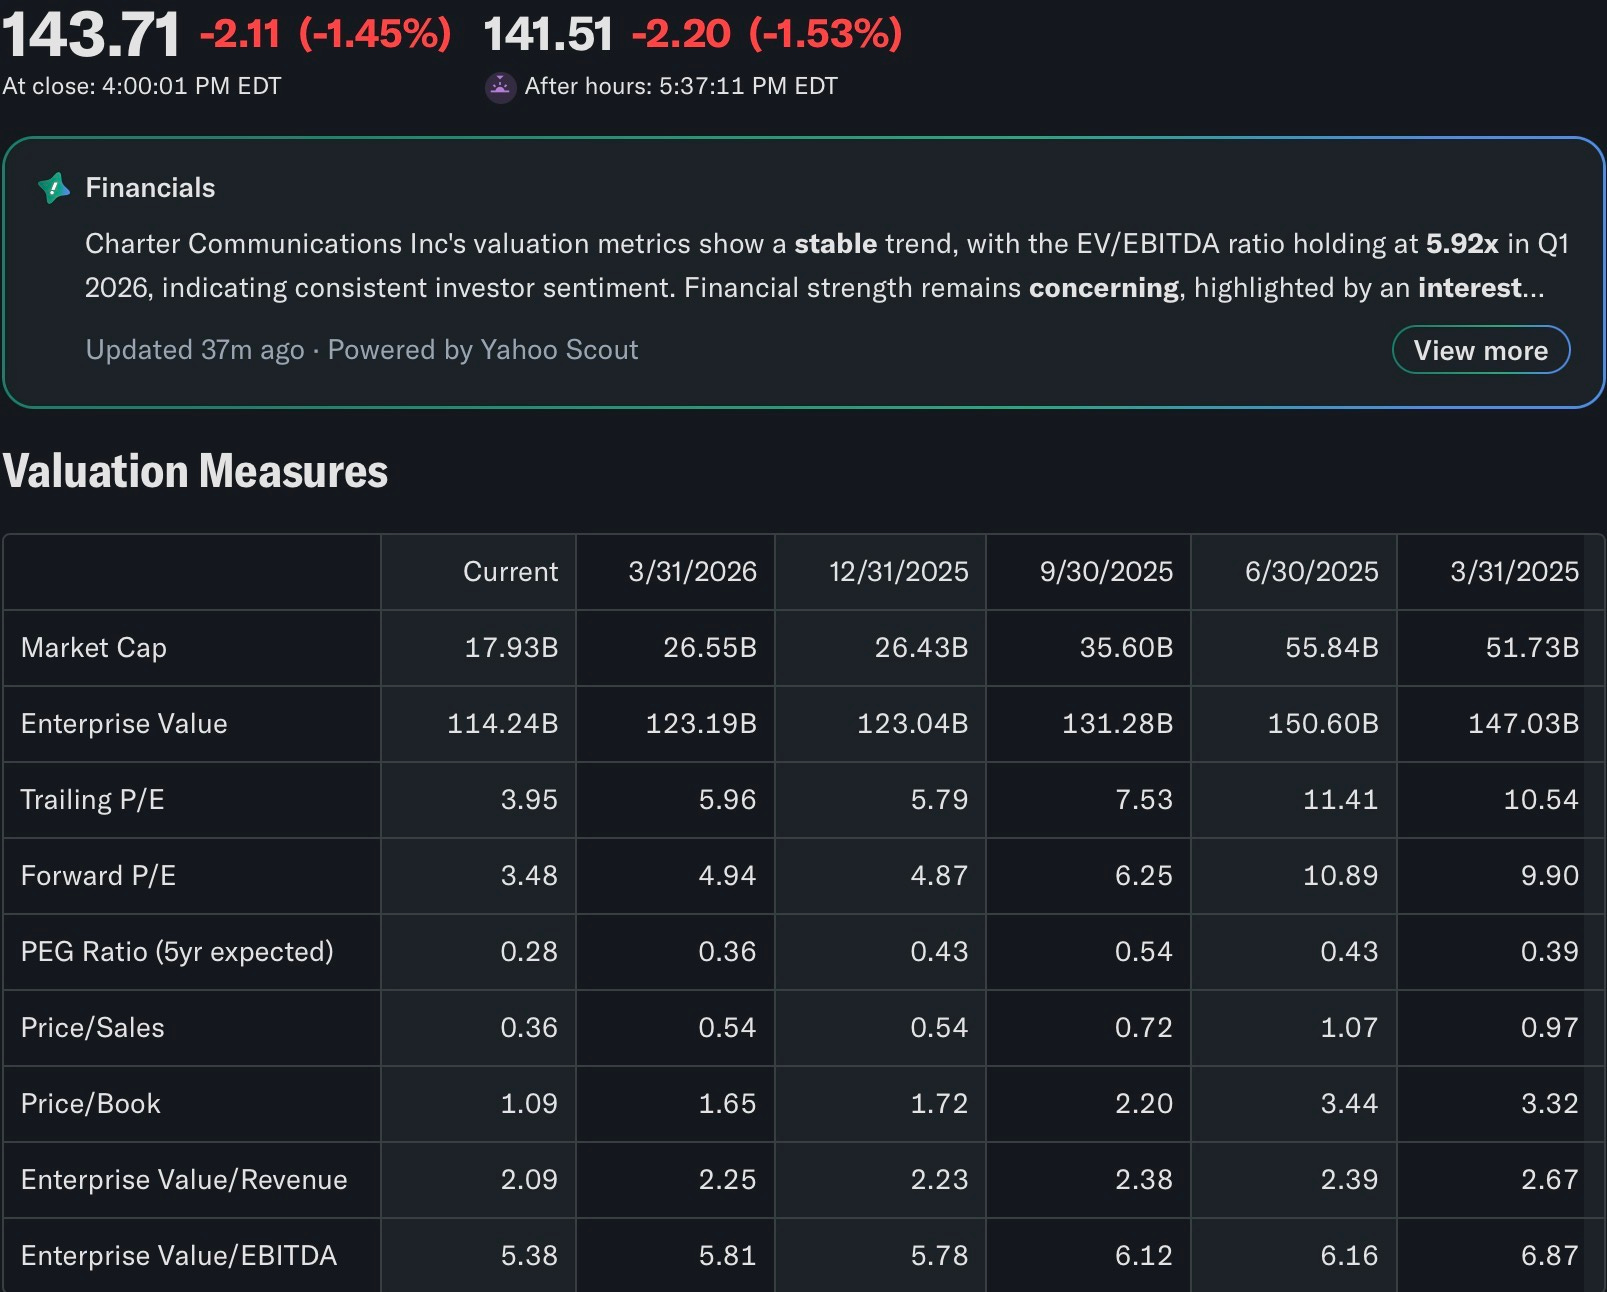
The business generates revenue predominantly from recurring monthly subscription fees, which lends it a high degree of cash flow visibility even in cyclically challenging environments. As of the trailing twelve months through year-end 2025, Charter recorded revenues of approximately $54.8 billion, with an operating margin running above 22%, comfortably ahead of its five-year historical average. Adjusted EBITDA has remained resilient, and free cash flow reached $1.6 billion in the first quarter of 2025 alone, representing a roughly $1.2 billion improvement versus the prior-year period driven by declining capital expenditure intensity, EBITDA growth, and lower cash interest costs. The company carries a net debt to EBITDA ratio of approximately 4.4 times, which defines both its primary financial risk and, in the current context, its primary financial lever: as leverage normalizes toward the management target of 3.5 to 4.0 times, the equity re-rating potential is material.
The macro backdrop for Charter is defined by two structural forces pulling in opposite directions. On the demand side, broadband consumption continues to grow at a pace that rewards scale network operators with deep physical infrastructure. Spectrum Mobile, Charter’s wireless product built on a mobile virtual network operator arrangement and increasingly a CBRS-augmented owned layer, is expanding at an exceptional rate: mobile service revenue surged 33.5% year-over-year in the first quarter of 2025, making wireless the fastest-growing line in the company’s revenue stack. On the competitive side, fixed-wireless access from 5G providers and the gradual expansion of fiber overbuilders have introduced genuine pressure on the residential broadband subscriber base, pushing churn higher and constraining pricing power in certain markets. The end of the Affordable Connectivity Program in 2024 further accelerated customer losses in price-sensitive segments, a headwind that is now largely embedded in the base.
The transformative strategic event is the dual consolidation program Charter is executing simultaneously. First, the acquisition of Liberty Broadband, approved by shareholders in February 2025 and expected to close by June 2027, simplifies the ownership structure and is expected to be modestly accretive to per-share metrics through the consolidation of equity holdings previously held at the holding company level. Second, and more consequential in operational terms, is the $34.5 billion acquisition of Cox Communications, announced in May 2025 and approved by the FCC in February 2026. This transaction creates the largest residential broadband and mobile operator in the United States, combining Charter’s 32-plus million subscribers with Cox’s approximately six million households across key Sun Belt markets including Las Vegas, Phoenix, and greater Atlanta. Management has guided to $500 million in annualized cost synergies within three years of close, and the merged entity will retain the Cox corporate name while marketing under the Spectrum consumer brand. For investors assessing CHTR today, the equation is not simply about a legacy cable operator defending its turf: it is about whether the combined platform’s free cash flow trajectory justifies what is, at current prices, a valuation not seen since 2018.
02
Correlations
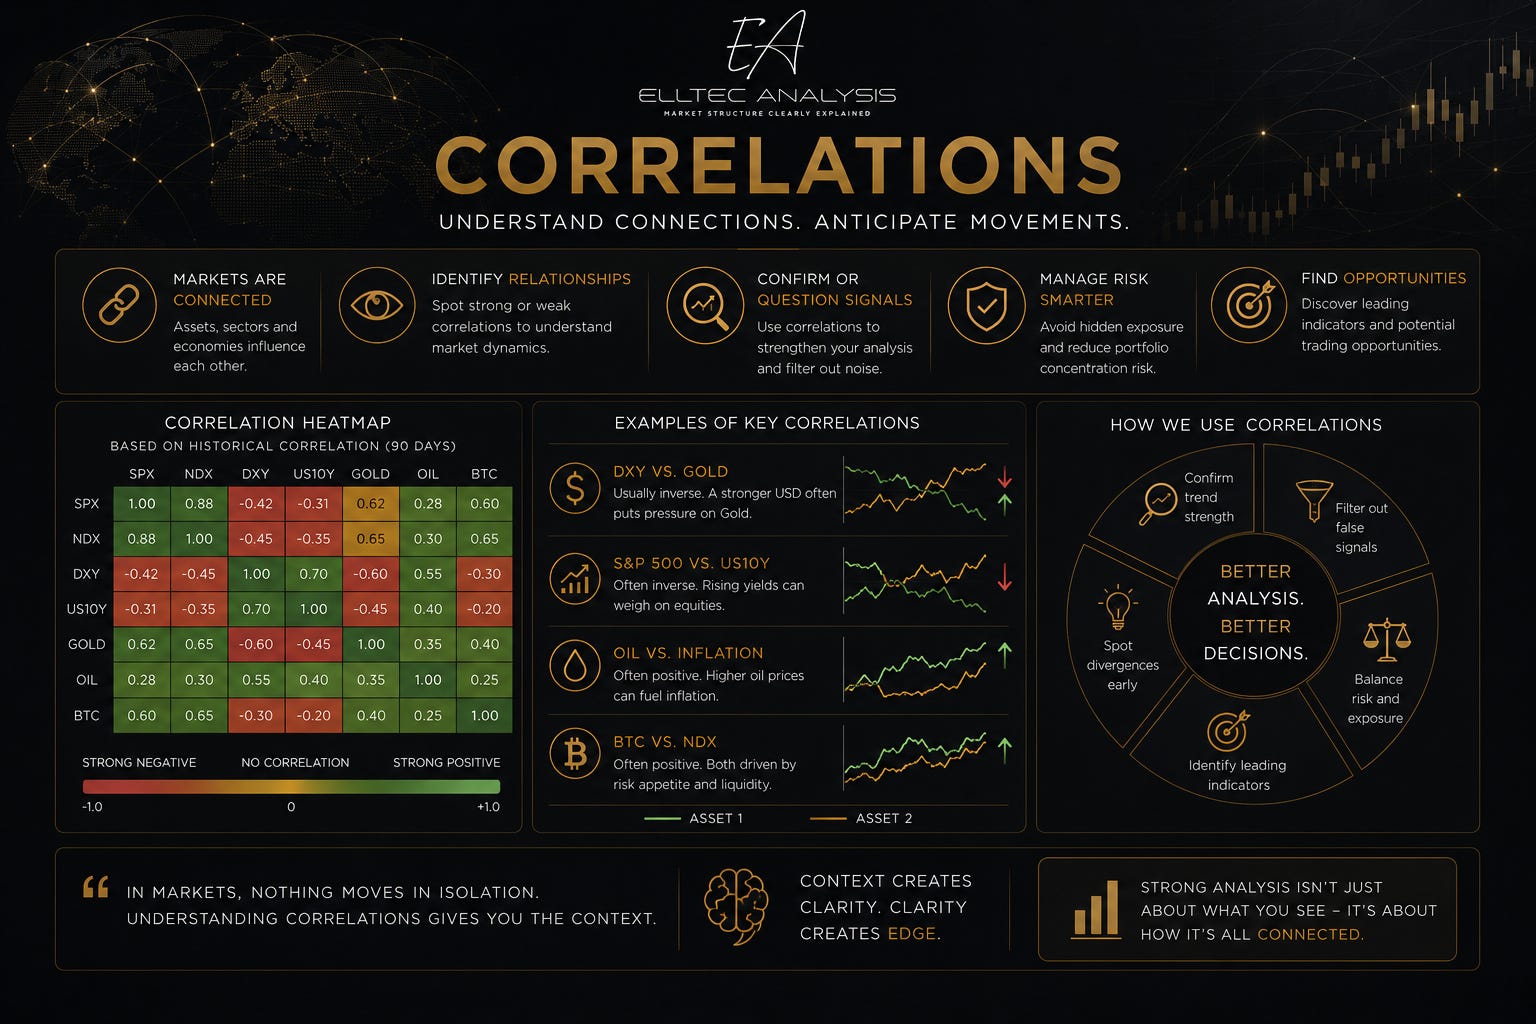
The correlation structure of Charter Communications is layered across macro regimes, sector rotations, and credit conditions, each of which transmits into the equity through a distinct mechanism.
CORRELATION 01
US Broadband and Telecom Sector (XLC / IYZ)
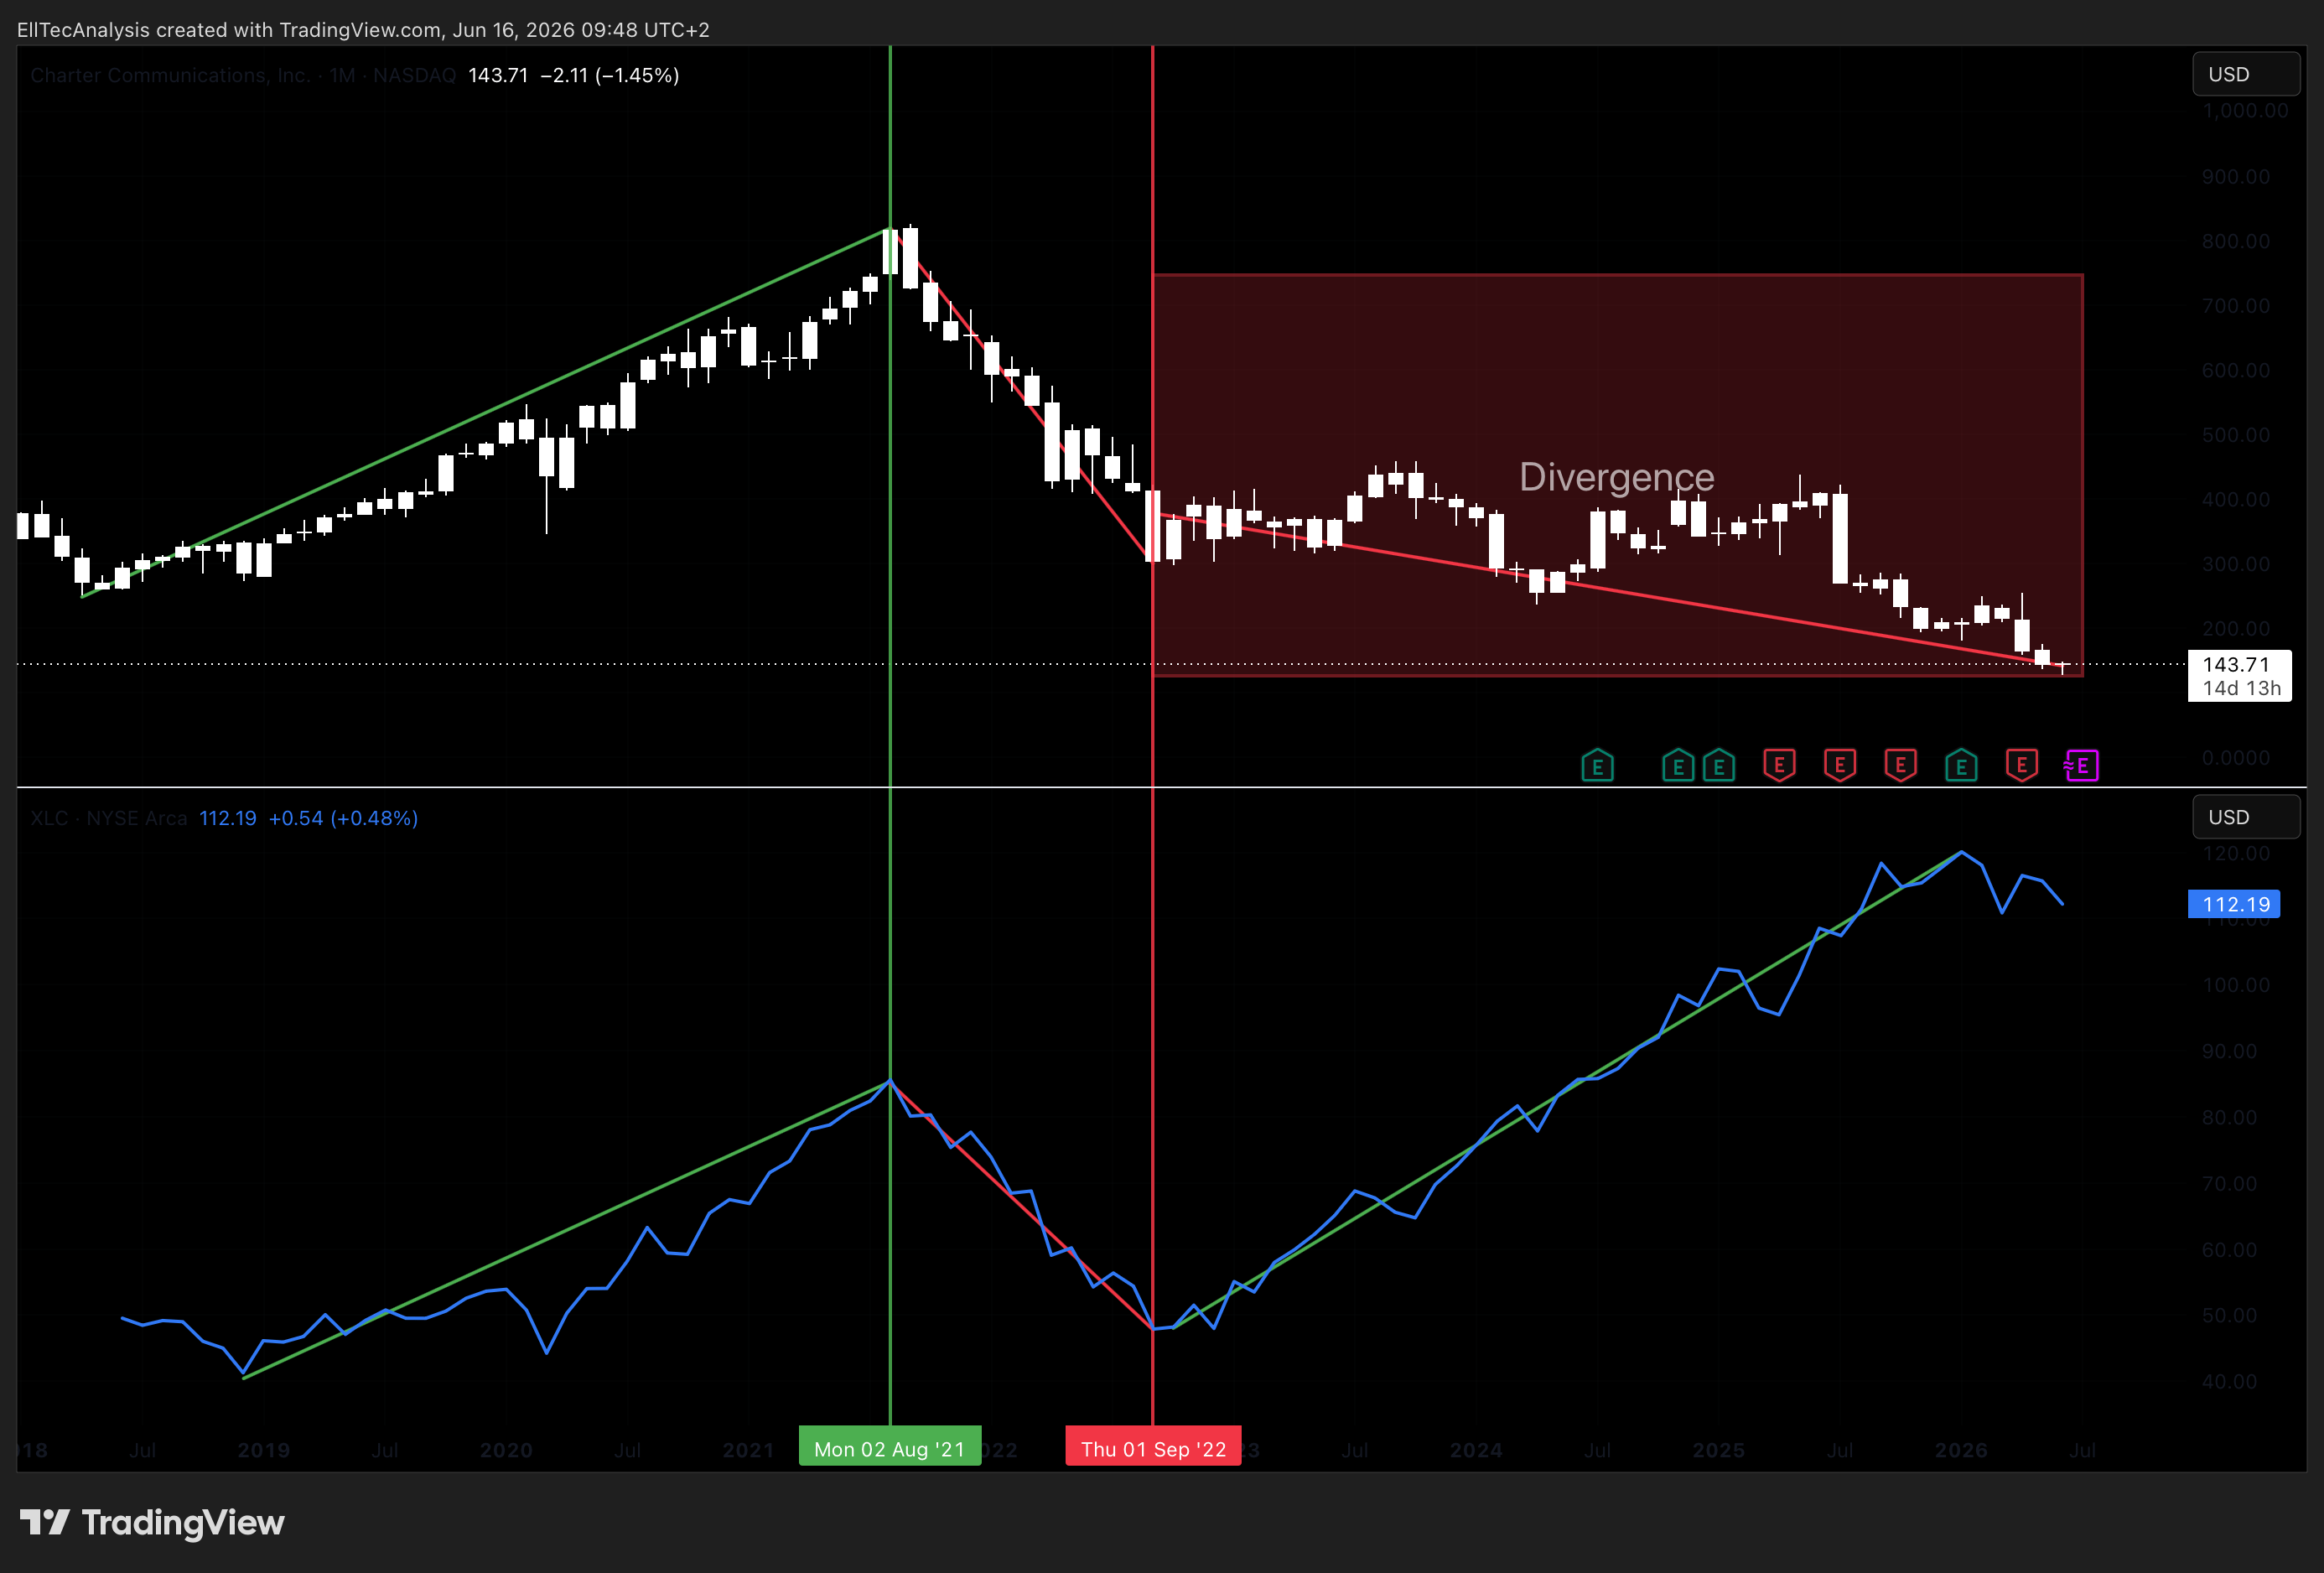
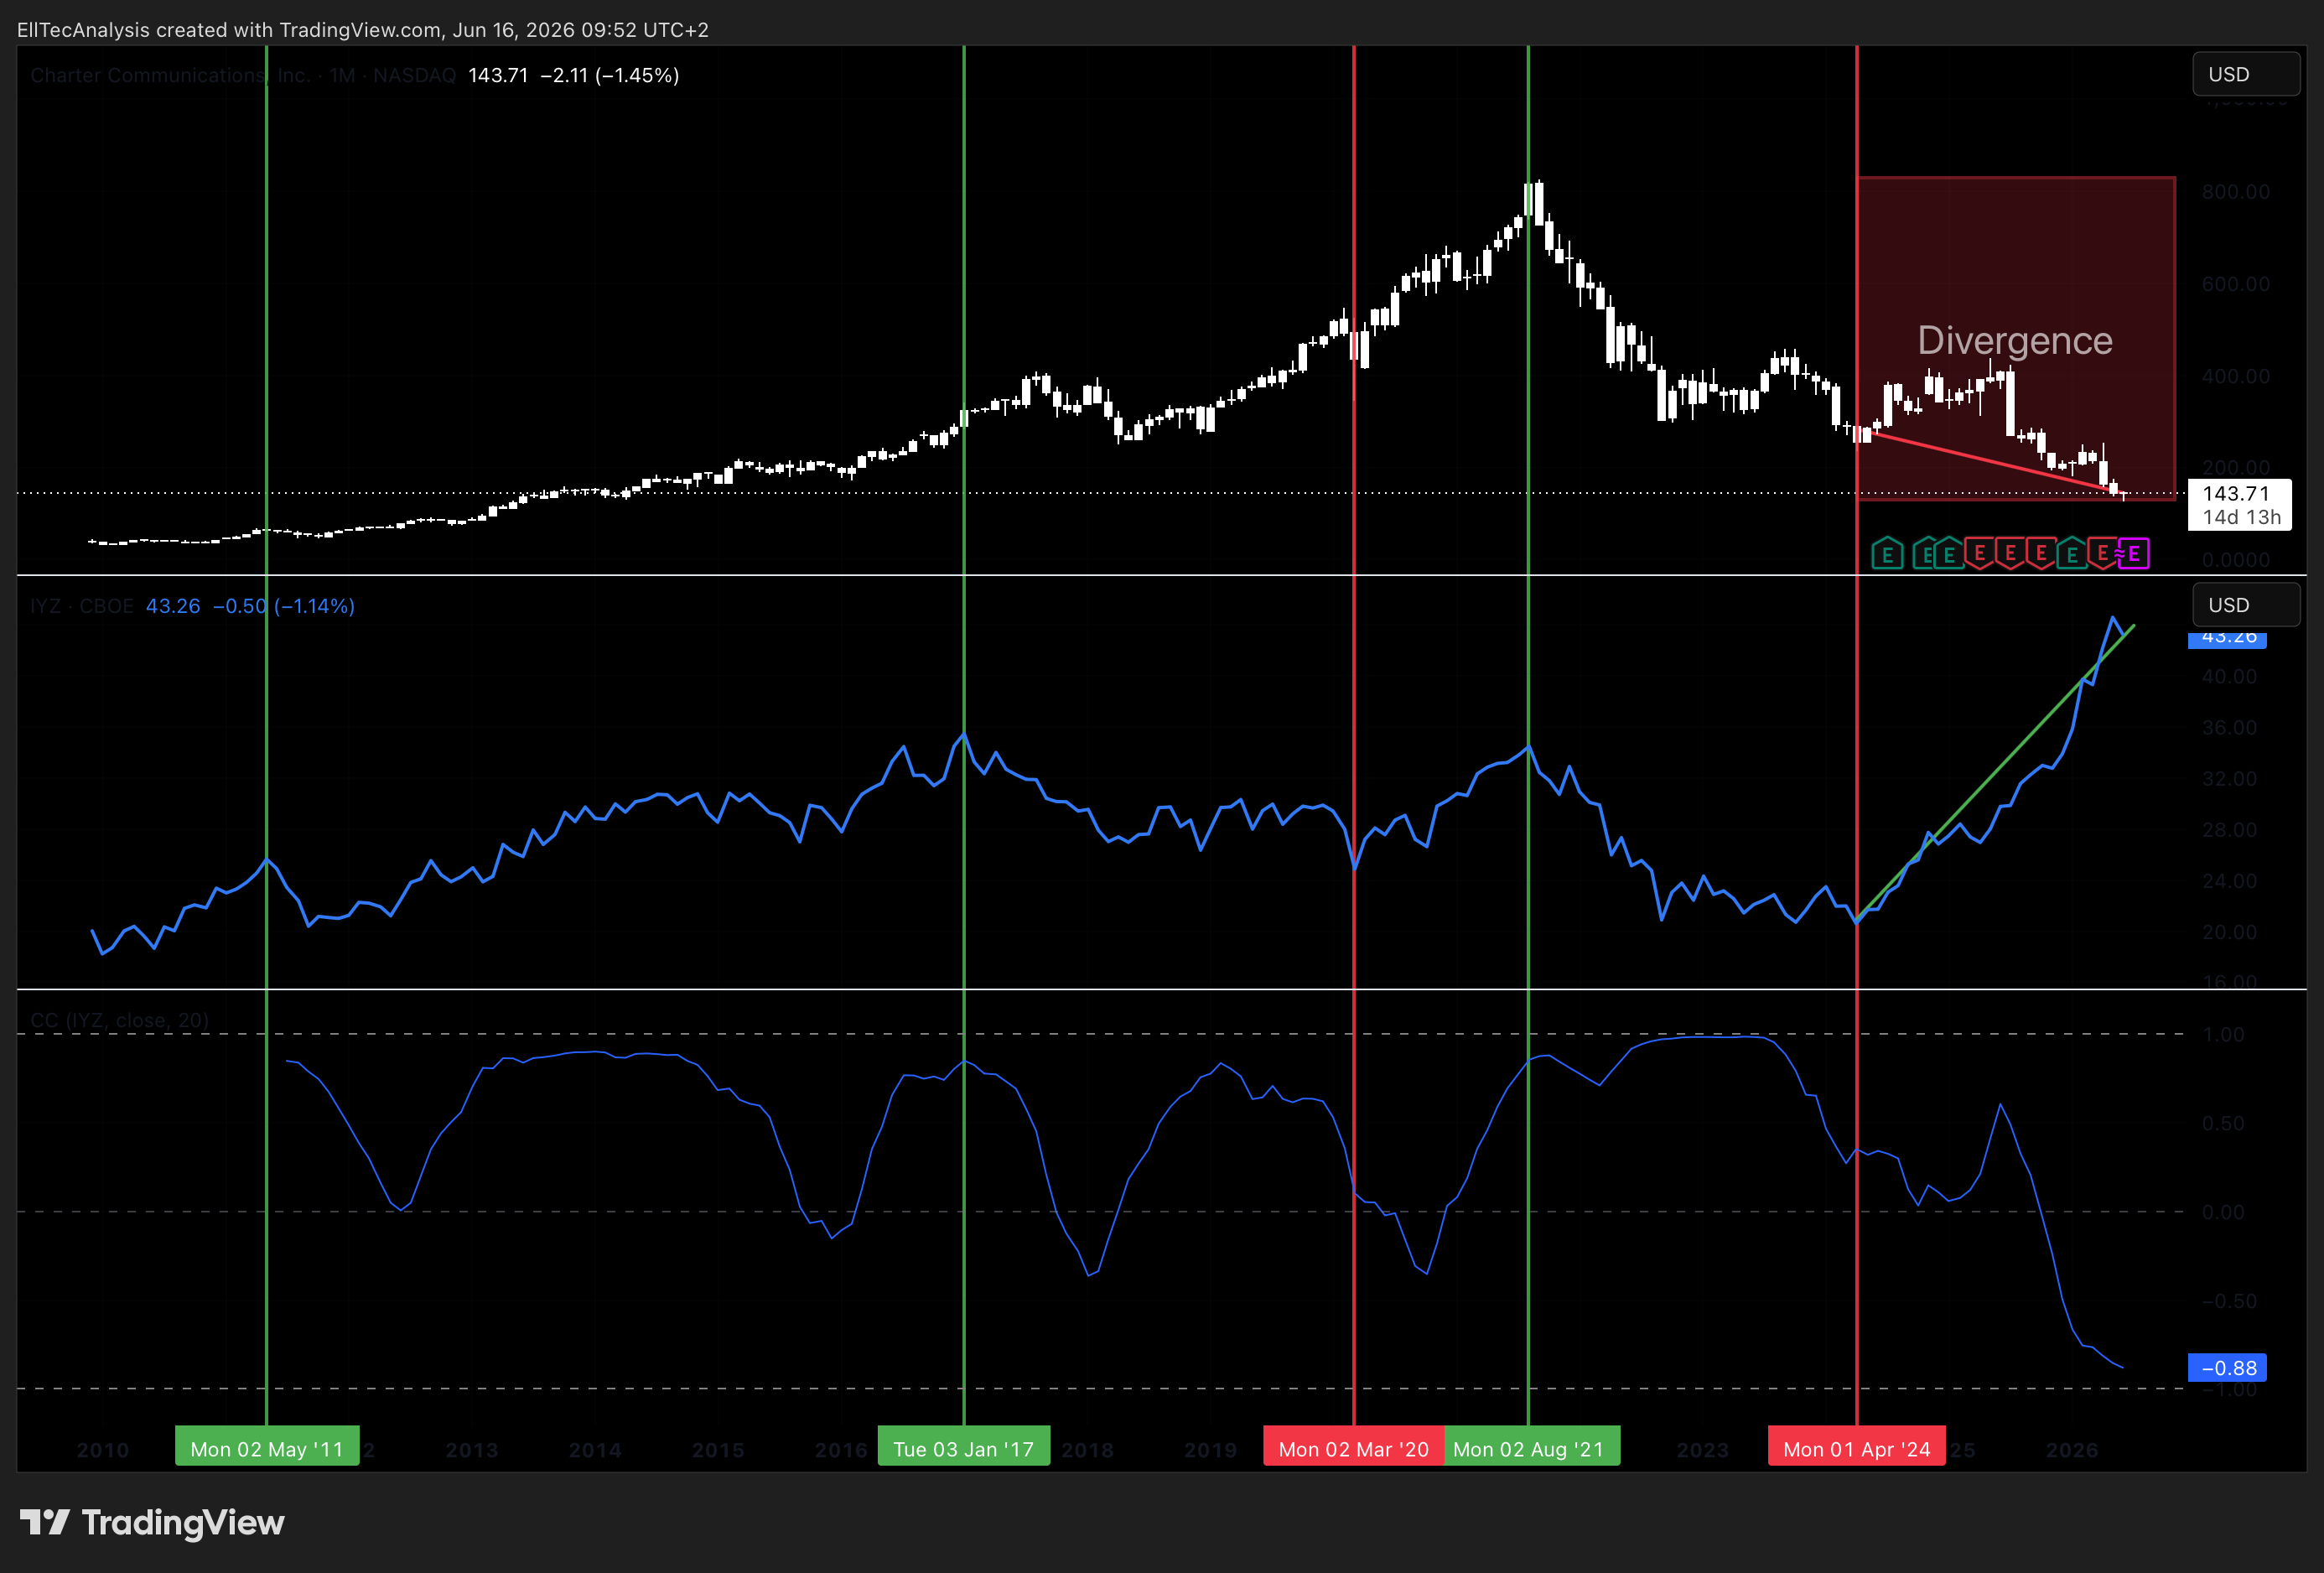
Charter moves broadly in line with the US communication services sector, though with a higher beta to sentiment events given its leverage profile. Periods of sector rotation into defensive yield-generating assets have historically provided relative support, while risk-off episodes that reprice credit tend to amplify CHTR’s downside relative to less-leveraged peers. The sector correlation is reliable in direction but inconsistent in magnitude, and it functions most clearly as a regime identifier rather than a precise timing signal. The divergence in the XLC and IYZ indicates strong weakness in CHTR and a potential trend reversal, which lines up to the primary Elliot Wave scenario displayed below.
CORRELATION 02
Comcast Corporation (CMCSA)
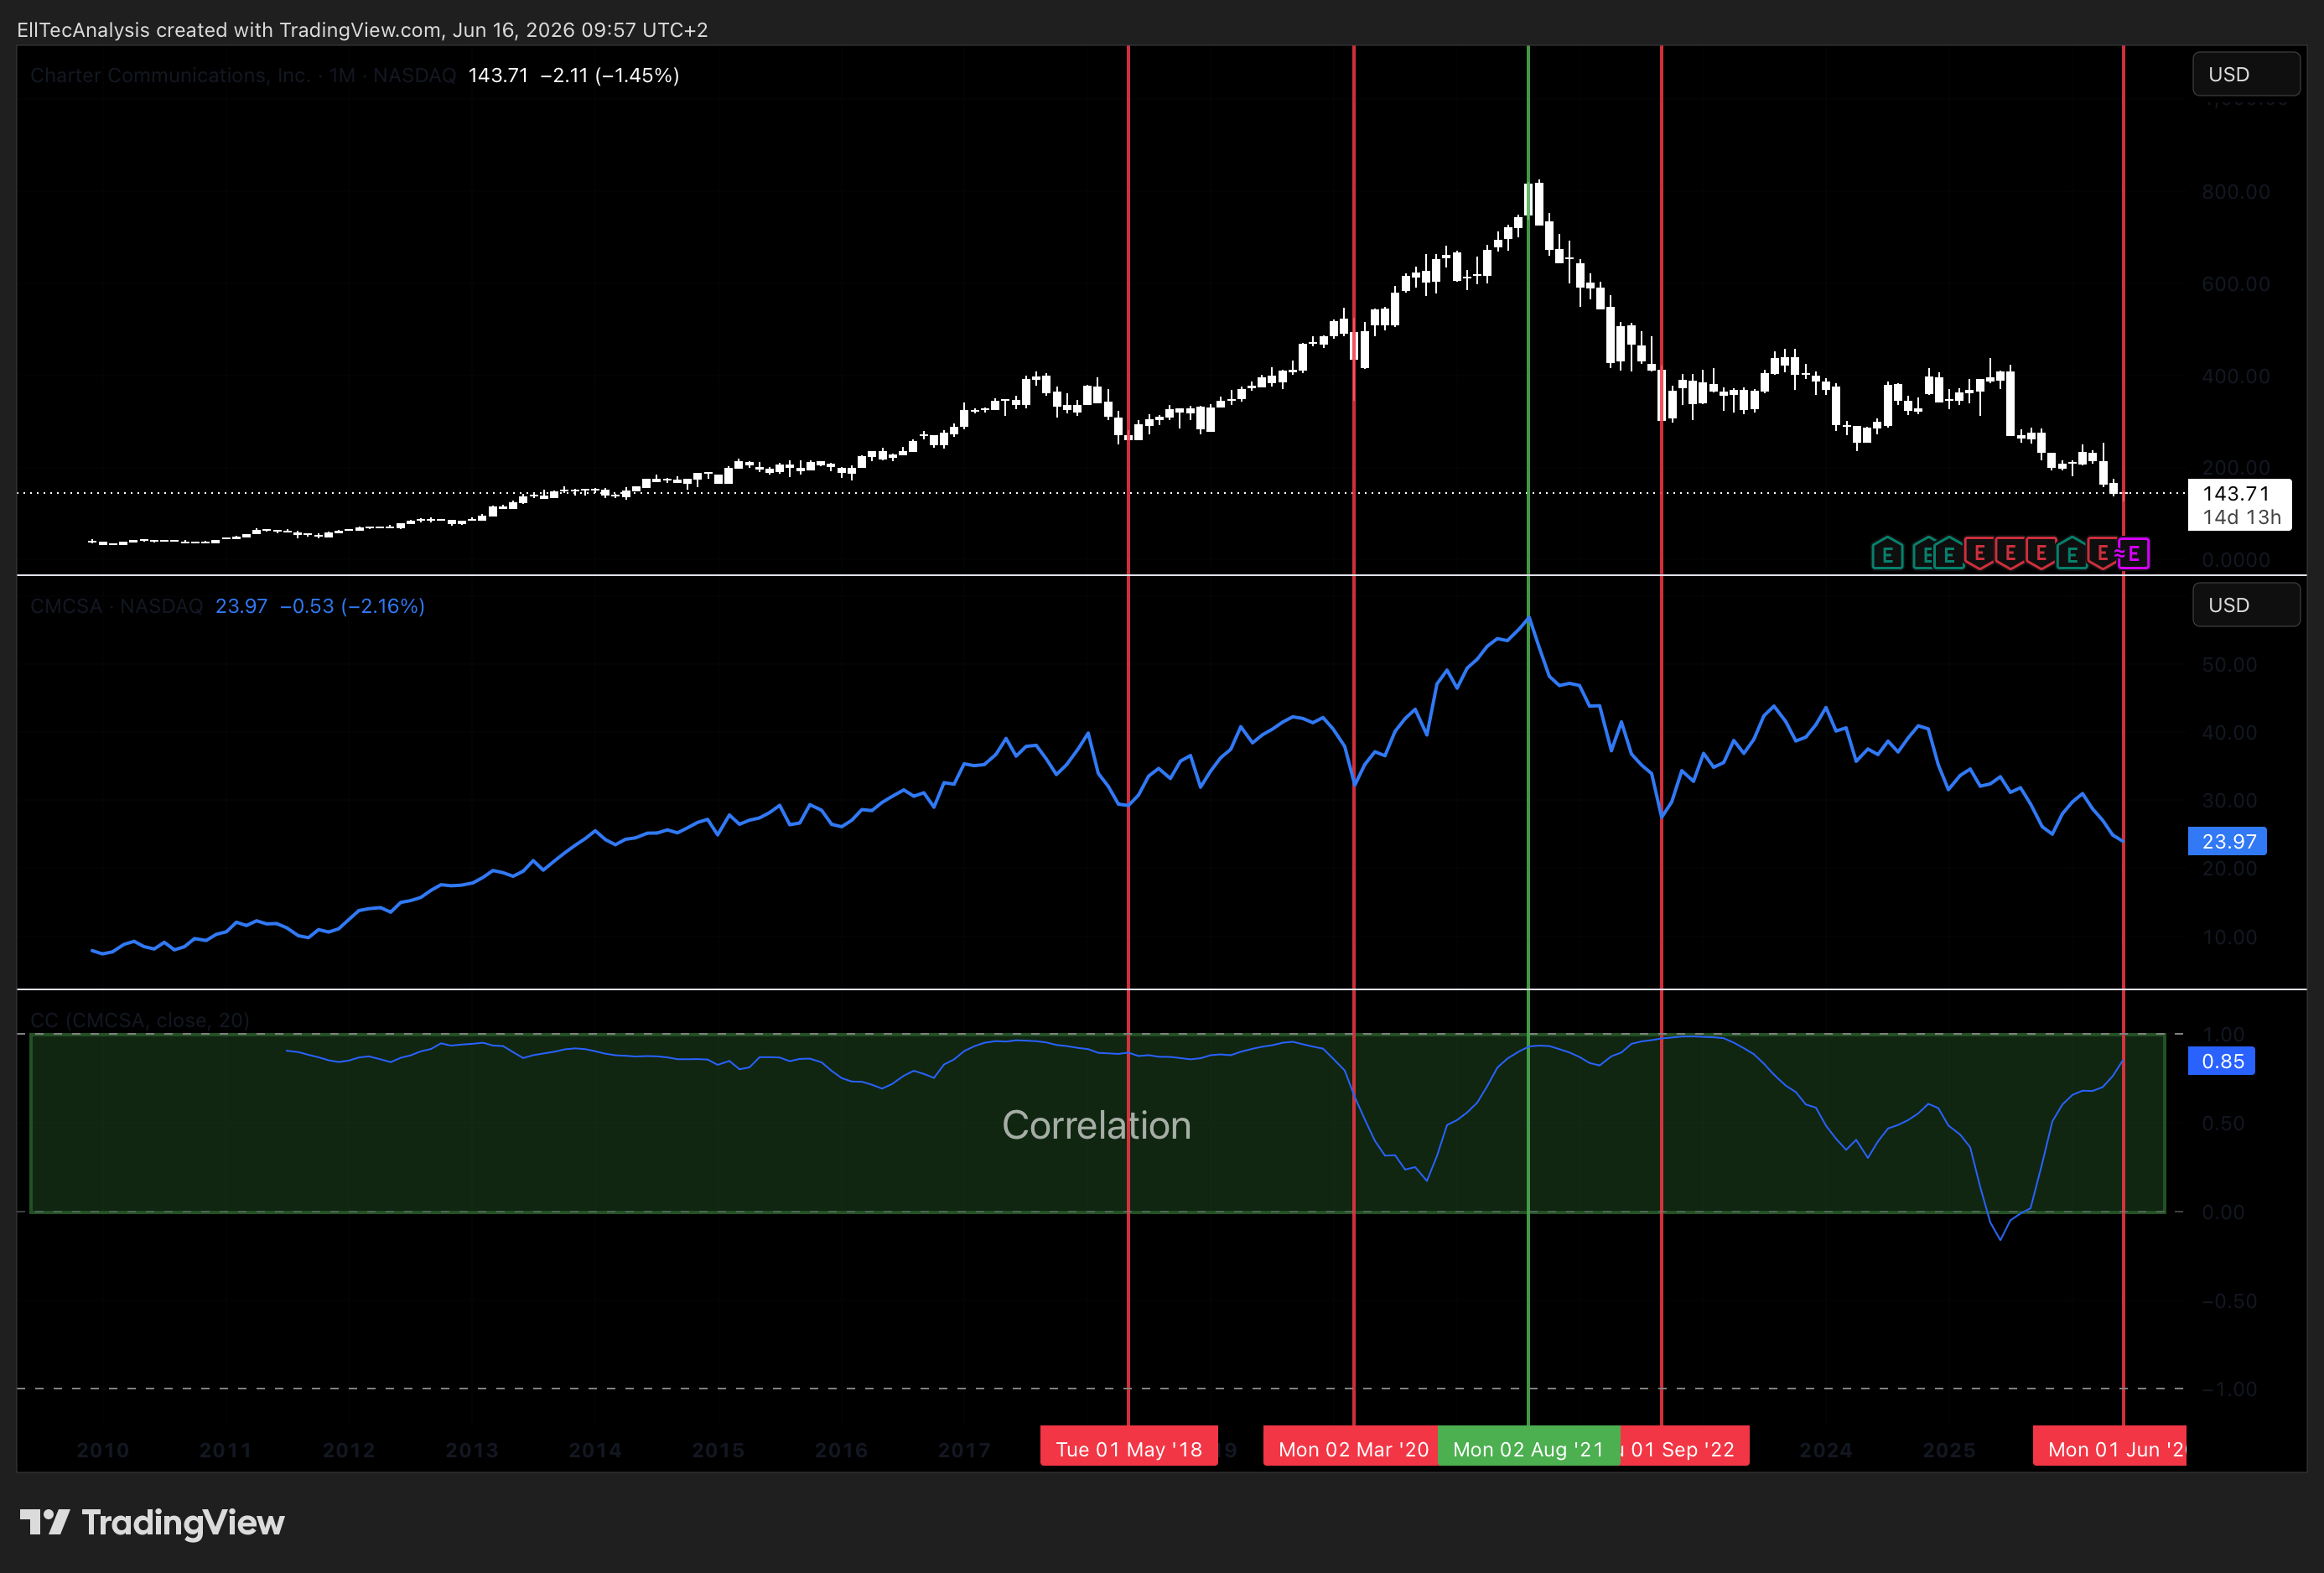
Charter and Comcast are the two dominant US cable operators and constitute a natural peer pair. Their correlation is high in structural terms, reflecting shared exposure to broadband subscriber dynamics, programming cost inflation, mobile MVNO (Mobile Virtual Network Operator) economics, and regulatory risk. Divergences tend to emerge around company-specific catalysts, such as merger announcements or subscriber data prints. In the current cycle, CHTR’s deeper drawdown versus CMCSA reflects the market’s more acute concern with Charter’s leverage and the execution risk embedded in the Cox acquisition, which creates a potential mean-reversion setup if Charter’s synergy delivery begins to close the valuation gap.
CORRELATION 03
US 10-Year Treasury Yield (US10Y)
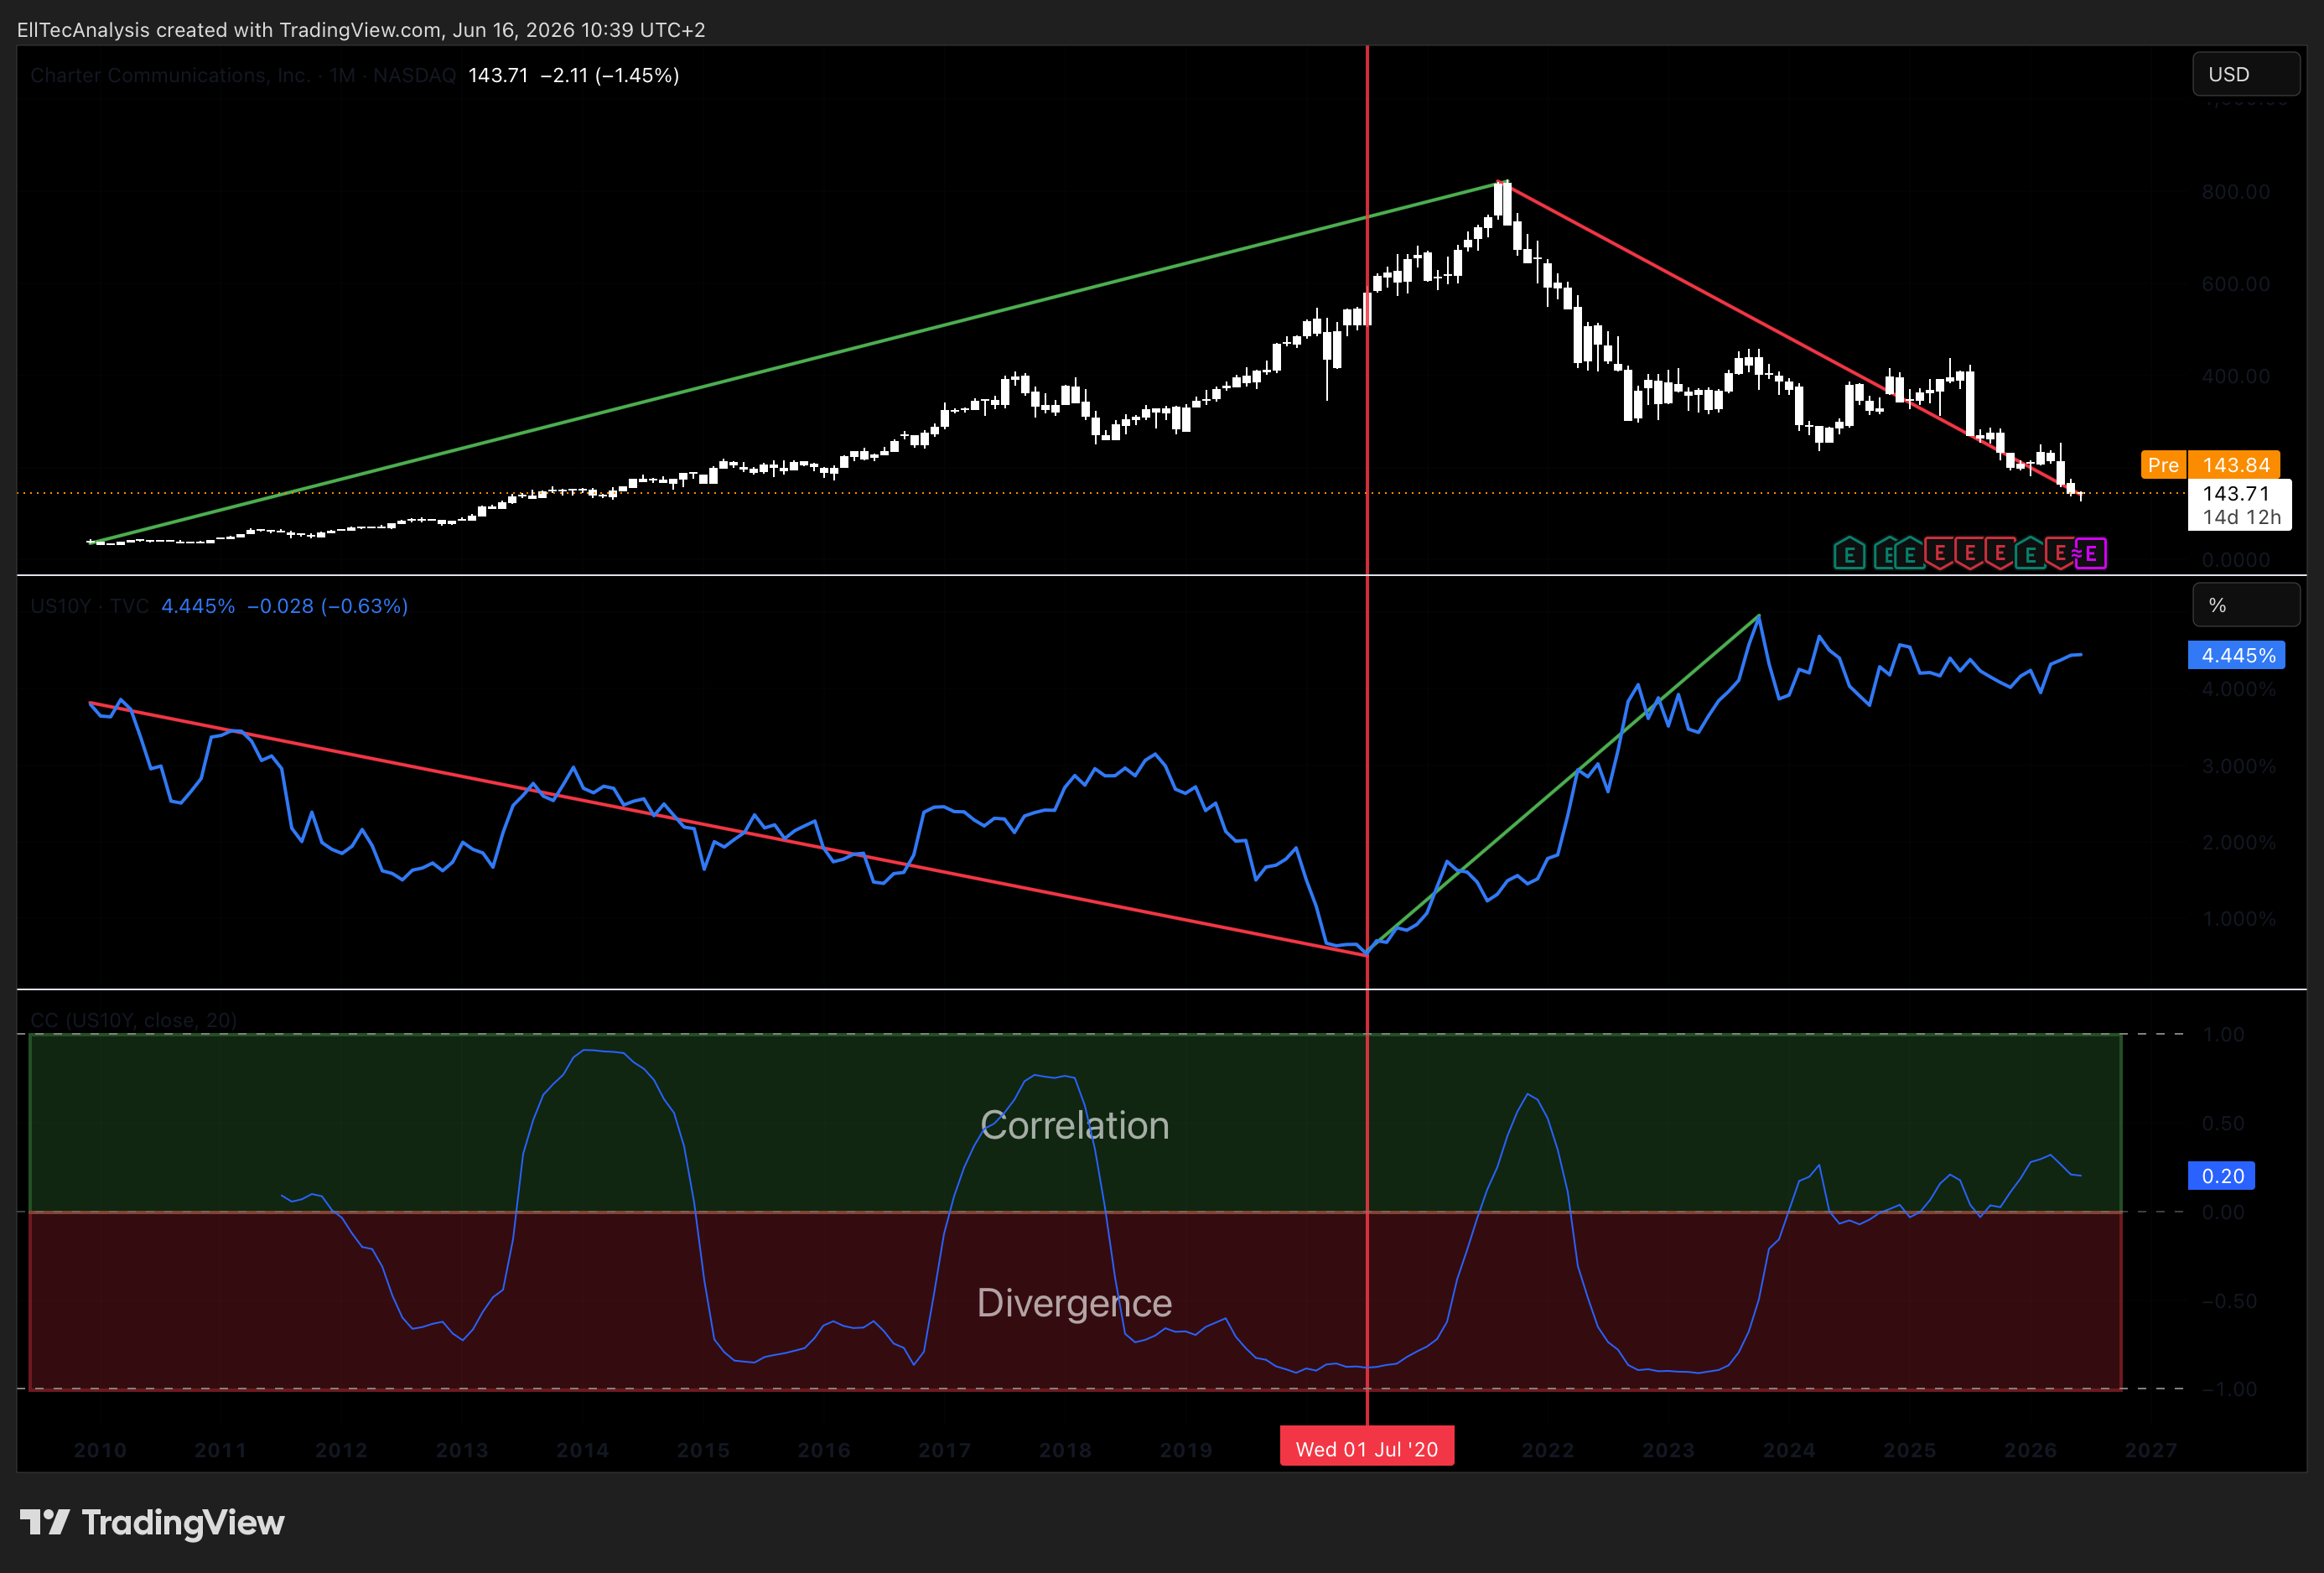
Charter’s equity carries an inverse relationship with US Treasury yields, amplified by its balance sheet structure. With net debt well above $90 billion on a pro forma post-Cox basis, the company’s interest expense, refinancing risk, and market-implied discount rate are all directly sensitive to the rate environment. The correlation has been particularly pronounced since the Federal Reserve’s 2022 tightening cycle, which is one of the primary drivers of the stock’s multi-year decline from peak levels above $800. Any sustained move lower in long-end yields, reflecting either a growth deceleration or a return to easing policy, represents a direct fundamental tailwind for CHTR’s free cash flow profile and equity multiple. The inverse relationship here is structural, not incidental.
CORRELATION 04
Fixed Wireless Access Competitive Dynamics (T-Mobile TMUS / Verizon VZ)
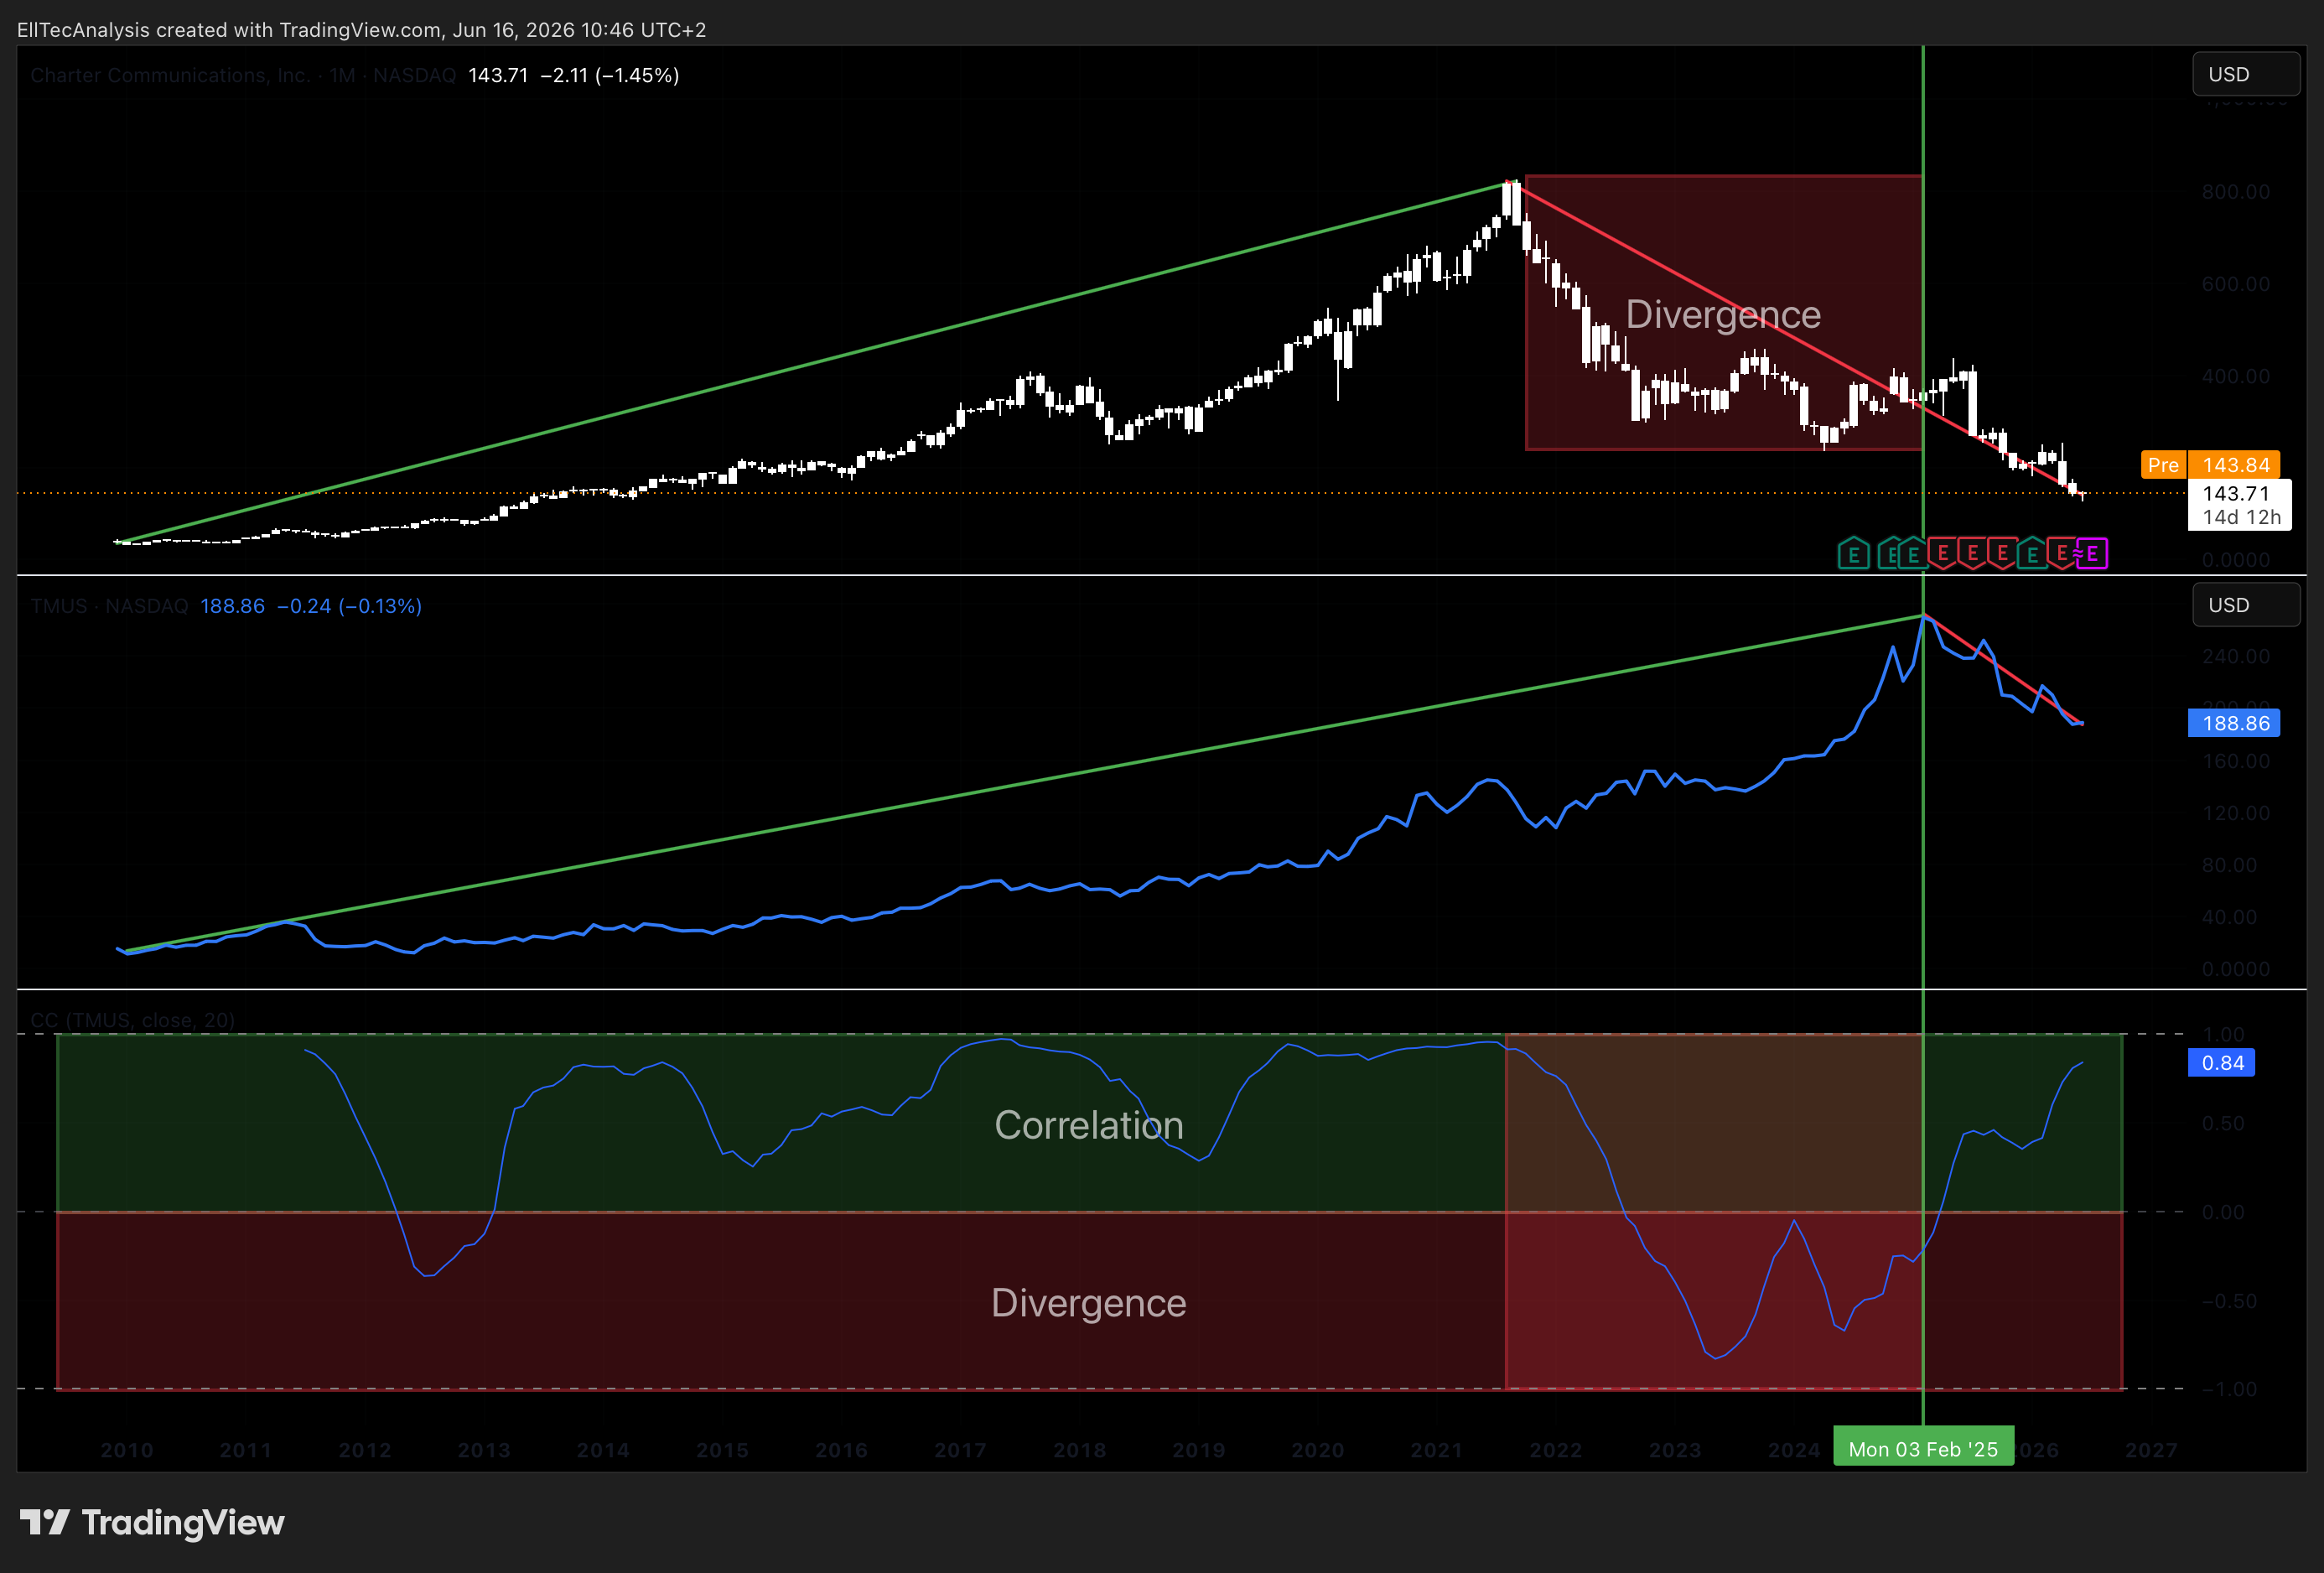
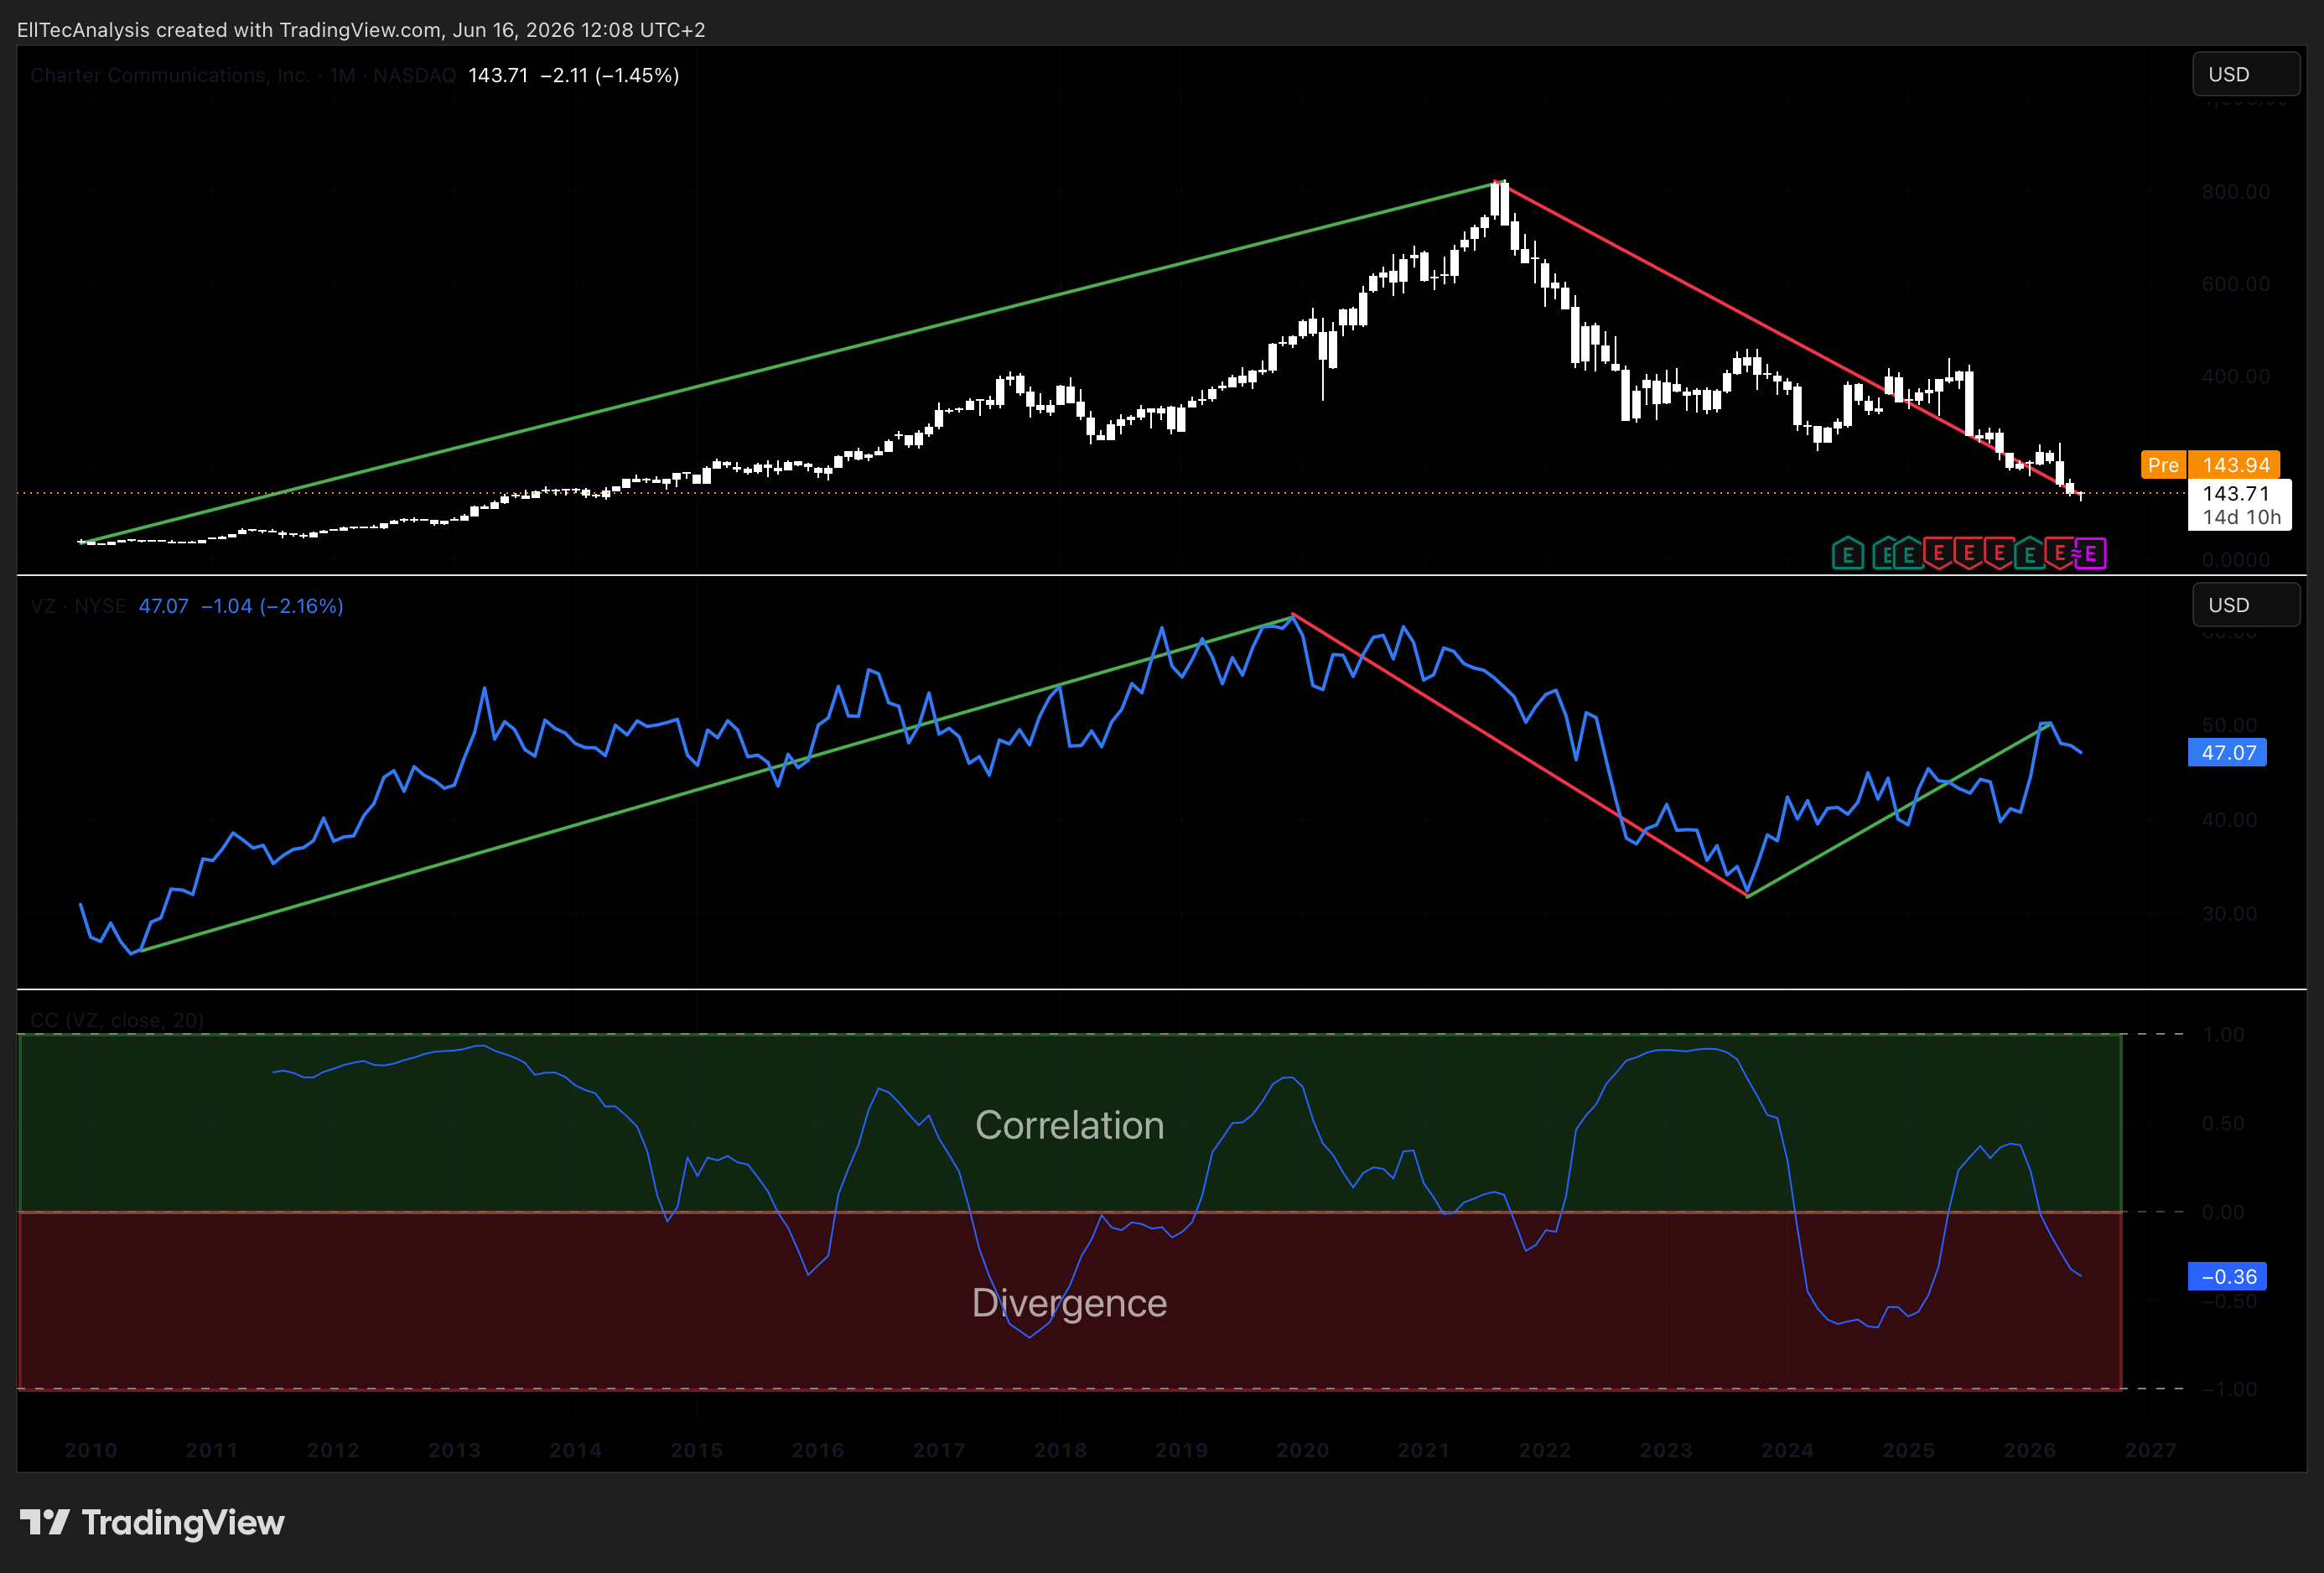
The relationship between Charter and the major wireless carriers is increasingly competitive rather than correlative, which makes this pairing analytically valuable as a divergence monitor. As T-Mobile and Verizon expand fixed-wireless access penetration into Charter’s cable footprint, their relative outperformance versus CHTR tracks directly with the market’s assessment of structural competitive pressure on the broadband subscriber base. Periods in which TMUS significantly outperforms CHTR on a relative basis tend to coincide with elevated investor concern about broadband churn. Any evidence that fixed-wireless growth is plateauing, which is beginning to appear in some markets as 5G capacity constraints emerge, would represent a sentiment shift benefiting Charter disproportionately.
03
