

Adobe
A creative software giant is being priced as if its growth story is over. The structure says otherwise.


1. FUNDAMENTALS
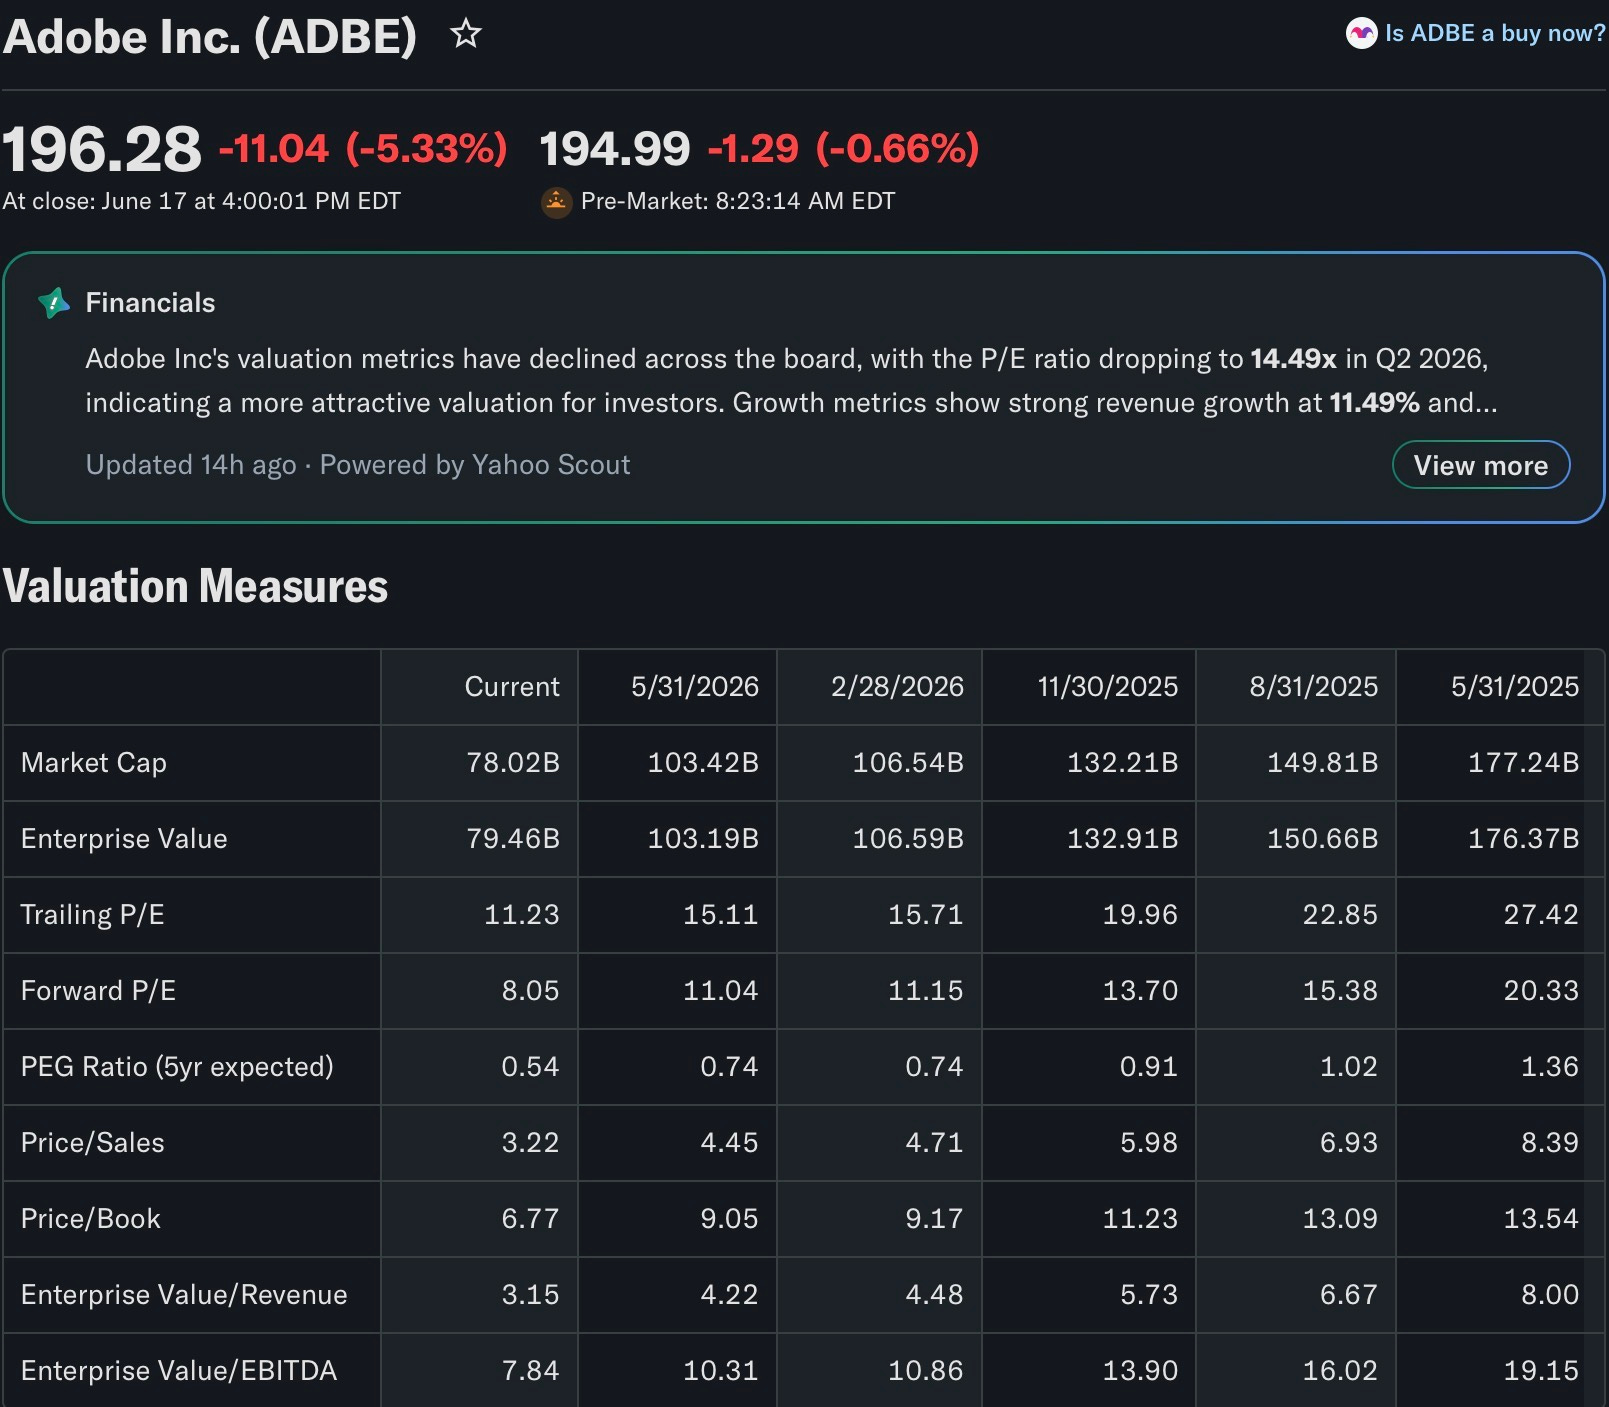
Adobe Incorporated remains the dominant force in creative, document, and digital experience software, with Photoshop, Illustrator, Premiere Pro, and Acrobat functioning as default infrastructure across creative, marketing, and enterprise workflows worldwide. The company operates through two primary segments, Digital Media and Digital Experience, both of which have continued to post double digit growth even as the market has grown increasingly skeptical of Adobe’s ability to monetize the AI transition. Fiscal 2025 closed with record revenue of 23.77 billion US Dollar, up eleven percent year over year, while GAAP diluted earnings per share grew thirty five percent to 16.70 US Dollar. The momentum has carried into fiscal 2026, with second quarter revenue reaching a record 6.62 billion US Dollar, representing thirteen percent year over year growth, and non GAAP earnings per share of 5.96 US Dollar beating consensus estimates of 5.82.
The macro narrative around Adobe in 2026 is unusually disconnected from its underlying numbers. Despite beating on both revenue and earnings in the most recent quarter, the stock continued to sell off, falling toward the low two hundreds and trading more than thirty percent below its yearly highs. The market’s concern centers on the perceived threat of generative and agentic AI tools eroding Adobe’s moat in creative software, alongside uncertainty around the company’s pivot toward freemium and AI first monetization models. Management has pushed back firmly on this narrative, pointing to AI first annualized recurring revenue tripling year over year to exceed 500 million US Dollar, alongside total annualized recurring revenue of 27.10 billion US Dollar, partly bolstered by the 1.9 billion US Dollar Semrush acquisition. The board has simultaneously approved a 25 billion US Dollar share repurchase authorization extending through 2030, a clear signal of management’s confidence in long term cash flow generation even as the market prices in existential AI disruption risk.
This divergence between fundamental execution and price action is the core of the current setup. Adobe is not a company in decline, it is a company whose growth engine, AI integration across Creative Cloud, Document Cloud, and Experience Cloud, is being treated by the market as a threat rather than an opportunity. Historically, periods where a structurally dominant company sees its valuation compressed on narrative fear rather than deteriorating fundamentals have produced some of the most attractive long term entry conditions. The macro thesis for EllTec Analysis is that Adobe’s competitive position, balance sheet strength, and AI monetization trajectory remain intact, and that the current price weakness reflects a sentiment driven correction rather than a structural breakdown in the business.
2. CORRELATIONS
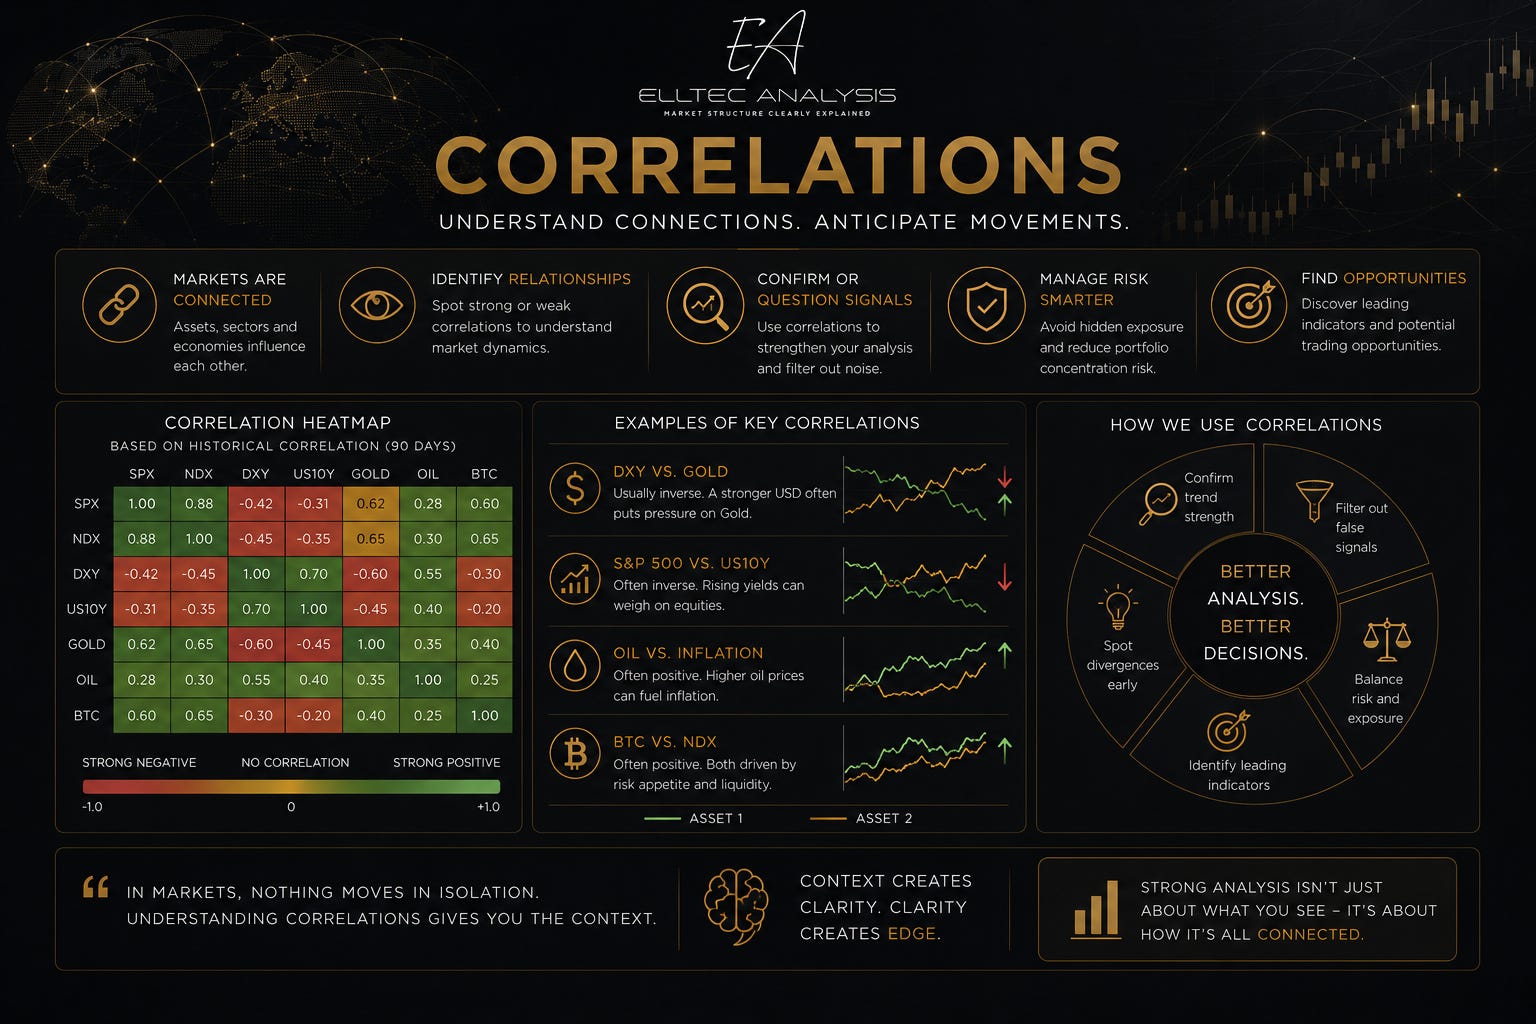
The correlation structure of Adobe is layered and regime dependent, reflecting its dual identity as both a high quality, profitable software compounder and a high beta member of the broader technology growth complex.
Nasdaq 100 (US technology Index)
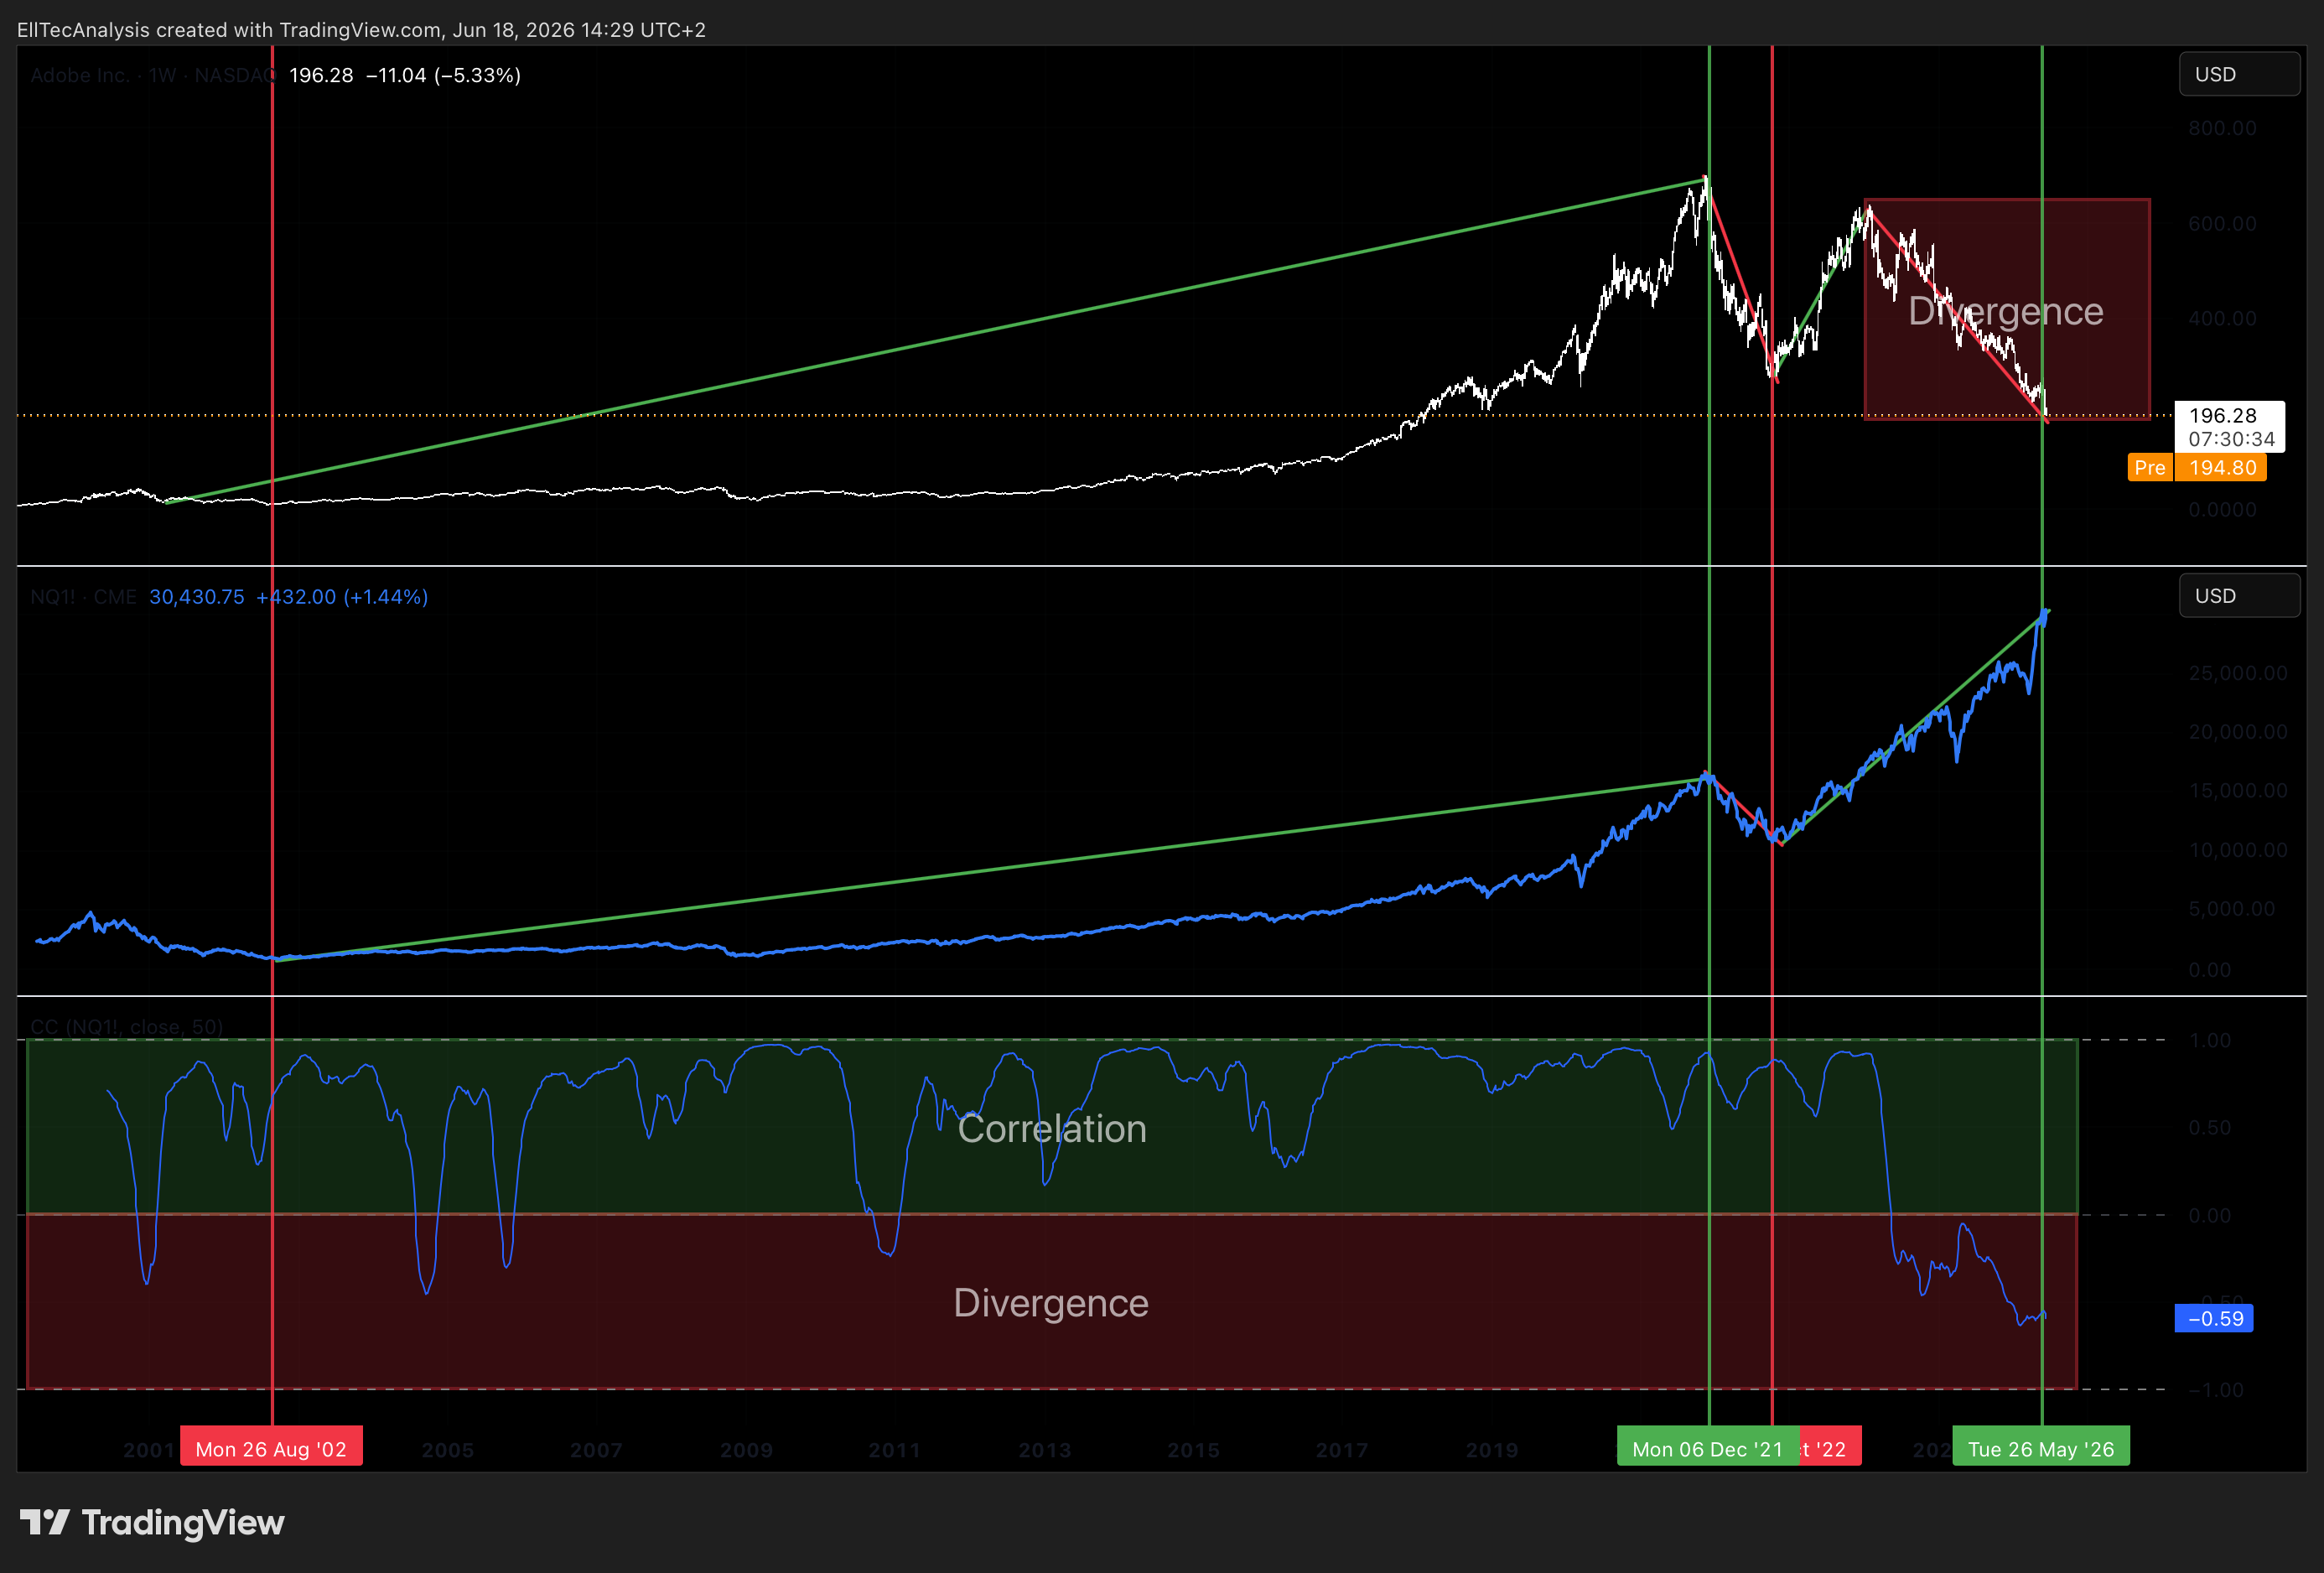
Adobe trades with a high positive correlation to the Nasdaq 100 and the broader software sector, as it is widely held within growth and technology focused portfolios. Since February 2024 a strong divergence can be seen in both assets, where ADBE fell strong, while the Nasdaq 100 reached new ATHs. This can indicate that ADBE is strongy oversold and a trend reversal could be ahead. This would align with the primary Elliot Wave scenario displayed below in the technical analysis.
Software Peer Group (Salesforce, ServiceNow, Intuit)
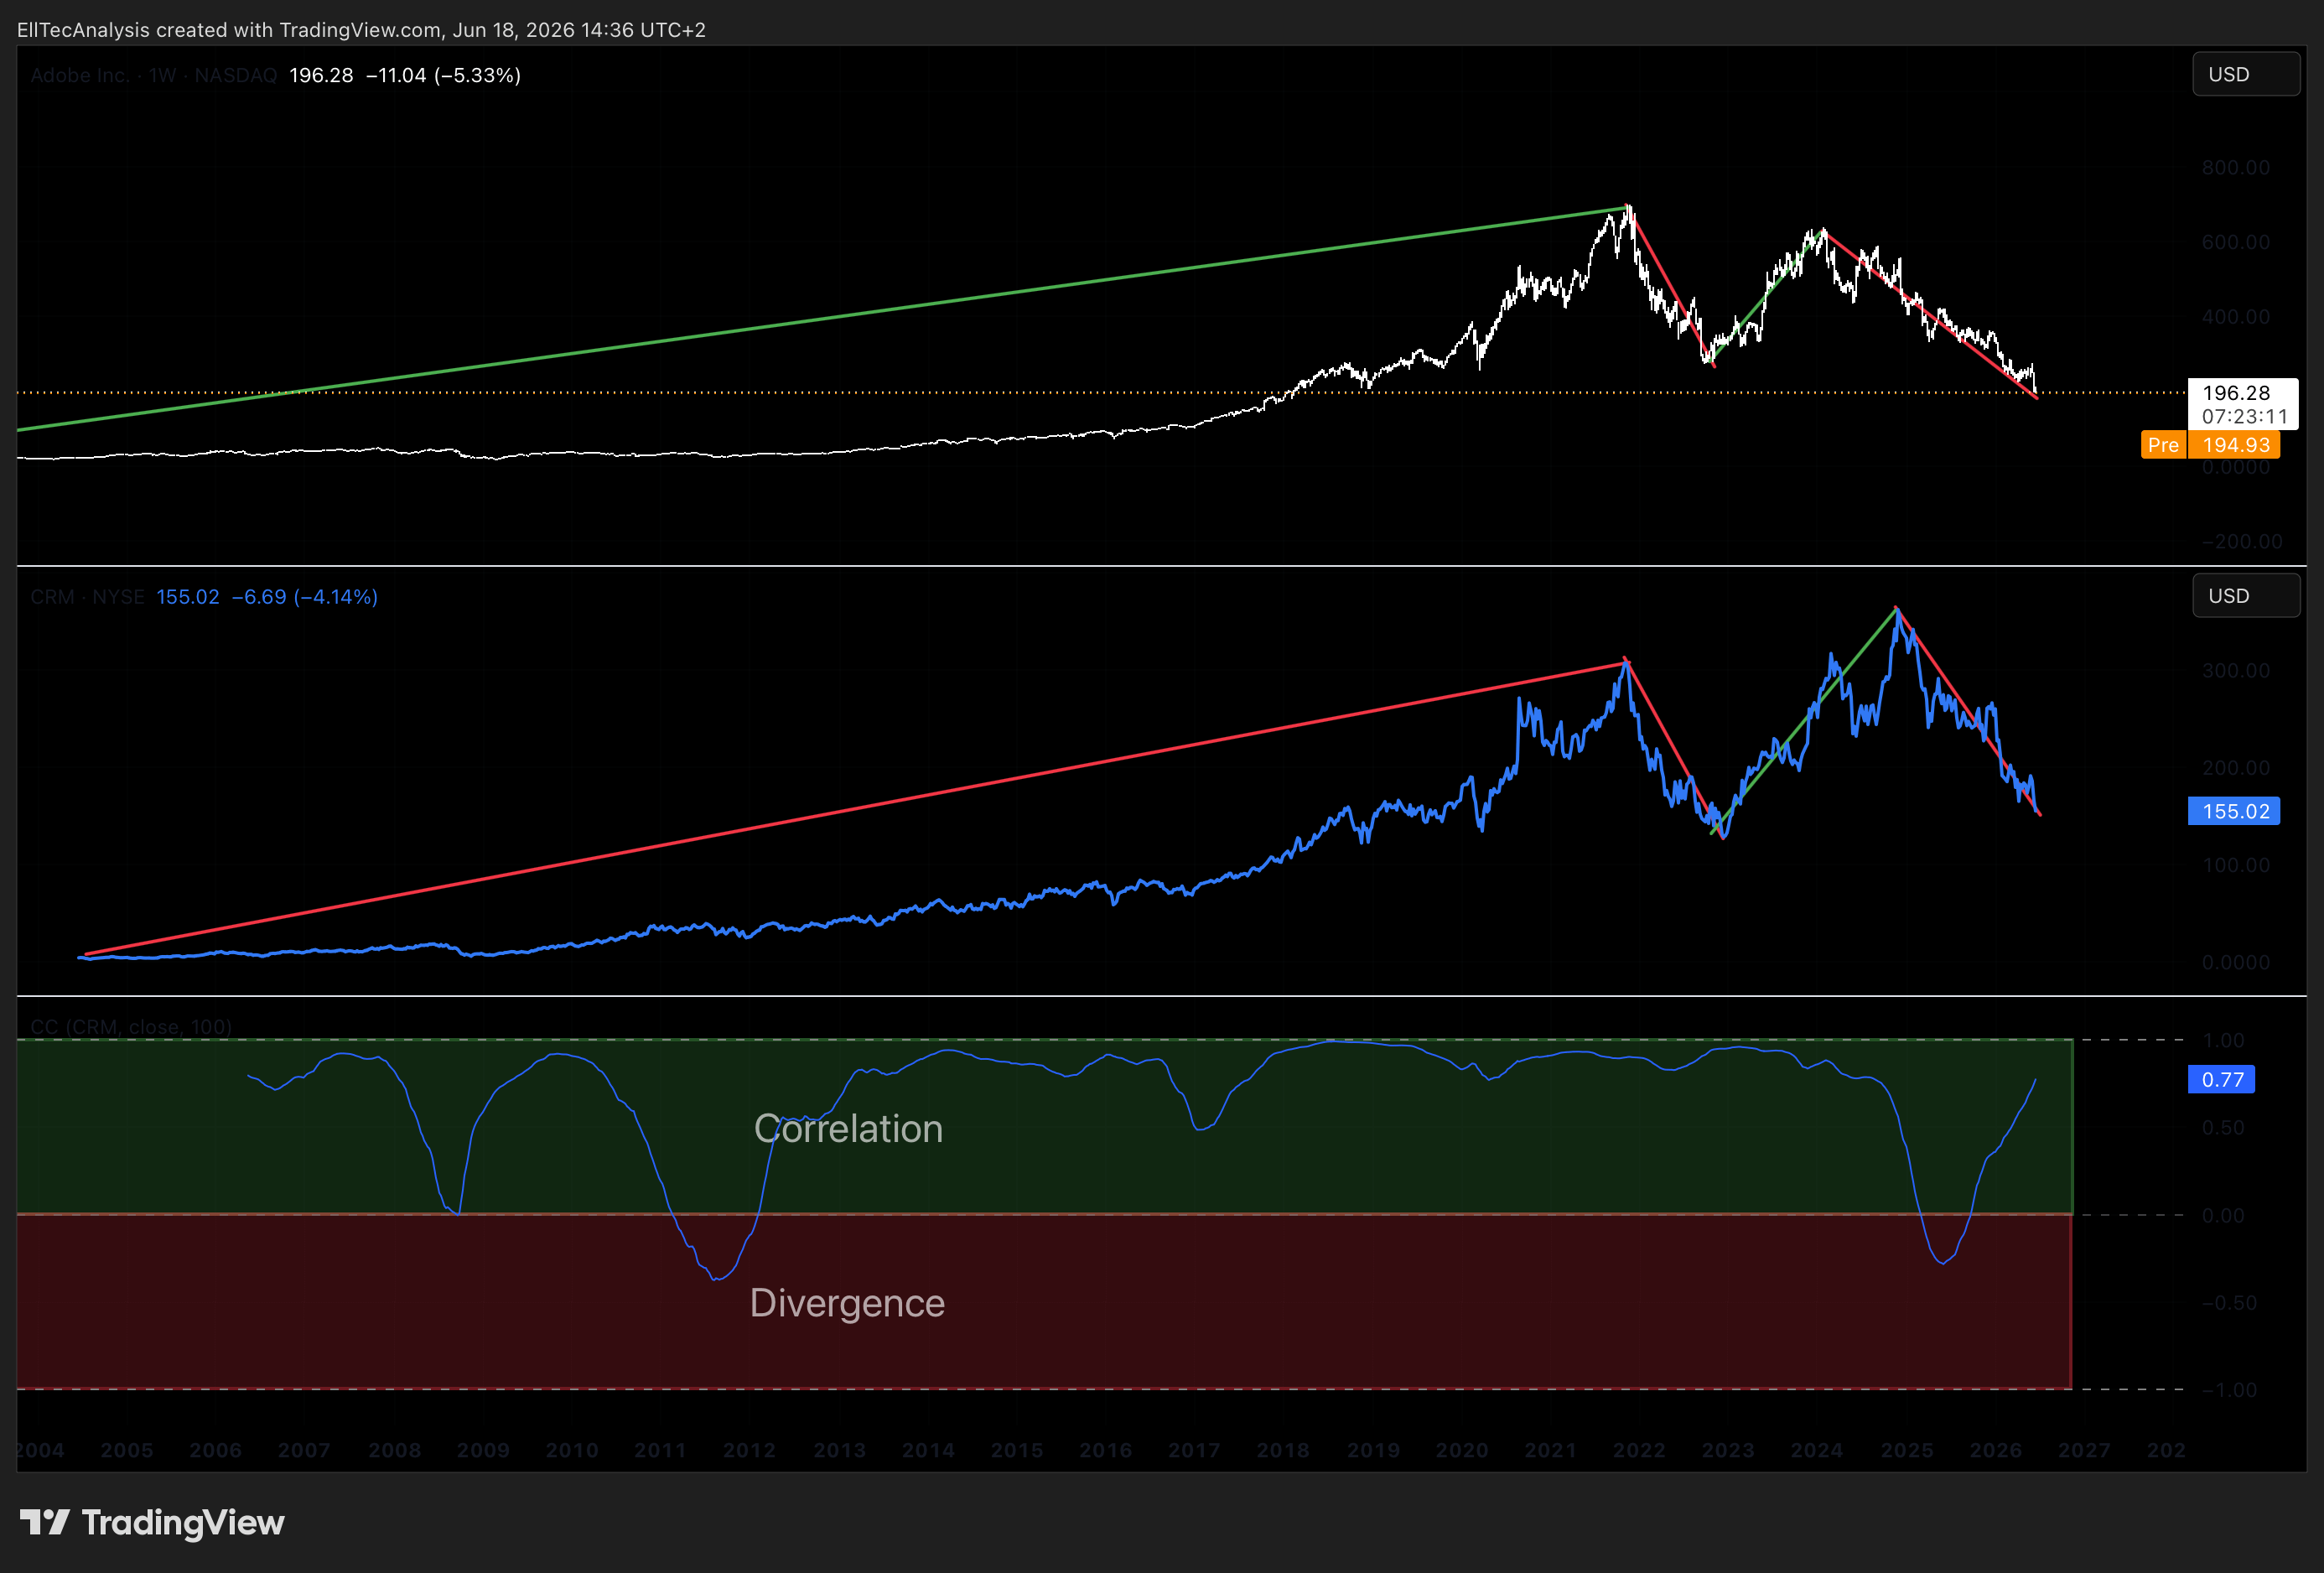
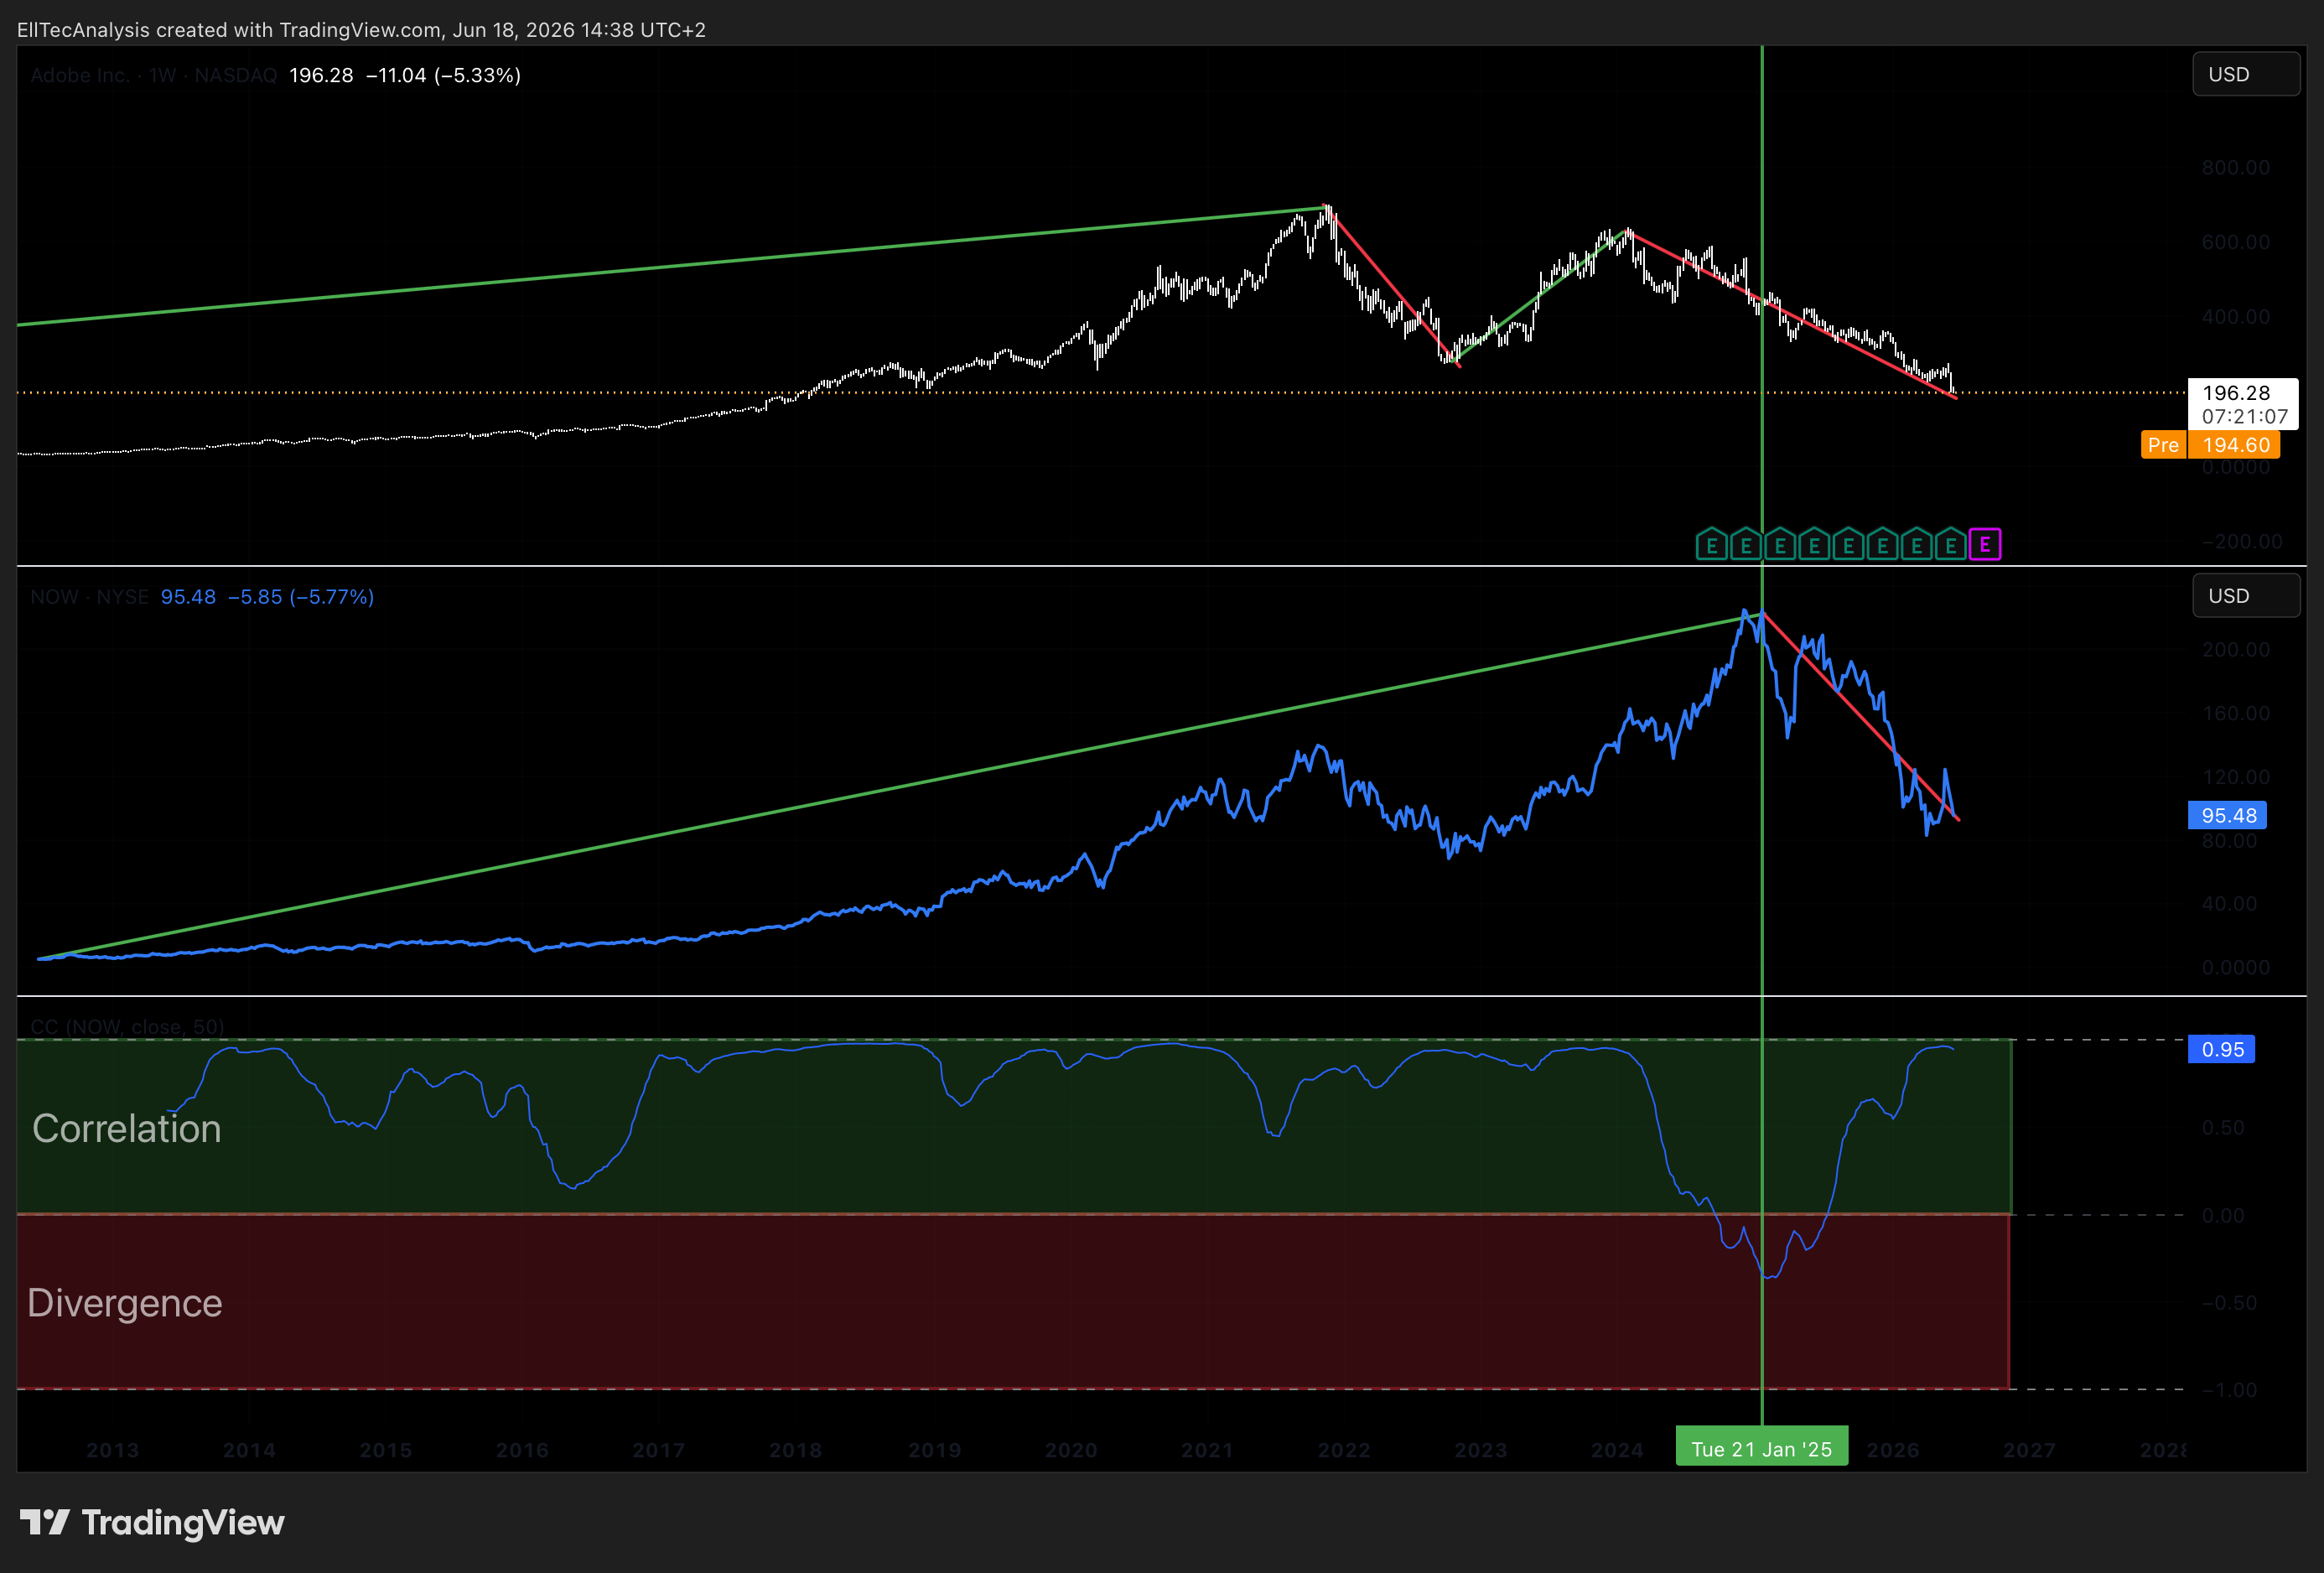
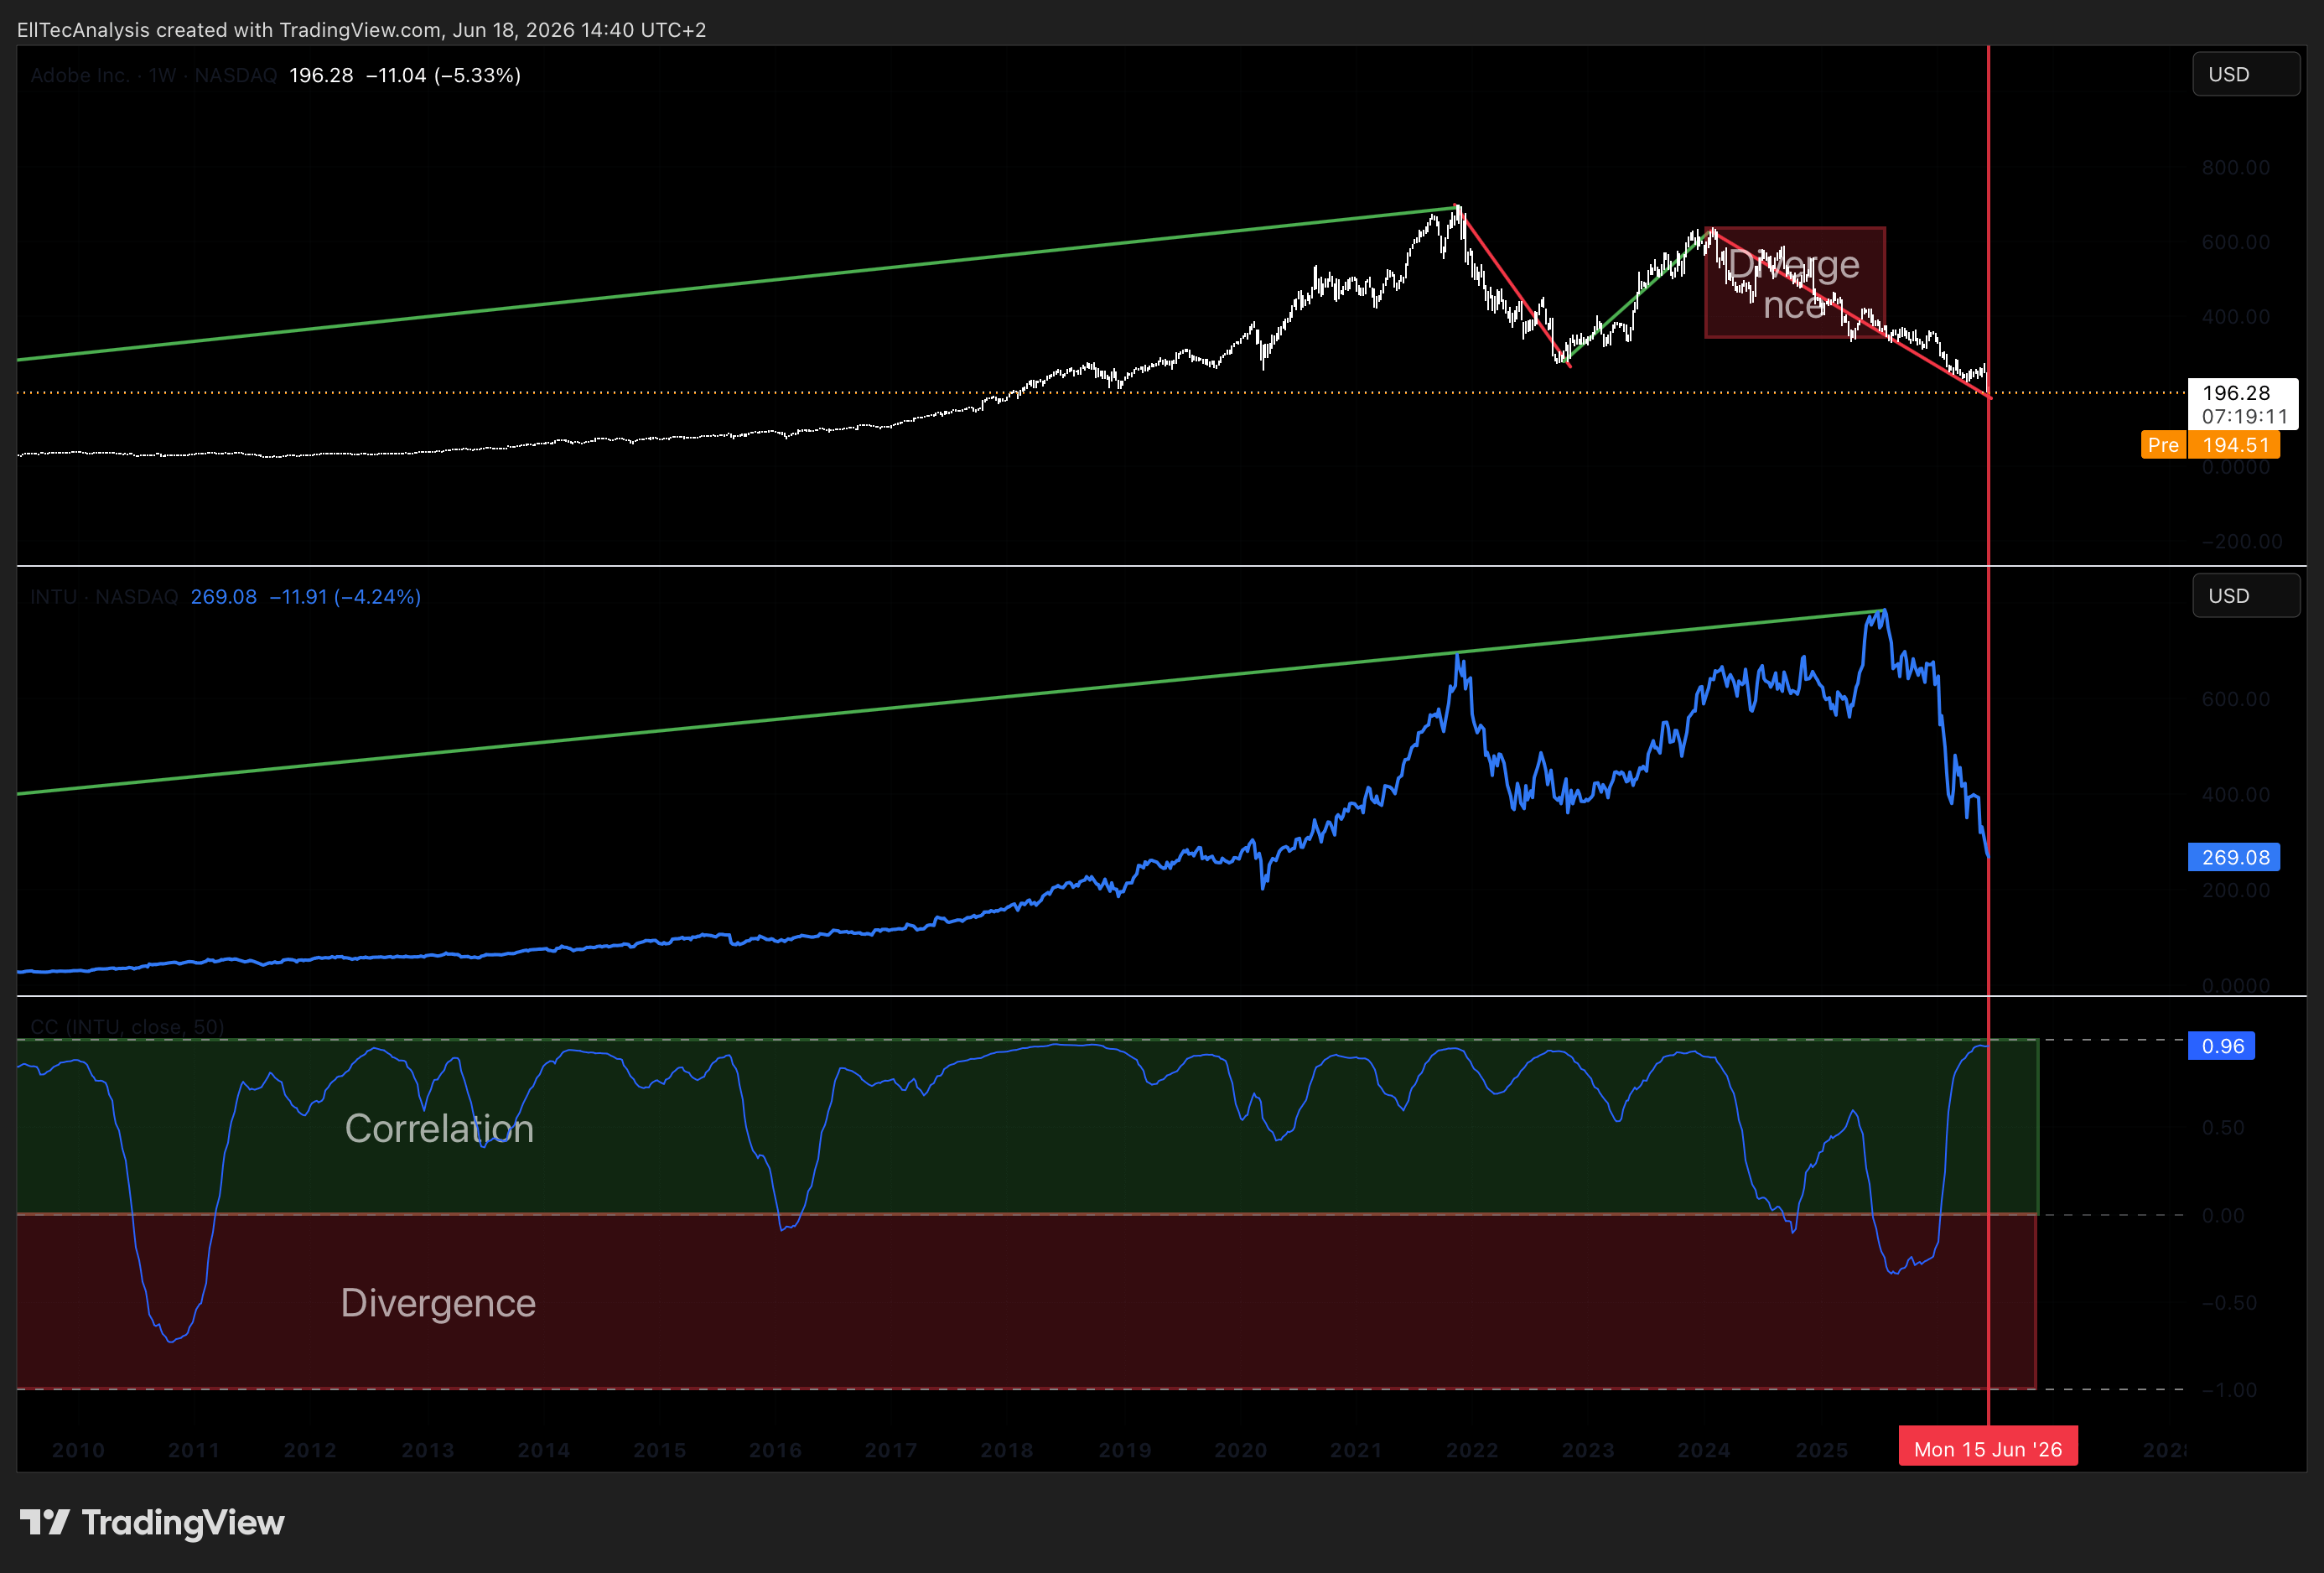
Adobe moves in close correlation with its enterprise software peer group, as the entire cohort is currently being repriced around the same central question, whether AI is a tailwind or a disruptive threat to recurring revenue software models. Divergences within this peer group tend to emerge around individual earnings events, as seen most recently when Adobe’s own report triggered an outsized reaction relative to peers despite beating estimates.
The strong correlation in the peer group with the strong bearish moves indicate an oversold price, which can result in a trend reversal, which adds up to the primary technical analysis displayed below.
US 10 Year Treasury Yield
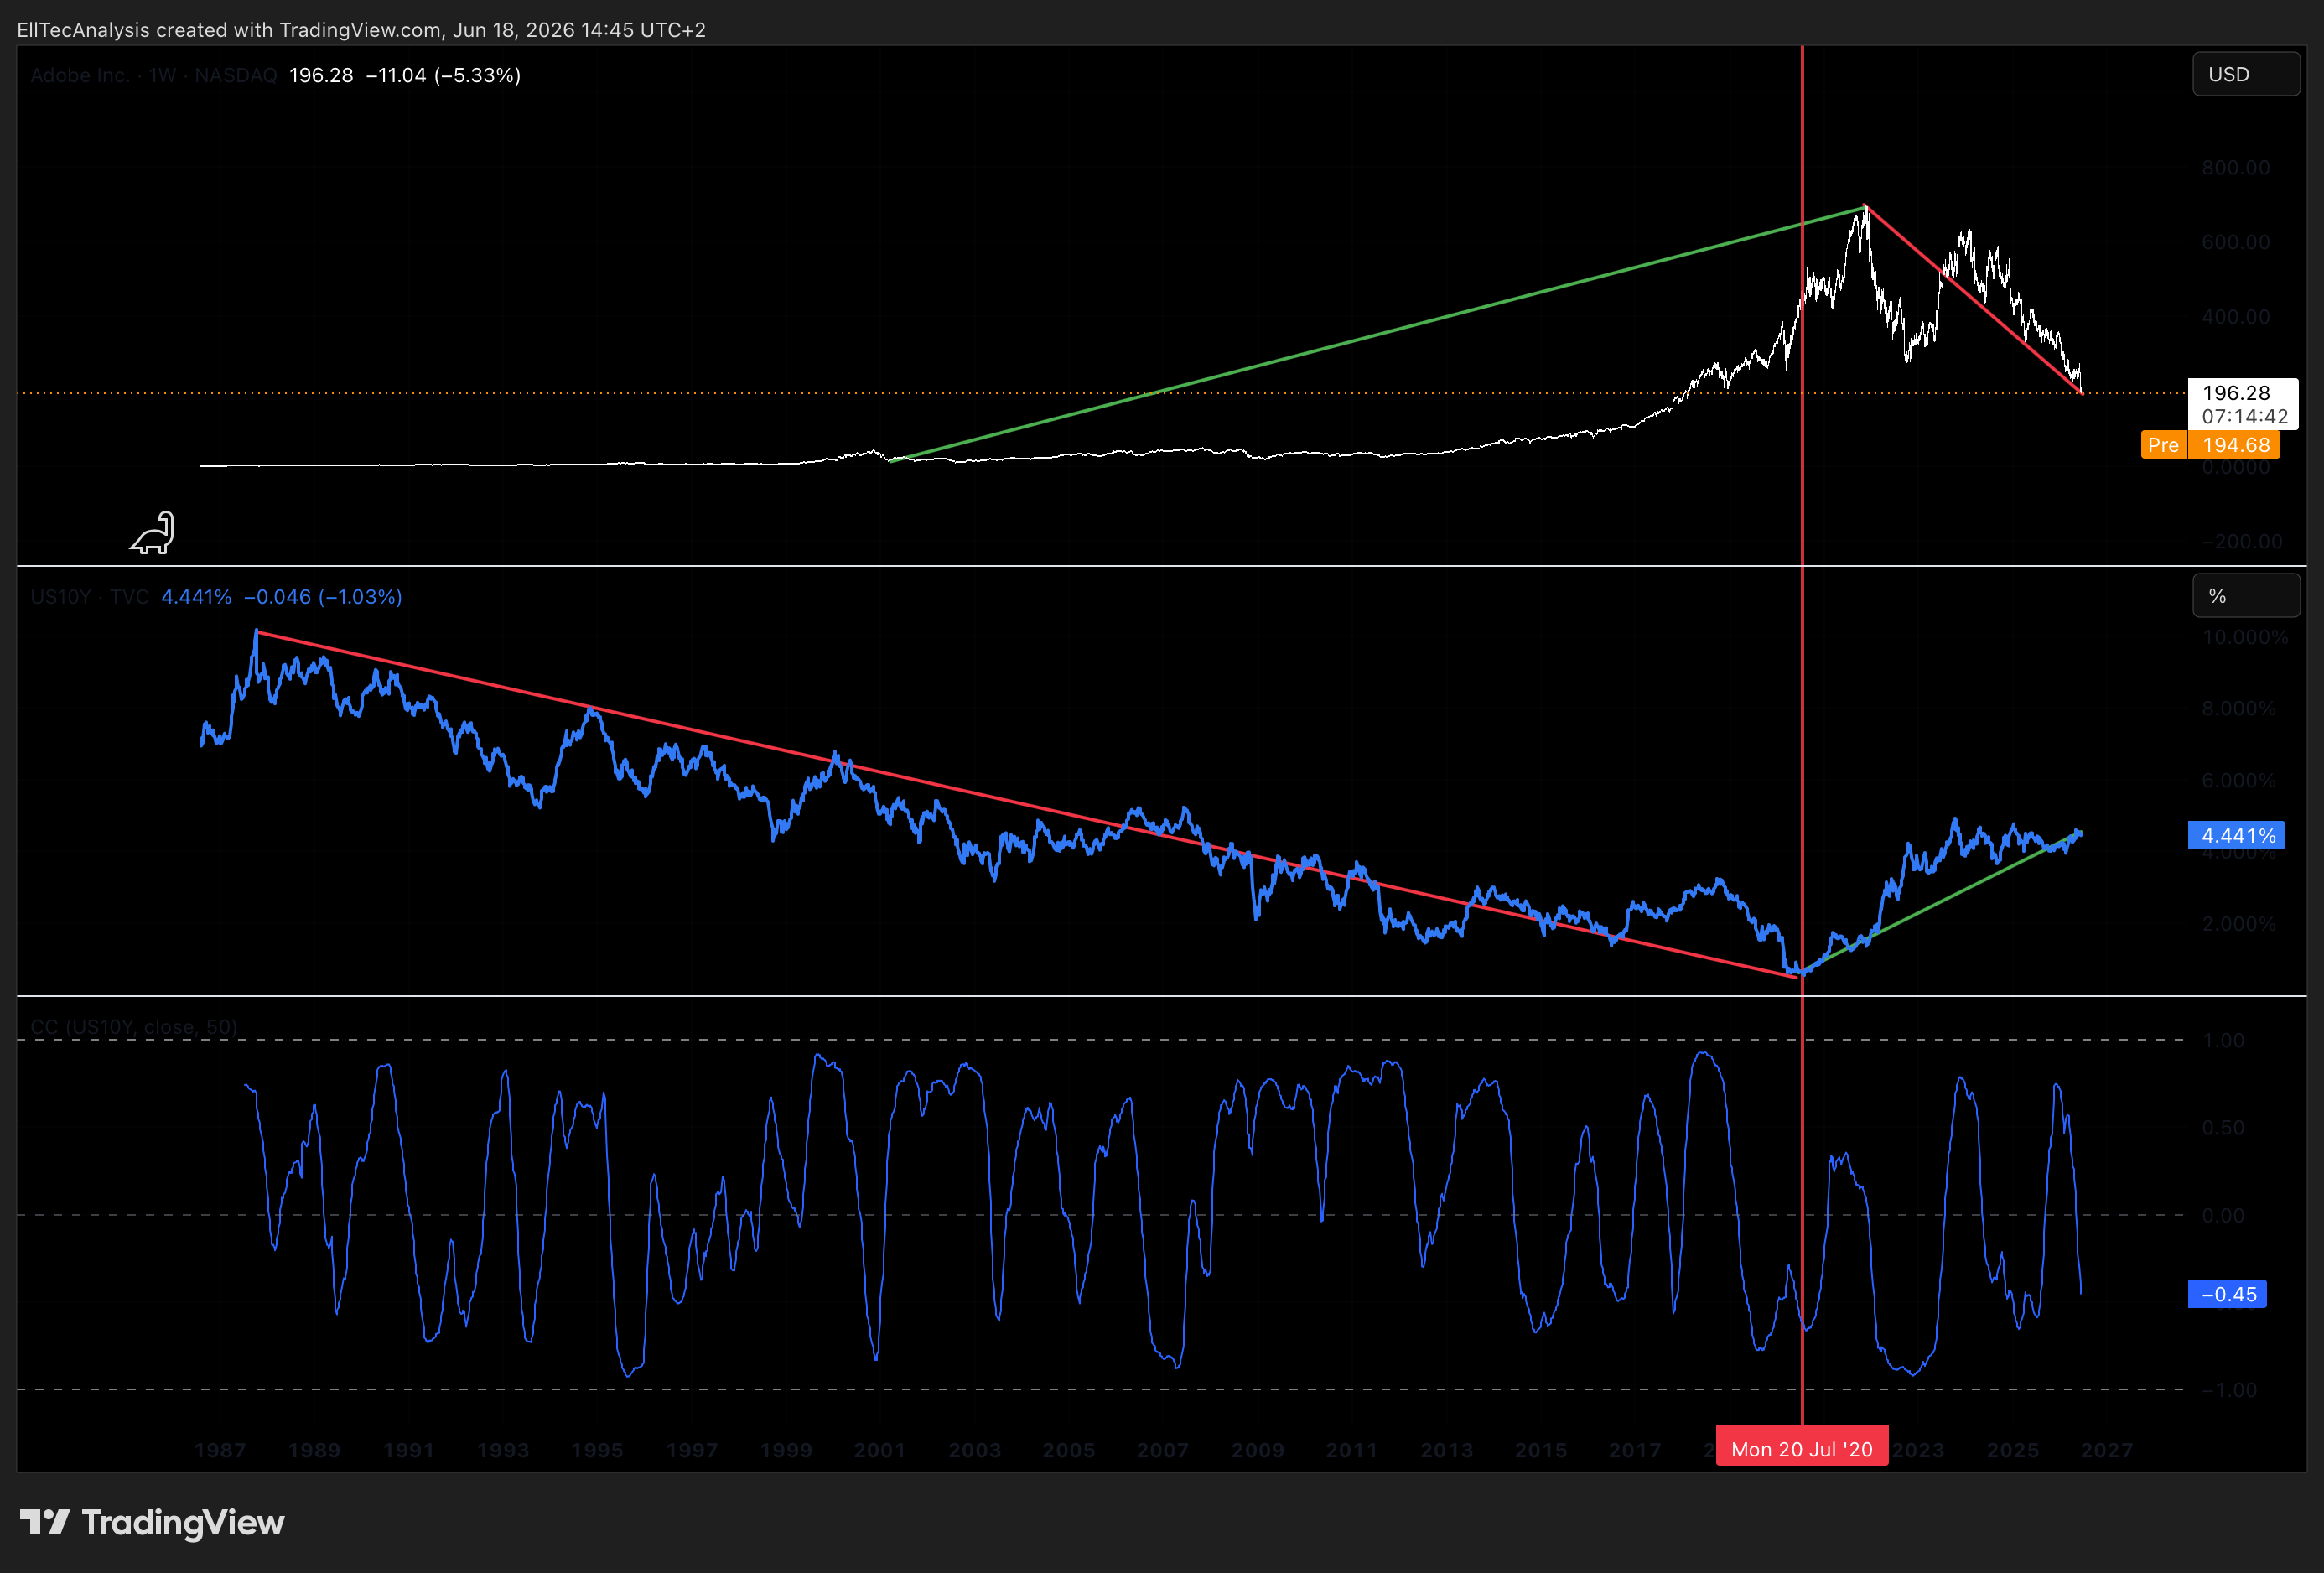
As a long duration growth asset whose valuation rests heavily on future cash flows, Adobe exhibits an inverse correlation with US Treasury yields. Rising yields compress the present value of distant earnings and have historically pressured Adobe’s multiple, while a stabilizing or declining rate environment tends to support renewed appetite for quality growth names trading at depressed valuations.
AI Sentiment / Generative AI Competitor Narrative
Beyond traditional macro correlations, Adobe has developed a unique sensitivity to the broader AI competition narrative, where headlines around new generative AI tools from competitors can trigger disproportionate selling pressure independent of Adobe’s own AI monetization progress. This sentiment driven correlation has been a primary driver of the 2026 underperformance and represents a factor that should normalize as AI first ARR continues to scale and the market differentiates between AI disruption risk and AI integration success.
3. SEASONALITY
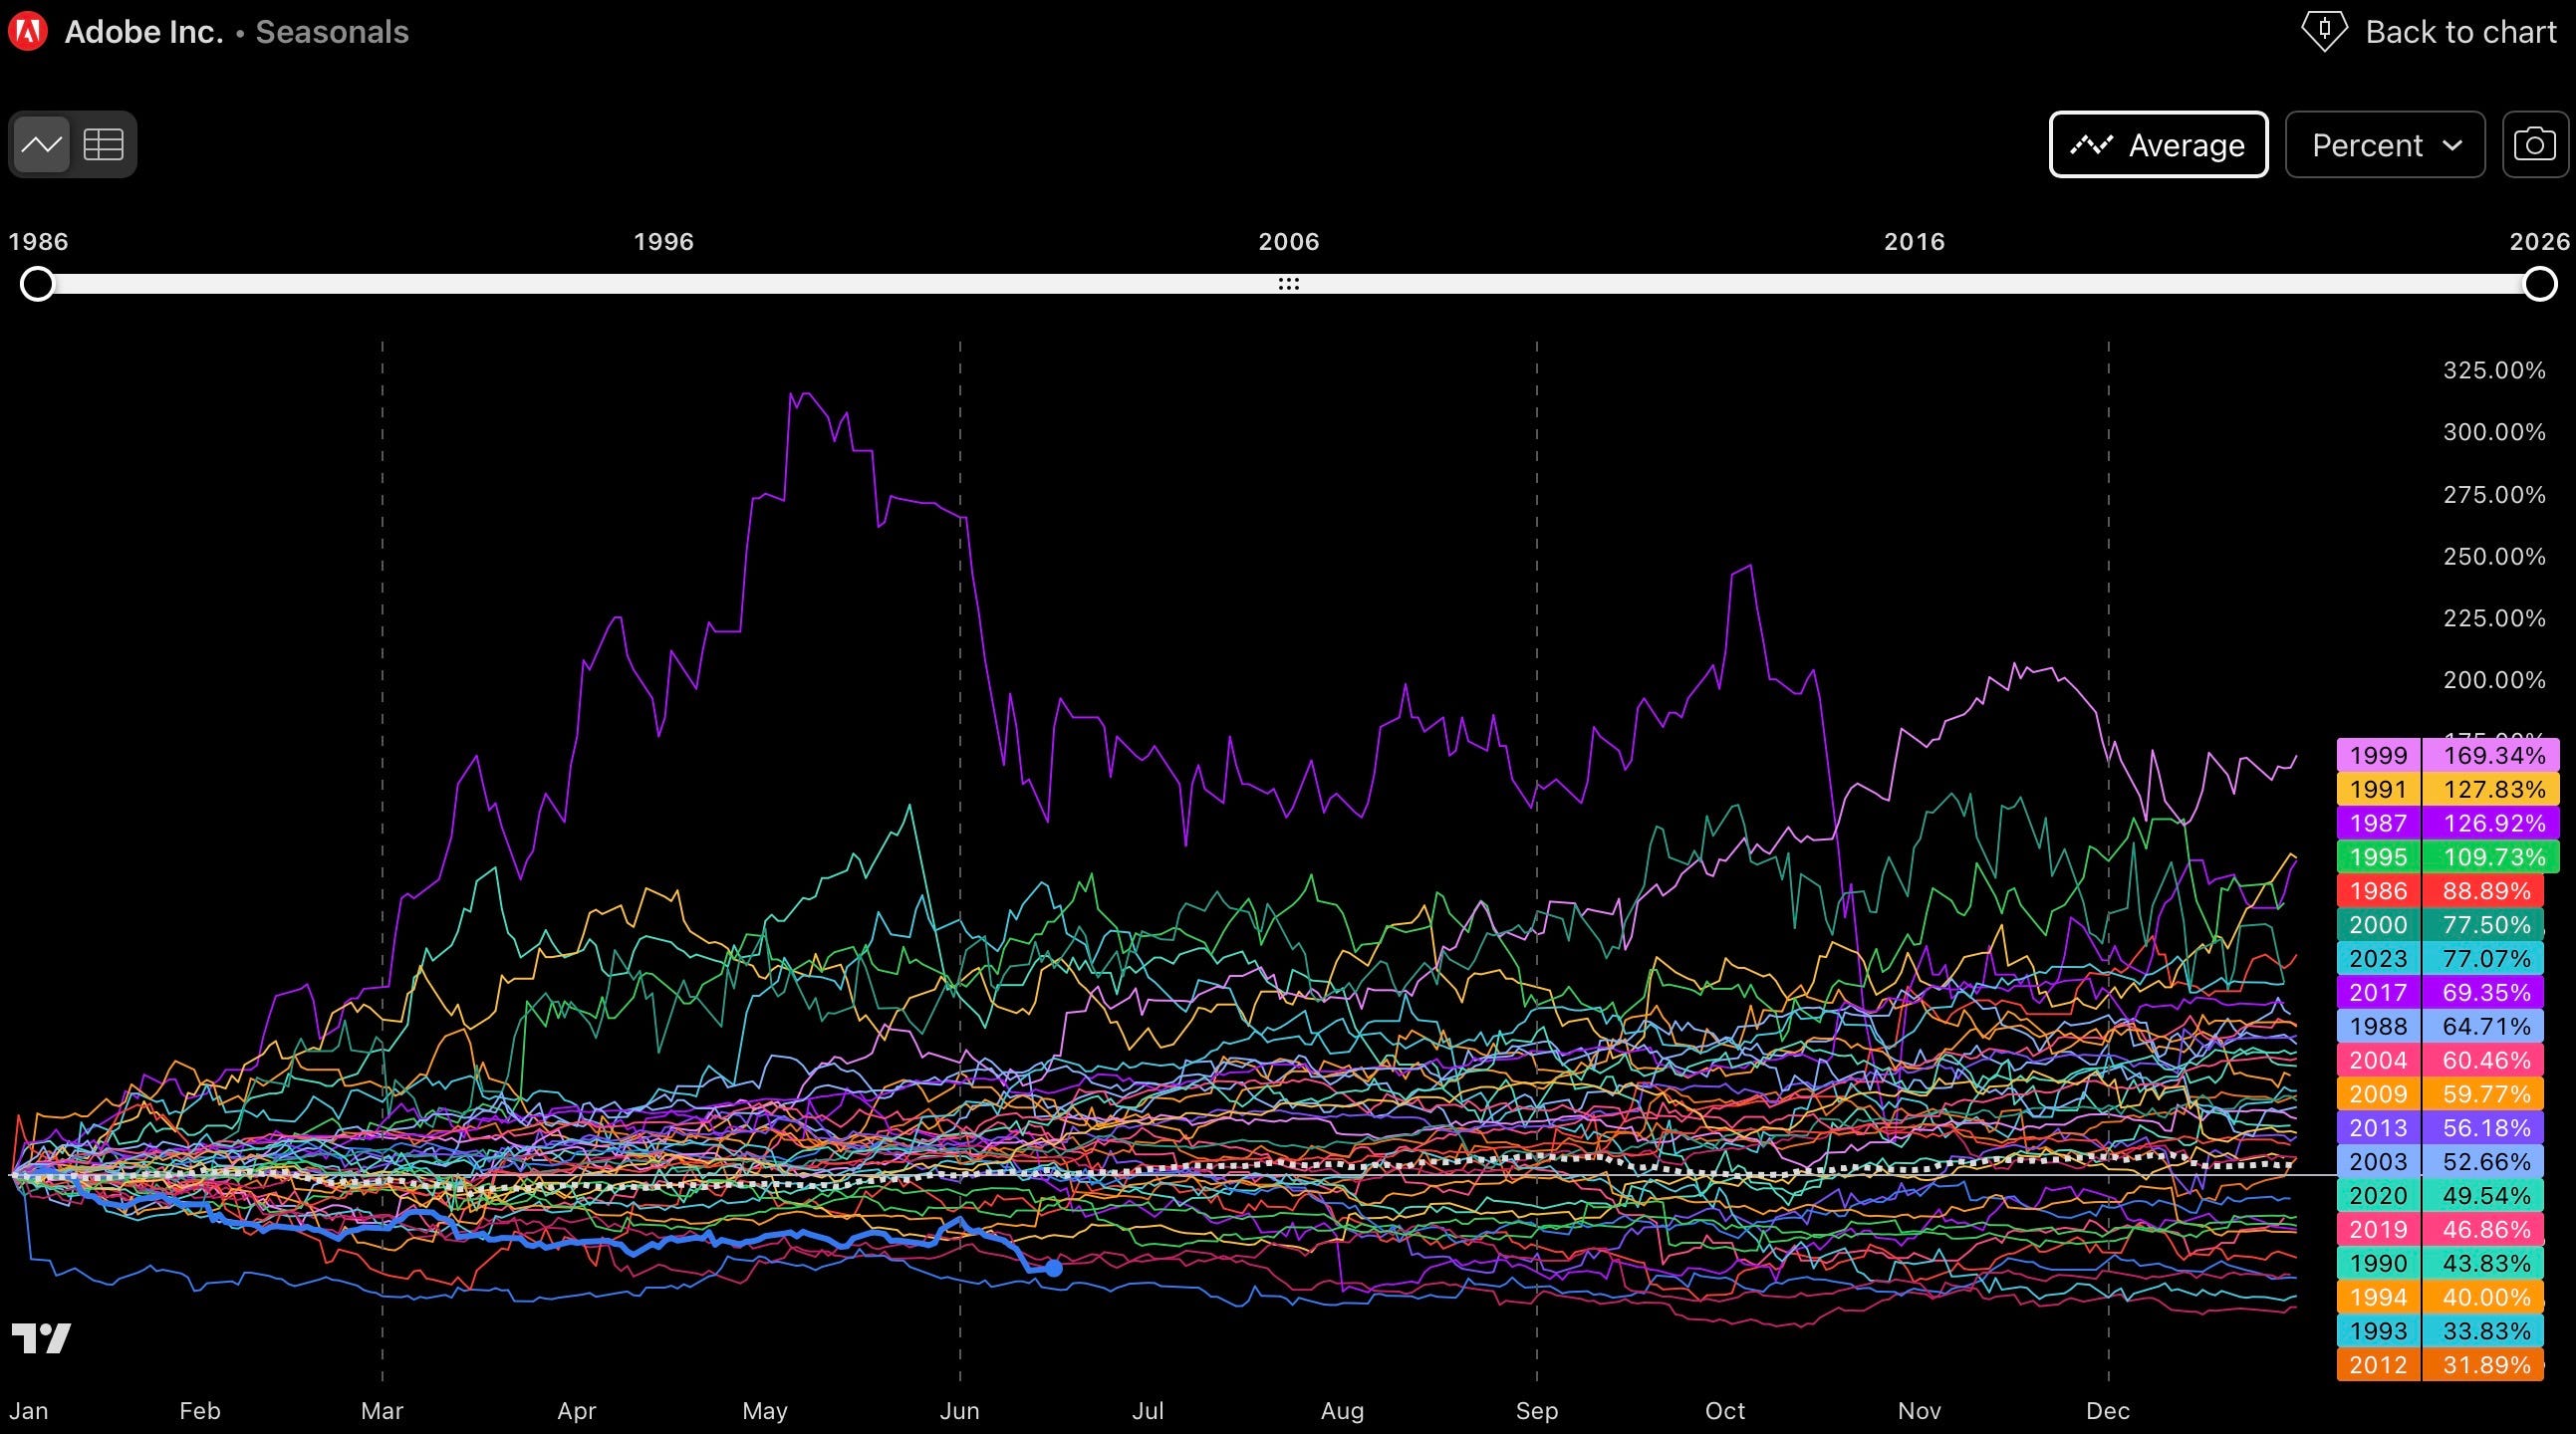
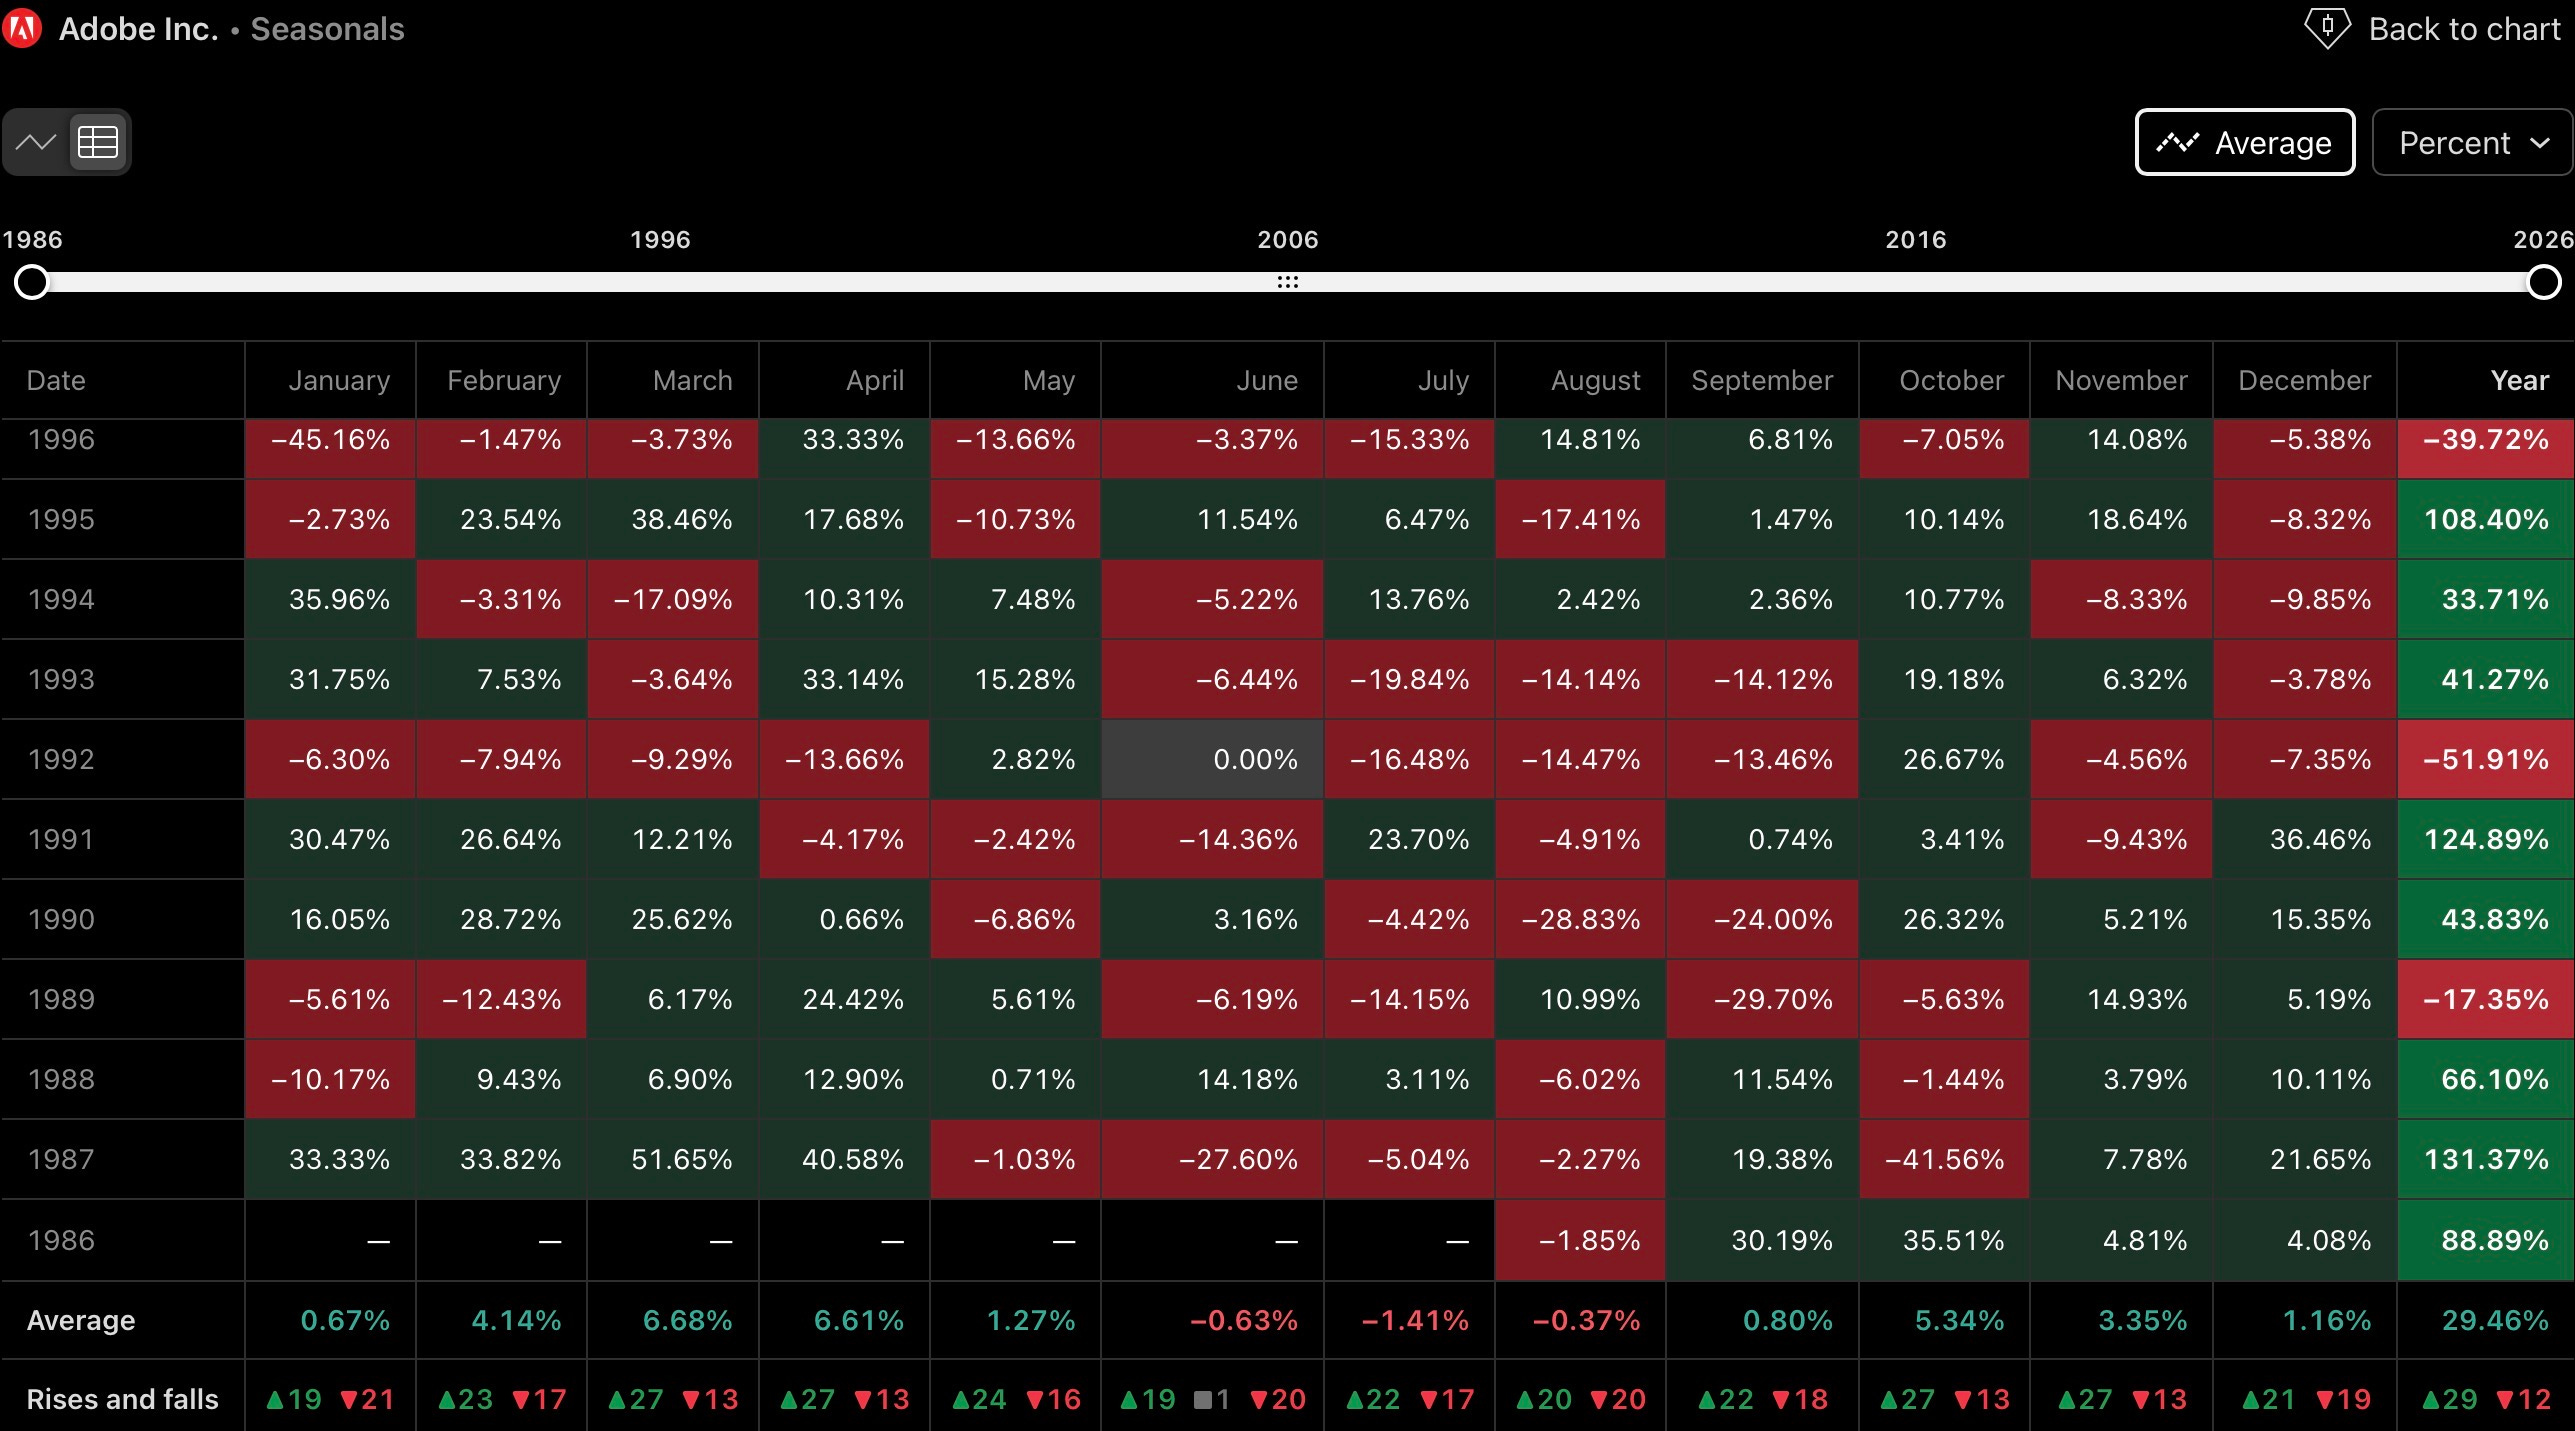
Adobe’s monthly seasonality profile shows a clearly defined weak period running through June, July, and August, while every other month of the year has historically posted positive average returns. This pattern lines up closely with the current Elliott Wave picture, suggesting that the corrective decline into Target Zone 1 may find its structural conclusion as the summer months draw to a close.
September has historically been the weakest of the positive months, averaging only 0.8 percent, which is consistent with a transitional phase where downside momentum is fading but a decisive reversal has not yet taken hold. October stands out as the month where seasonal strength becomes considerably more pronounced, with average returns of 5.34 percent, a pattern that aligns well with the Elliott Wave expectation of a final Wave 2 low being established before the asset transitions into the early stages of an impulsive Wave 3 advance. Taken together, the seasonal data supports a working assumption that the bulk of the corrective pressure should exhaust itself by the end of August, with September offering an early, still tentative stabilization phase and October historically marking the point where sustained upward momentum becomes statistically more likely.
